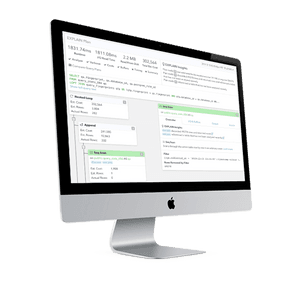
Webinar: How to use the Postgres query planner to debug bad plans and speed up queries
Understand how the Postgres query planner chooses different plans for the same query, and how to debug bad plans.
Lukas Fittl
Founder & CEO, pganalyze
Founder & CEO, pganalyze
Learn about
- How to go from a slow query to a query plan that shows which exact part was slow
- Understanding "Scans" and how Postgres decides which index to use
- Parameterized Index Scans, and how they are influenced by the join order and join type
- Why BUFFERS is important, and how to interpret the hits counter
- How to rewrite queries based on plans to speed up performance
- The different planner settings and how they influence plan choices
- How to identify when plans "fall over" to a bad query plan and why this can happen
- Identifying bad row estimates in a query, and how to correct them with better statistics
- When the auto_explain extension can be useful, and what to watch out for when enabling it
- Choosing particular query plans using planner hints with pg_hint_plan
- How managed cloud providers offer ways to control query plans (such as Aurora Query Plan Management), and how it compares to pg_hint_plan
- Using the Postgres queryid to link pg_stat_statements, pg_stat_activity and auto_explain
- Generic query plans, and how to get them from pg_stat_statements output
- Looking at query plans over time with pganalyze - and how it works behind the scenes
Watch the Webinar Recording
Hundreds Of Companies Monitor Their Production PostgreSQL Databases With pganalyze


