Webinar: Proactive Postgres Practices to Prevent Performance Bottlenecks
We cover essential proactive maintenance and monitoring practices using built-in Postgres statistics views, diagnostic tools like pgstattuple, Postgres log events that you should watch out for, and where proactive monitoring with tools like pganalyze fit in. Learn how to uncover hidden performance risks, such as slow queries, checkpoint behavior, and connection issues, before they escalate, ensuring your database stays efficient and reliable.

Lukas Fittl
Founder & CEO, pganalyze
Founder & CEO, pganalyze
In detail, we walk through
- Key early warning signs of performance bottlenecks, such as recurring wait events and unhealthy replication lag, that need intervention to resolve
- Best practices for checkpoint tuning, including settings related to Write-Ahead Logging (WAL), and how to balance crash recovery speed with performance
- Managing connections to avoid hitting limits and allocate resources effectively, and how to tune connection poolers
- Indexing strategies, including when to reindex and how to assess the impact of newly added indexes, especially in terms of blocking PostgreSQL’s HOT (Heap-Only Tuple) optimization
- Managing bloat by checking the autovacuum settings to ensure it’s running as expected to prevent new bloat and cleaning up existing bloat when needed
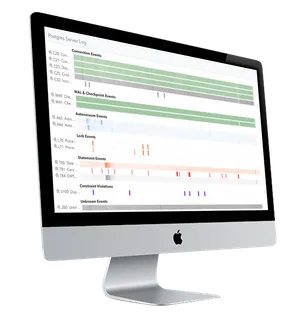
- Unlocking hidden insights in logs to detect slow queries and connection issues, like timed-out queries or deadlocks
- Best practices for team collaboration, to ensure DBAs, engineers, and SREs work together to prevent issues
Watch the Webinar Recording
Hundreds Of Companies Monitor Their Production PostgreSQL Databases With pganalyze