How we deconstructed the Postgres planner to find indexing opportunities
Everyone who has used Postgres has directly or indirectly used the Postgres planner. The Postgres planner is central to determining how a query gets executed, whether indexes get used, how tables are joined, and more. When Postgres asks itself "How do we run this query?”, the planner answers.
And just like Postgres has evolved over decades, the planner has not stood still either. It can sometimes be challenging to understand what exactly the Postgres planner does, and which data it bases its decisions on.
Earlier this year we set out to gain a deep understanding of the planner to improve indexing tools for Postgres. Based on this work we launched the first iteration of the pganalyze Index Advisor over a month ago, and have received an incredible amount of feedback and overall response.
In this post we take a closer look at how we extracted the planner into a standalone library, just like we did with pg_query. We then assess whether this approach compares to an actually running server, and what is possible now that we can run the planner code. Based on this we look at how we used its decision making know-how to find indexing opportunities, and review the topic of clause selectivity, and how we incorporated feedback by a Postgres community member.

Planning a Postgres query without a running database server
At pganalyze we offer performance recommendations for production database systems, without requiring complex installation steps or version upgrades. Whilst Postgres’ extension system is very capable, and we have many ideas on what we could track or do inside Postgres itself, we intentionally decided not to focus on a Postgres extension for giving index advice.
There are three top motivations for not creating an extension:
- Index decisions often happen during development, where the database that you are working with is not production sized
- Not everyone has direct access to the production database - it’s important we create tooling that can be used by the whole development team
- Adopting a new Postgres extension on a production database is risky, especially if the code is new - and you may not be able to install custom extensions (e.g. on Amazon RDS)
We’ve thus focused on creating something that runs separately from Postgres, but knows how Postgres works. Our approach is inspired by our work on pg_query, and enables planning a query solely based on the query text, the schema definition, and table statistics.
We utilized libclang to automatically extract source code from Postgres, just like we've done for pg_query. Whilst for pg_query we extracted a little bit over 100,000 lines of Postgres source, for the planner we extracted almost 470,000 lines of Postgres source, more than 4x the amount of code. For reference, Postgres itself is almost 1,000,000 lines of source code (as determined by sloccount).
Examples of code from Postgres we didn’t use: The executor (except for some initialization routines), the storage subsystem, frontend code, and various specialized code paths.
A good amount of engineering time later, we ended up with a seemingly simple function in a C library, that takes a query, a schema definition, and returns a result similar to an EXPLAIN plan:
/*
 * Plan the provided query utilizing the schema definition and the
 * provided table statistics, and return an EXPLAIN-like result.
 */
PgPlanResult pg_plan(const char* query, const char *schema_and_statistics)
{
  …
}
This function is idempotent, that is, when you pass the same set of input parameters, you will always get the same output parameters.
This required some additional modifications to the extracted code (we have about 90 small patches to adjust certain code paths), especially in places where Postgres does the rare on-demand checking of file sizes, or looking at the B-tree meta page. All of these are instead a fixed input parameter, defined using SET commands in the schema definition.
How accurate is this planning process?
Let’s take a look at one of our own test queries:
WITH unused_indexes AS MATERIALIZED (
  SELECT schema_indexes.id, schema_indexes.name, schema_indexes.last_used_at, schema_indexes.database_id, schema_indexes.table_id
    FROM schema_indexes
         JOIN schema_tables ON (schema_indexes.table_id = schema_tables.id)
   WHERE schema_indexes.database_id IN (1)
         AND schema_tables.invalidated_at_snapshot_id IS NULL
         AND schema_indexes.invalidated_at_snapshot_id IS NULL
         AND schema_indexes.is_valid
         AND NOT schema_indexes.is_unique AND 0 <> ALL (schema_indexes.columns)
         AND schema_indexes.last_used_at < now() - '14 day'::interval
)
SELECT ui.id, ui.name, ui.last_used_at, ui.database_id, ui.table_id
  FROM unused_indexes ui
 WHERE COALESCE((
         SELECT size_bytes
           FROM schema_index_stats_35d sis
          WHERE sis.schema_index_id = ui.id
                AND collected_at = '2021-10-31 06:40:04' LIMIT 1), 0) > 32768
This query is used inside the pganalyze application to find indexes that were not in use in the last 14 days. Running EXPLAIN (FORMAT JSON) for the query on our production system, we get a result like this:
 [
   {
     "Plan": {
       "Node Type": "CTE Scan",
       …
       "Startup Cost": 3172.85,
       "Total Cost": 3311.01,
       "Plan Rows": 11,
       "Plan Width": 60,
       "Filter": "(COALESCE((SubPlan 2), '0'::bigint) > 32768)",
       "Plans": [
         {
           "Node Type": "Nested Loop",
           …
           "Startup Cost": 1.12,
           "Total Cost": 3172.85,
           "Plan Rows": 32,
           "Plan Width": 63,
           "Inner Unique": true,
           "Plans": [
             {
               "Node Type": "Index Scan",
              "Parent Relationship": "Outer",
               …
               "Index Name": "index_schema_indexes_on_database_id",
               …
               "Startup Cost": 0.56,
               "Total Cost": 2581.00,
               "Plan Rows": 69,
               "Plan Width": 63,
               "Index Cond": "(database_id = 1)",
               "Filter": "(is_valid AND (NOT is_unique) AND (last_used_at < '2021-10-17'::date) AND (0 <> ALL (columns)))"
             },
             {
               "Node Type": "Index Scan",
               "Parent Relationship": "Inner",
               …
               "Index Name": "schema_tables_pkey",
               …
               "Startup Cost": 0.56,
               "Total Cost": 8.58,
               "Plan Rows": 1,
               "Plan Width": 8,
               "Index Cond": "(id = schema_indexes.table_id)",
               "Filter": "(invalidated_at_snapshot_id IS NULL)"
             }
...
Note that we are intentionally running EXPLAIN without ANALYZE, since we care about the cost-based estimation model used by the planner.
And now, running the same query, with its schema definition and production statistics (but not the actual table data!) provided to the pg_plan function:
[
  {
    "Plan": {
      "Node ID": 0,
      "Node Type": "CTE Scan",
      …
      "Startup Cost": 3181.43,
      "Total Cost": 3324.07,
      "Plan Rows": 11,
      "Plan Width": 60,
      "Filter": "(COALESCE((SubPlan 2), '0'::bigint) > 32768)",
      "Plans": [
        {
          "Node ID": 1,
          "Node Type": "Nested Loop",
          …
          "Startup Cost": 1.12,
          "Total Cost": 3181.43,
          "Plan Rows": 33,
          "Plan Width": 63,
          "Inner Unique": true,
          "Plans": [
            {
              "Node ID": 2,
              "Node Type": "Index Scan",
              "Parent Relationship": "Outer",
              …
              "Index Name": "index_schema_indexes_on_database_id",
              …
              "Startup Cost": 0.56,
              "Total Cost": 2581.00,
              "Plan Rows": 70,
              "Plan Width": 63,
              "Index Cond": "(database_id = 1)",
              "Filter": "(is_valid AND (NOT is_unique) AND (last_used_at < '2021-10-17'::date) AND (0 <> ALL (columns)))",
            },
            {
              "Node ID": 3,
              "Node Type": "Index Scan",
              "Parent Relationship": "Inner",
              …
              "Index Name": "schema_tables_pkey",
              …
              "Startup Cost": 0.56,
              "Total Cost": 8.58,
              "Plan Rows": 1,
              "Plan Width": 8,
              "Index Cond": "(id = schema_indexes.table_id)",
              "Filter": "(invalidated_at_snapshot_id IS NULL)",
            }
            …
As you can see, for this query the plan cost estimation is within a 1% margin of the actual production estimates. That means, we provided the Postgres planner the exact same input parameters as used on the actual database server, and the cost calculation matched almost to the dot.
Now that we’ve established a basis for running the planner and getting cost estimates, let’s look at what we can do with this.
Finding multiple possible plan paths, not just the best path
When the Postgres planner plans a query, it is under time-sensitive circumstances. That is, all extra work to find a better plan would lead to the planner itself being slow. To be fast, the planner quickly throws away plan options it does not consider worth pursuing.
That unfortunately means we can’t just run EXPLAIN with a flag that says “show me all possible plan variants” - the planner code is simply not written in a way that’s possible, at least not today.
However, with our pg_plan logic running outside the server itself, we do not have these strict speed requirements, and can therefore spend more time looking at alternatives and keeping them around for analysis. For example, here is the internal information we have for a scan node on a table, that illustrates the different paths that could be taken to fulfill the query:
    "Scans": [
      {
        "Node ID": 2,
        "Relation OID": 16398,
        "Restriction Clauses": [
	      …
        ],
        "Plans": [
          {
            "Plan": {
              "Node Type": "Index Scan",
              "Index Name": "schema_indexes_table_id_name_idx",
              …
              "Startup Cost": 0.68,
              "Total Cost": 352.94,
              "Index Cond": "(table_id = id)",
              "Filter": "(is_valid AND (NOT is_unique) AND (last_used_at < '2021-10-17'::date) AND (database_id = 1) AND (0 <> ALL (columns)))",
            },
          },
          {
            "Plan": {
              "Node Type": "Index Scan",
              "Index Name": "index_schema_indexes_on_database_id",
              ...
              "Startup Cost": 0.56,
              "Total Cost": 2581.00,
              "Index Cond": "(database_id = 1)",
              "Filter": "(is_valid AND (NOT is_unique) AND (last_used_at < '2021-10-17'::date) AND (0 <> ALL (columns)))",
            },
          },
          {
            "Plan": {
              "Node ID": 0,
              "Node Type": "Seq Scan",
              ...
              "Startup Cost": 0.00,
              "Total Cost": 3933763.60,
              "Filter": "((invalidated_at_snapshot_id IS NULL) AND is_valid AND (NOT is_unique) AND (last_used_at < '2021-10-17'::date) AND (database_id = 1) AND (0 <> ALL (columns)))",
            },
          },
As you can see, the Seq Scan option was clearly more expensive and not considered. You can also see the different index options and their costs.
What is especially interesting with this plan is that there was actually a cheaper index scan available, but Postgres did not end up using it in the final plan. This is because the Nested Loop ended up being cheaper by using the schema_indexes table as the outer table in the nested loop. The first index could only have been used if the Nested Loop relationship was inverted. That is, if table_id values were used as the input to the schema_indexes scan, instead of table_id values being the output thats matched against the schema_tables table's id column.
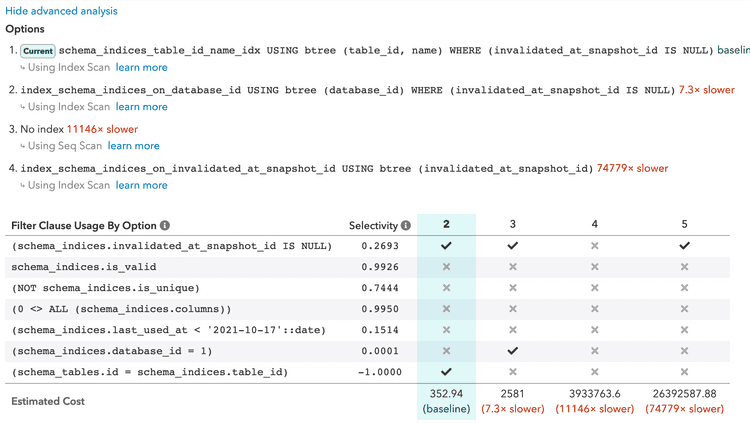
As you can see, this data can be especially useful when determining why a particular index wasn’t used, or to consider how to consolidate indexes. In the pganalyze Index Advisor this is surfaced visually in the advanced analysis view:

Note we also indicate the individual filter clauses for the scan, and show which indexes are matching each clause.
Making index recommendations based on restriction clauses
In addition to comparing different existing indexes, we can use the data available to the planner to ask the question “What would the best index look like?”.
For a scan like the above example, we get a list of restriction clauses, which is a combination of the WHERE clauses as well as the JOIN condition. For index scans to work as expected, one or more of the clauses need to match the index definition.
The data looks like this for each scan:
        "Restriction Clauses": [
          {
            "ID": 1,
            "Expression": "schema_indexes.is_valid",
            "Selectivity": 0.9926,
            "Relation Column": "is_valid"
          },
          {
            "ID": 2,
            "Expression": "(schema_indexes.database_id = 1)",
            "Selectivity": 0.0001,
            "OpExpr": {
              "Operator": {
                "Oid": 416,
                "Name": "=",
                "Left Type": "bigint",
                "Right Type": "integer",
                "Result Type": "boolean",
                "Source Func": "int84eq"
              }
            },
            "Relation Column": "database_id"
          },
         ...
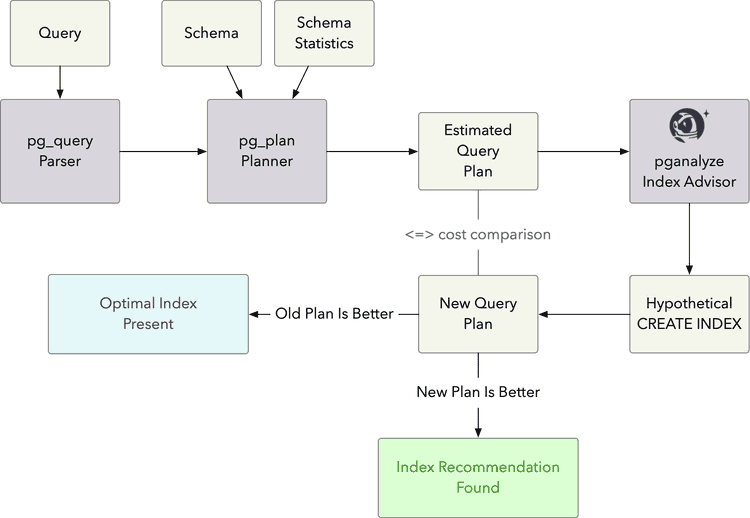
Using this data we then attempt a best guess at making a new index, run a CREATE INDEX command behind the scenes, and re-run the Postgres planner to reconsider the new index. If the cost of the new scan improves on the initial scan we make a recommendation and note the difference in estimated cost.
In summary, you can imagine the Index Advisor working roughly like this:

Understanding Postgres clause selectivity
If you look closely at the earlier advanced analysis screenshot, you will notice a new field that we’ve just made available in a new Index Advisor update: Selectivity.
What is Selectivity? It indicates what fraction of rows of the table will be matched by the particular clause of the query. This information is then used by Postgres to estimate the row count that a node returns, as well as determine the cost of that plan node.
Selectivity estimations are front and center to how the planner operates, but they are unfortunately hidden behind the scenes, and historically one would have had to resort to counting/filtering the actual data to confirm how frequent certain values are, or do manual queries against the Postgres catalog.
How does the planner know the selectivity? Counting actual table rows would be very expensive in time sensitive situations. Instead, it primarily relies on the pg_statistic table (often accessed through the pg_stats view for debugging), that keeps table statistics collected by the ANALYZE command in Postgres. You can learn more about how the Postgres planner uses statistics in the Postgres documentation.
The data in the pg_stats view can be queried like this:
SELECT * FROM pg_stats WHERE tablename = 'z' AND attname = 'a';-[ RECORD 1 ]----------+-------------------------------------------------------------------------------------------------------------------------------------------------------------------------
schemaname | public
tablename | z
attname | a
inherited | f
null_frac | 0
avg_width | 4
n_distinct | 17
most_common_vals | {2,3,7,12,13,4,1,5,11,14,9,6,10,8,15,16,0}
most_common_freqs | {0.0653,0.06446667,0.063766666,0.06363333,0.063533336,0.063433334,0.0629,0.061966665,0.061833333,0.0618,0.0611,0.0605,0.0604,0.060366668,0.059666667,0.0332,0.032133333}
histogram_bounds |
correlation | 0.061594862
most_common_elems |
most_common_elem_freqs |
elem_count_histogram | In this example you can see that there are a total of 17 distinct values (n_distinct), with values between 1 and 15 having equal frequency, and 0 and 16 being less frequent (most_common_vals/most_common_freqs). None of the rows have NULL values (null_frac).
Now, to have accurate plans in the Index Advisor, this same information can be provided using the new special SET commands in the schema definition:
SET pganalyze.avg_width.public.z.a = 4;
SET pganalyze.correlation.public.z.a = 0.061594862;
SET pganalyze.most_common_freqs.public.z.a = '{0.0653,0.06446667,0.063766666,0.06363333,0.063533336,0.063433334,0.0629,0.061966665,0.061833333,0.0618,0.0611,0.0605,0.0604,0.060366668,0.059666667,0.0332,0.032133333}';
SET pganalyze.most_common_vals.public.z.a = '{2,3,7,12,13,4,1,5,11,14,9,6,10,8,15,16,0}';
SET pganalyze.n_distinct.public.z.a = 17;
SET pganalyze.null_frac.public.z.a = 0;
You can learn how to retrieve this information, as well as all the available settings, in the Index Advisor documentation.
Based on this data we can now calculate the selectivity of a clause like z.a = 12 to determine that it is 0.0636. Or put differently, the planner estimates that 6.36% of the table would match this condition. This same information is now directly visible in the Index Advisor, when viewing the advanced analysis.
How we incorporated Postgres community feedback
At this point we’d also like to give a shout-out to Hubert Lubaczewski (aka “depesz”), who reviewed the initial version of the index advisor, had some critical feedback, and provided an example we could investigate further.
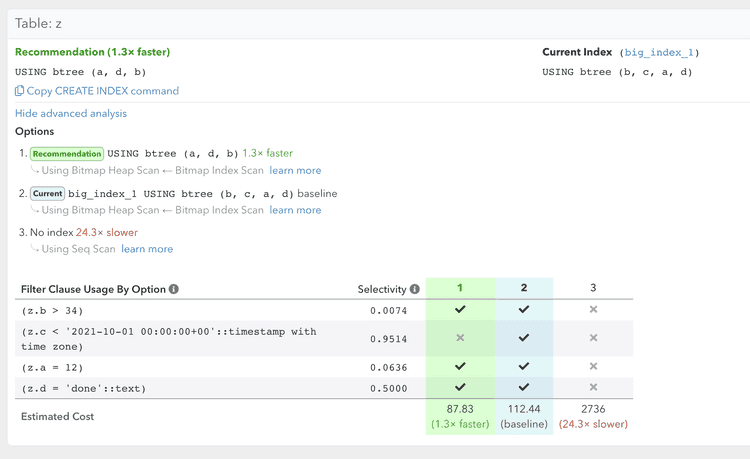
Based on improvements we've done, we now take selectivity estimates into account for index suggestions. In particular, we give priority to columns with low selectivity, i.e. those that match a small number of rows. Note this requires use of SET commands in addition to the raw schema data for the best results.
With these recent changes the pganalyze Index Advisor recommendation matches depesz's handcrafted index suggestion in the blog post:

This is a good example of how our planner-based index advisor approach can be improved and tuned, as its behavior is modeled on Postgres itself.
Creating the best index, vs creating “good enough” indexes
Another question that came up in multiple conversations, is “Should I just create all indexes that the Index Advisor recommends for each query?”.
Unless you have just a handful of queries, the answer to that is no - you shouldn’t just create every index, because that would slow down writes to the table, as they have to update each index separately.
Today, the best way to utilize the index advisor for a whole database, is to try out different CREATE INDEX statements - and make sure to update the schema definition with your index definition, to have the Index Advisor make a determination based on the existing indexes.
But we are taking this a step further. The work we are currently doing in this area is focused on two aspects:
- Utilize query workload data from
pg_stat_statementsto weigh common queries heavier in index recommendations, and come up with “good enough” indexes that cover more queries - Estimate the write overhead of a new index, based on the number of updates/deletes/inserts on a table, as well as the estimated index size
With this, not only are we targeting better summary recommendations, but we also want to help you determine when you can consolidate indexes, where you have two existing very similar indexes.
Curious to learn more? Sign up to join us for a design research session:
Join us for design research sessions
If you are up for testing early prototypes and answering questions to help us understand your workflows better, then we would like to invite you to our design research sessions:
pganalyze Design Research Sign-Up
Conclusion
Realistically, there will always be a trial-and-error aspect in making indexing decisions. But good tools can help guide you in those decisions, no matter your level of Postgres know-how. Our goal with the pganalyze Index Advisor is to make indexing an activity that can be done by the whole team, and where it’s easy to get a CREATE INDEX statement to start working from.
As you see, the Index Advisor is based on the core logic of Postgres itself, and that forms the basis for making complex assessments behind the scenes. We believe in an iterative process and sharing what we’ve learned, and hope to continue the conversation on how to make indexing better for Postgres.
We've recently made a number of updates to the Index Advisor. Give it a try, and use the new SET table statistics syntax for best results. Encounter an issue with the Index Advisor? You can provide feedback through our dedicated discussion board on GitHub, or send us a support request for in-app functionality.
If you want to share this article with your peers, feel free to tweet it.


