Query drill-down analysis and per-query statistics
See detailed statistics on a per-query basis and know what to focus your efforts on.
Identify slowdowns for specific queries over time (e.g. due to a different query plan being chosen), I/O vs CPU time for each query, or buffer cache hit ratio for each query.
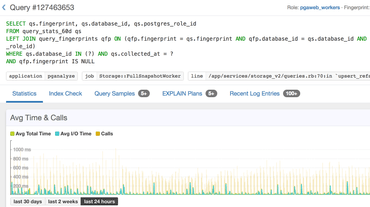
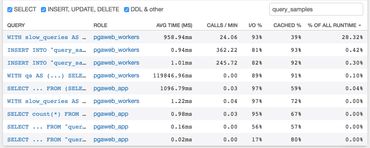
Catch slow queries before they become big problems
Benefit from insights into your query performance history to detect slow queries.
pganalyze lets you sort all queries on your database by different characteristics, such as “% of all runtime”, “average runtime”, or “calls per minute”.
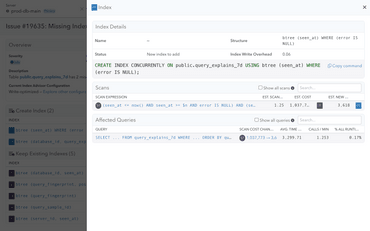
pganalyze Index Advisor
Easily avoid a common cause for slow query performance: A missing index.
pganalyze will highlight why a slow query is slow and whether an index can be created to make the query perform faster.
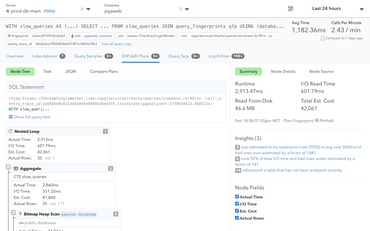
Postgres explain plans
Drastically improve your database performance with explain plans.
pganalyze automatically collects explain plans for slow queries from when the query was executed using auto_explain. This allows you to get insights on how PostgreSQL executes its query plan and identify performance bottlenecks.
Specific example queries for more insights
Understand which tenants in your system are producing slow queries.
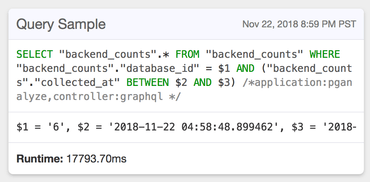
Extract specific query samples from your log files and see them associated in one place together with your query statistics. This provides you with the insights you need to improve PostgreSQL query performance.
Hundreds Of Companies Monitor Their Production PostgreSQL Databases With pganalyze


