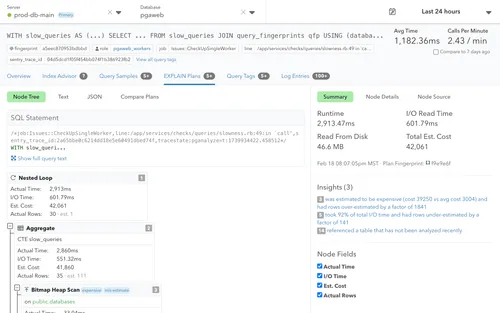
Visualization of query plans
View EXPLAIN plans in a convenient tree view. For each node, we have specific information highlighted, that shows what’s most important for that plan.
We also make sure to highlight facts you might otherwise miss, such as how often each node was repeated due to a Nested Loop.
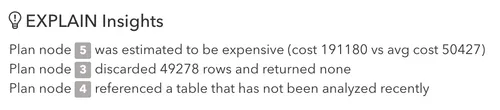
EXPLAIN plan insights
Query plans provide a lot of detail. It can be challenging to recognize which information is most important. Quickly see built-in analysis and plan insights based on query plan information, as well as other information from your database (e.g. sorts spilling to disk, sequential scans that are inefficient, or statistics being out of date).
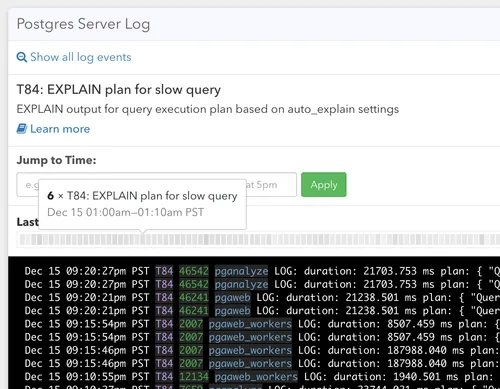
Direct integration with auto_explain
We automatically gather the auto_explain output on your behalf from the Postgres logs, so you can easily view the plans in pganalyze without extra effort.
Manually running EXPLAIN poses risks of using inaccurate data, for example when you had an outage and the EXPLAIN plan changed since then. Explore Log Insights for auto_explain→
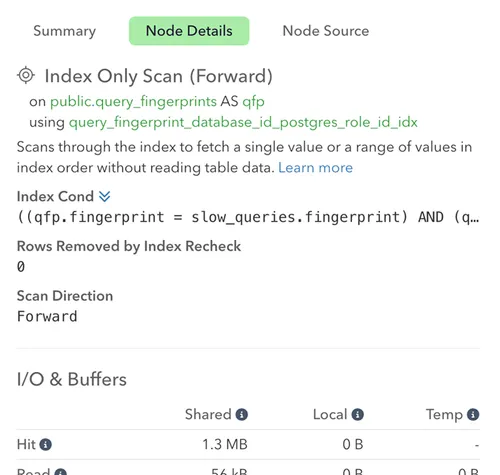
Easy references to schema data
We provide you with additional information next to details about a query plan.
Easily access the relevant schema data for a table that a Sequential Scan node has scanned, and review which indexes exist on the table. Quickly find out when the last ANALYZE activity happened on a table, to understand whether statistics are out of date.
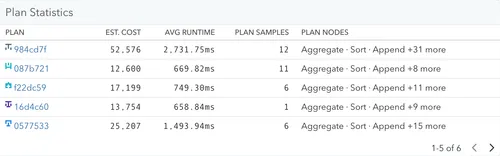
Grouping of similar plans
Often times you’ll have plans collected for the same query that only differ on minor details such as how many rows were filtered.
pganalyze automatically groups similar query plans together to make sure you focus on plans that differ significantly, such as when PostgreSQL chooses a Sequential Scan instead of an Index-Only Scan.
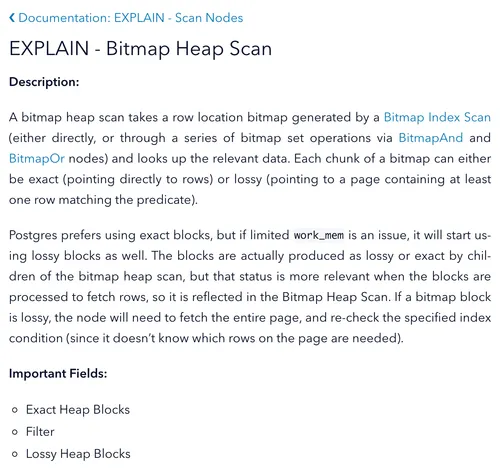
Detailed documentation
Understanding what different PostgreSQL plan nodes are doing can be hard.
What is the role of a Gather node in a parallel plan? When does PostgreSQL choose an Index-Only Scan, vs an Index Scan, vs a Bitmap Heap Scan? What does an Append node do?
For each of these nodes, we have dedicated documentation pages that explain in detail what you need to know, and which actions to take when specific nodes show up as being slow.
Hundreds Of Companies Monitor Their Production PostgreSQL Databases With pganalyze