Get insights via sophisticated dashboards
Stop wasting time with command line tools.
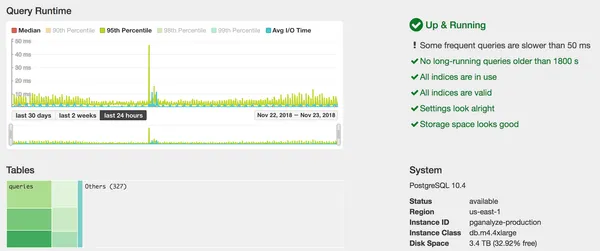
The pganalyze dashboards allow your team to efficiently get insights into your database performance and highlights areas of improvement. Our graphs help you conduct query drill-down analysis to surface interesting findings and help uncovering root causes in minutes.
Analyze meaningful trends and historic query performance
Be armed with the knowledge on how to improve database performance.
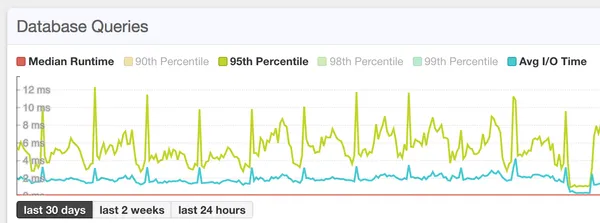
pganalyze lets you monitor your database growth and table sizes, gives insights into your query performance history from up to 60 days, and shows CPU utilization over time.
Monitor your key metrics in real-time
Don’t jump around between multiple services.
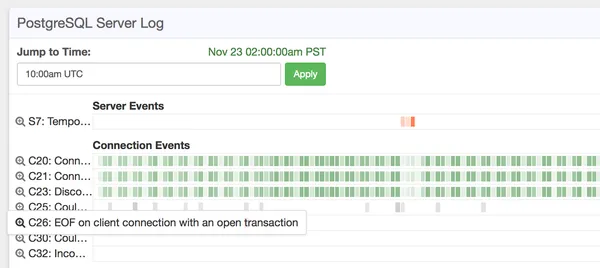
With pganalyze, you can view your logs and query statistics in one single platform. Monitor database connection limits and get real-time insights into your query performance.
Collect insights with Postgres Autovacuum Monitoring
Turn the needle on your Postgres performance.
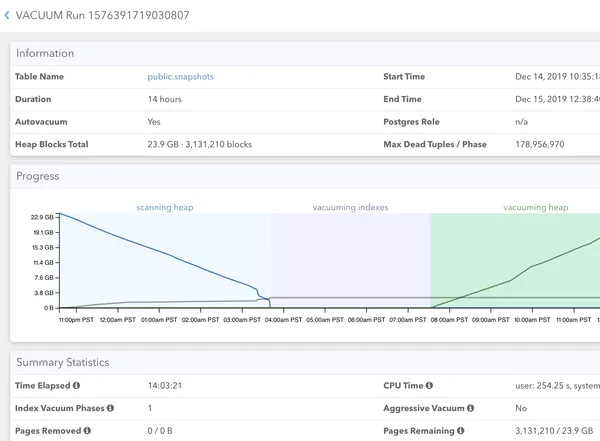
Collect detailed insights on one of the most important Postgres operations and receive tuning recommendations for your per-table autovacuum configuration.Explore VACUUM Advisor→
Hundreds Of Companies Monitor Their Production PostgreSQL Databases With pganalyze