Customer Story: How Atlassian and pganalyze are optimizing Postgres query performance
Download as PDFAtlassian is a software company that aims to unleash the potential of every team. The company currently serves more than 119,000 customers worldwide and has 15 products, which help teams organize, discuss, and complete shared work via project tracking, content creation and sharing, real-time communication, and service management.
Atlassian is best known for Bitbucket, Confluence, Jira Software, Jira Service Desk, Hipchat, Statuspage, Stride, and Trello. Atlassian has been using Postgres since the early days of its Cloud products.
Since 2016, Atlassian has used pganalyze to uncover a number of benefits, including:
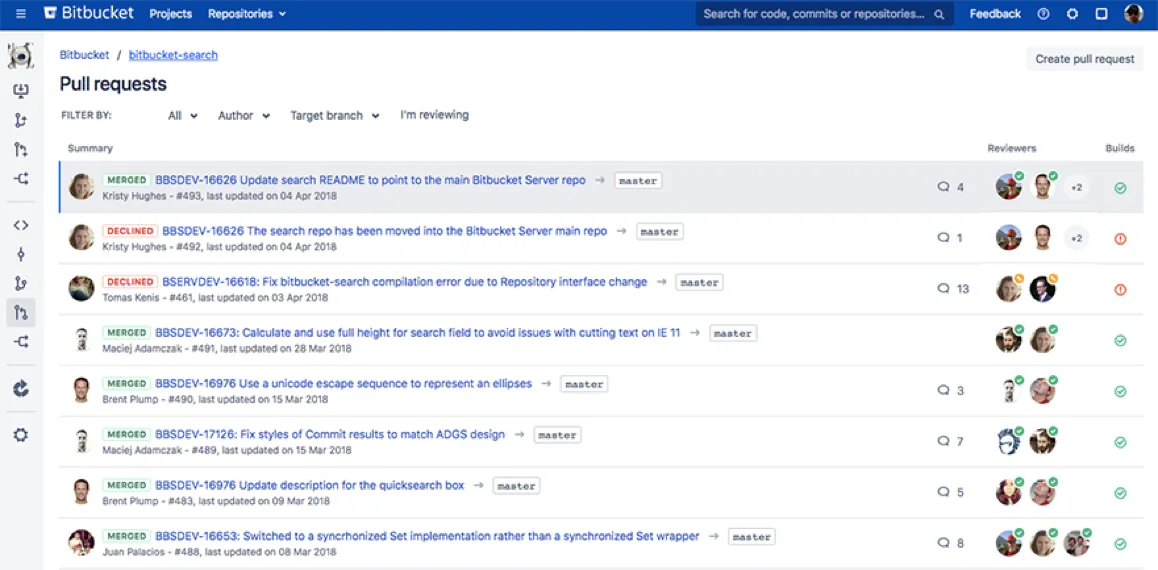
- Comprehensive Postgres performance monitoring for products like Bitbucket Cloud and microservices such as the Media API, which provides file management functionality across many Atlassian products
- Identification of problematic queries within minutes, leading to faster development and incident resolution
- Query analysis and missing index checks for many different ORM frameworks, such as Django, SQLAlchemy and Sequelize, as well as for JDBC
- Easy access to Postgres performance statistics, without needing access to the production database

The Challenge
Engineers at Atlassian work with Postgres databases every day. Postgres powers flagship products like Jira, Bitbucket and Confluence, and internal microservices like the Media API.
Before using pganalyze, Atlassian faced three main challenges in optimizing their Postgres Performance:
- Engineers spent considerable time finding problematic queries, and manually running Postgres statistics queries to debug problems
- Historic statistics data and details on specific slow queries were often not available
- Production database access was required to debug performance problems, but such access is restricted and sometimes unavailable due to the risk of accessing customer data containing PII
Debugging production problems was challenging for engineers. That’s when Atlassian started looking for a better approach, and found pganalyze.
The Solution
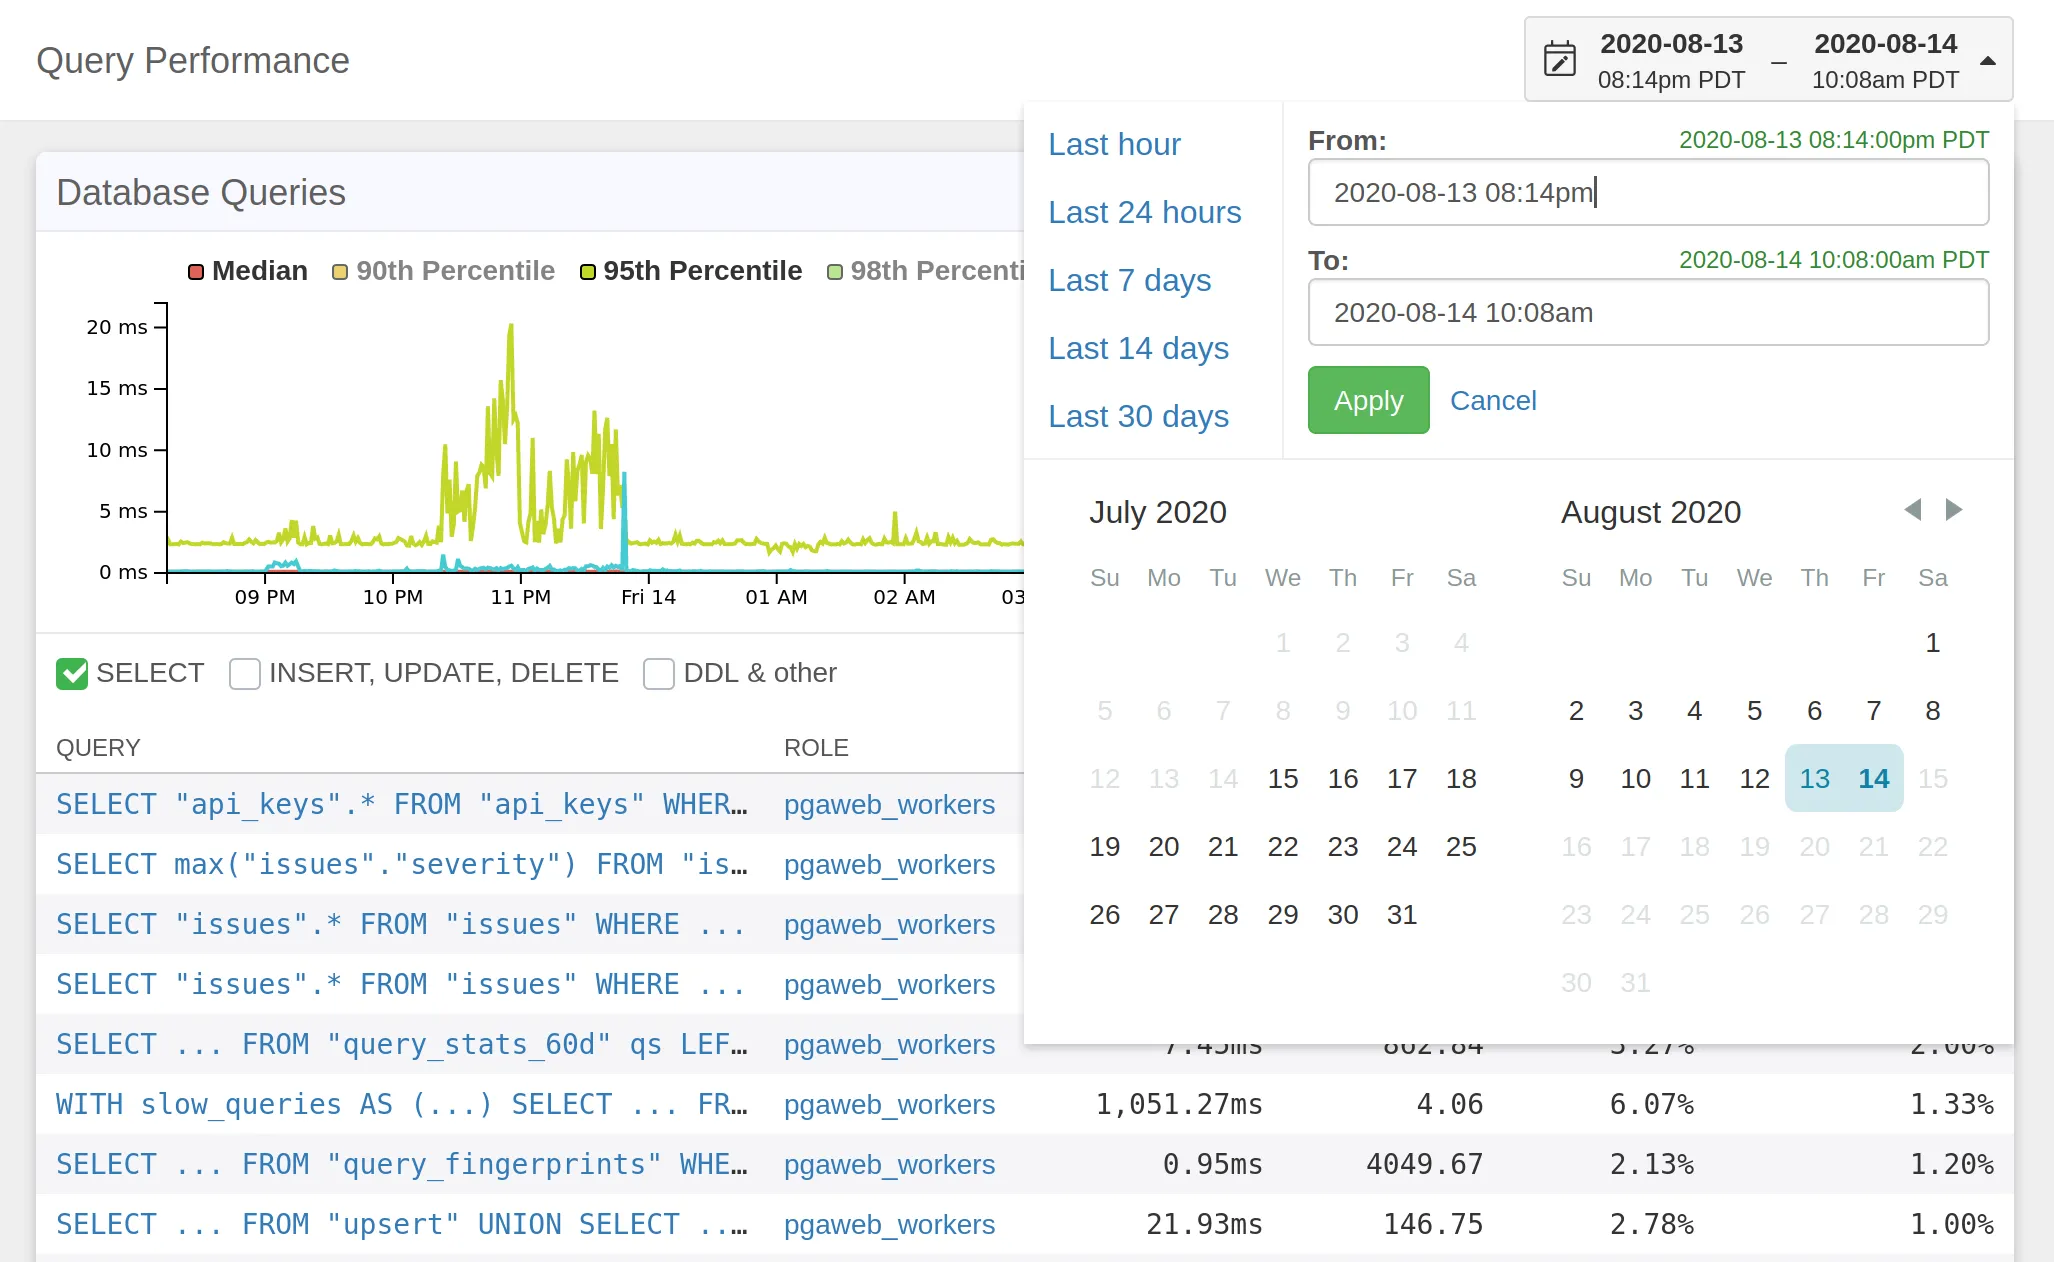
Once pganalyze was introduced at Atlassian, engineers could analyze and understand production problems as they were happening, using a unified database performance dashboard. pganalyze provides Atlassian with the following features:
- Top-down query performance view, with flexible sorting and filtering
- Detailed per-query pages that show historic query performance
- Breakdown of CPU vs I/O bound queries
- Automated missing index checks
- Email-based alerts for database issues
- Full integration with Amazon RDS, including CloudWatch and log file monitoring
Through pganalyze’s detailed query performance statistics, Atlassian’s engineering teams are able to pinpoint the root cause of an issue quickly, mitigate the problem, and verify that their deployed solution works as expected.

The Results
Since adopting it in 2016, Atlassian has been using and seeing the benefits of pganalyze’s advanced monitoring capabilities to support their extensive Postgres setup. Teams of all sizes across the company can now easily monitor their database and optimize performance from the comfort of the pganalyze web interface.
pganalyze has also increased collaboration and saved time. pganalyze is integrated with Atlassian’s Active Directory for authentication, providing seamless access without managing new user accounts.
Engineers can work better with Postgres DBAs, and can easily share and discuss performance problems using the statistics data collected. In addition, thanks to the detailed query performance analytics, alerting, and database monitoring provided by pganalyze, Atlassian engineers are working more efficiently.