


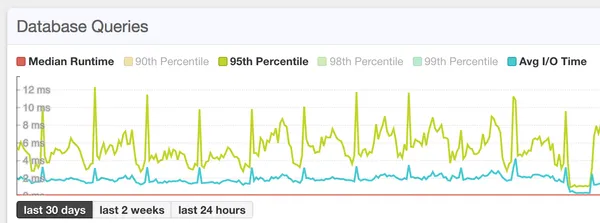
Comparison Over Time & Analyze Trends
Often times a performance issue you are investigating has occurred in the past, instead of happening at this very moment.
pganalyze allows easy access to historic data, and provides the tools that help with optimizing and performance tuning of your Postgres databases, including drill-down analysis.
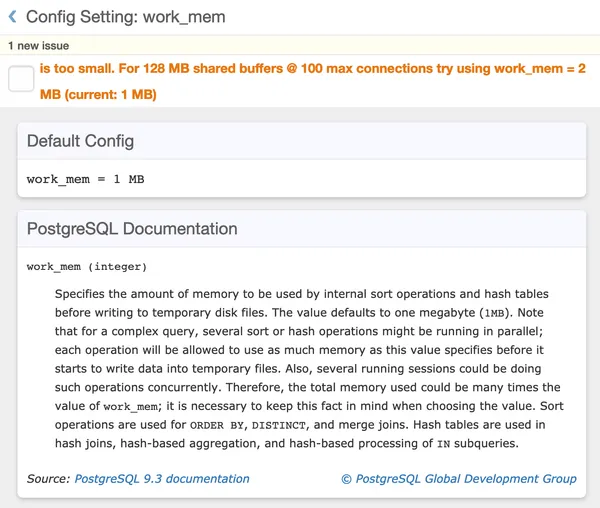
Config Tuning Recommendations
Set up automated checks that analyze your Postgres configuration and suggest optimizations.
pganalyze also detects per-table configuration, for example for table-specific autovacuum settings. Get detailed recommendations with VACUUM Advisor→
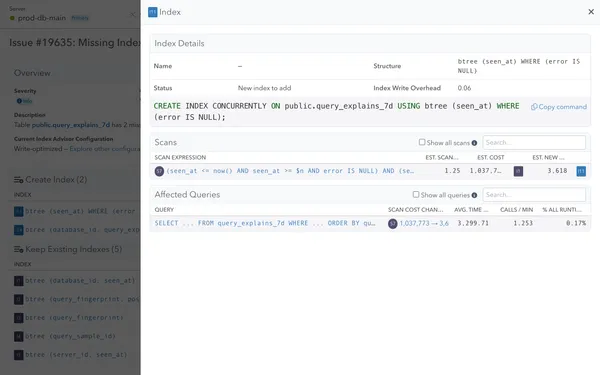
pganalyze Index Advisor
pganalyze highlights why a problematic query is slow and whether an index is potentially missing.
Once the index has been created, you can compare query performance and see the query speed improvements.
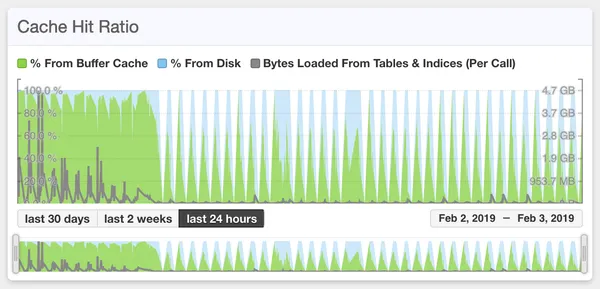
Buffer Cache Hit Ratio
The buffer cache is a central component of Postgres, and amongst other things is responsible for providing previously loaded data without having to go to disk.
In pganalyze you can easily see buffer cache hit ratio for each query, over time.