auto_explain Integration

Postgres Vacuum Monitoring
PII Filtering
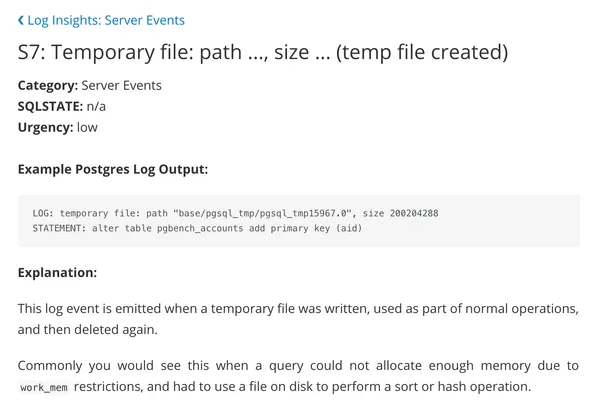
Detailed Log Insights Documentation
It can be confusing working with hundreds of different log events, which is why we’ve written detailed documentation, providing additional community resources when available, as well as instructions on how to resolve critical events.
Learn more about how to handle out of memory errors, server crashes, and more. Explore the Log Insights documentation→.
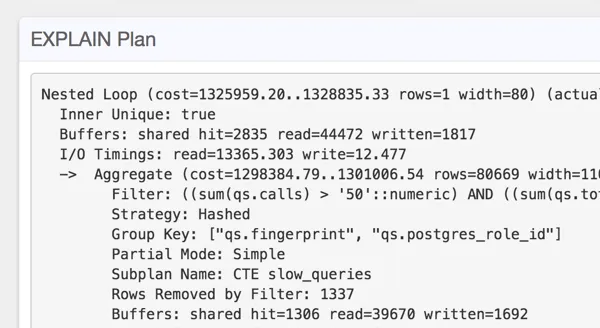
auto_explain Integration
Often times the most important part of debugging a query performance problem is the execution plan.
Using pganalyze Log Insights you can automatically extract the output for the auto_explain extension that comes bundled with Postgres.
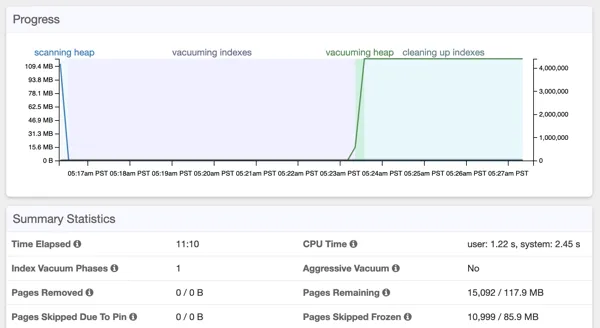
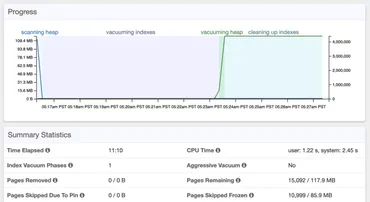
Postgres Vacuum Monitoring
There are multiple sources of getting vacuum information in Postgres. The logs contain important information about how efficient a vacuum has run, and whether there are any tuples it could not clean up.
pganalyze Log Insights automatically combines this information with the statistics data, and presents it in one unified interface.
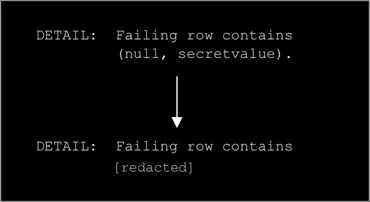
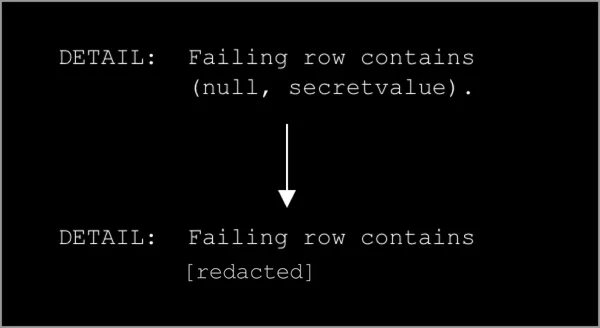
PII Filtering
Postgres logging can produce a variety of information, and often this contains details of the query that has run, or the information that is being inserted into the database.
pganalyze Log Insights has over 100 log filters for known Postgres log events, and is able to distinguish the log message itself from any sensitive information that might be contained. This enables the pganalyze collector to filter out such PII before it gets sent to the pganalyze service.
Hundreds Of Companies Monitor Their Production PostgreSQL Databases With pganalyze