
pganalyze Log Insights
Welcome to pganalyze Log Insights - the best way to monitor and analyze your PostgreSQL log files, and give you insights into how to tune your database better, or to explain why your database might be slow at a given moment.
Setting up Log Insights
To start, follow the platform-specific setup steps:
- Amazon RDS and Amazon Aurora
- Azure Database for PostgreSQL
- Google Cloud SQL and AlloyDB
- Heroku Postgres
- Crunchy Bridge
- Aiven
- Self-Managed Server
Making the most of Log Insights
After you have completed the initial setup of Log Insights, we recommend two more steps:
- Tune Postgres logging parameters
Enable additional important log events for your Postgres server. - Set up automatic EXPLAIN plan collection
Automatically get detailed EXPLAIN plans for slow queries in your system.
Limits
Log Insights is subject to rate limits for incoming log data.
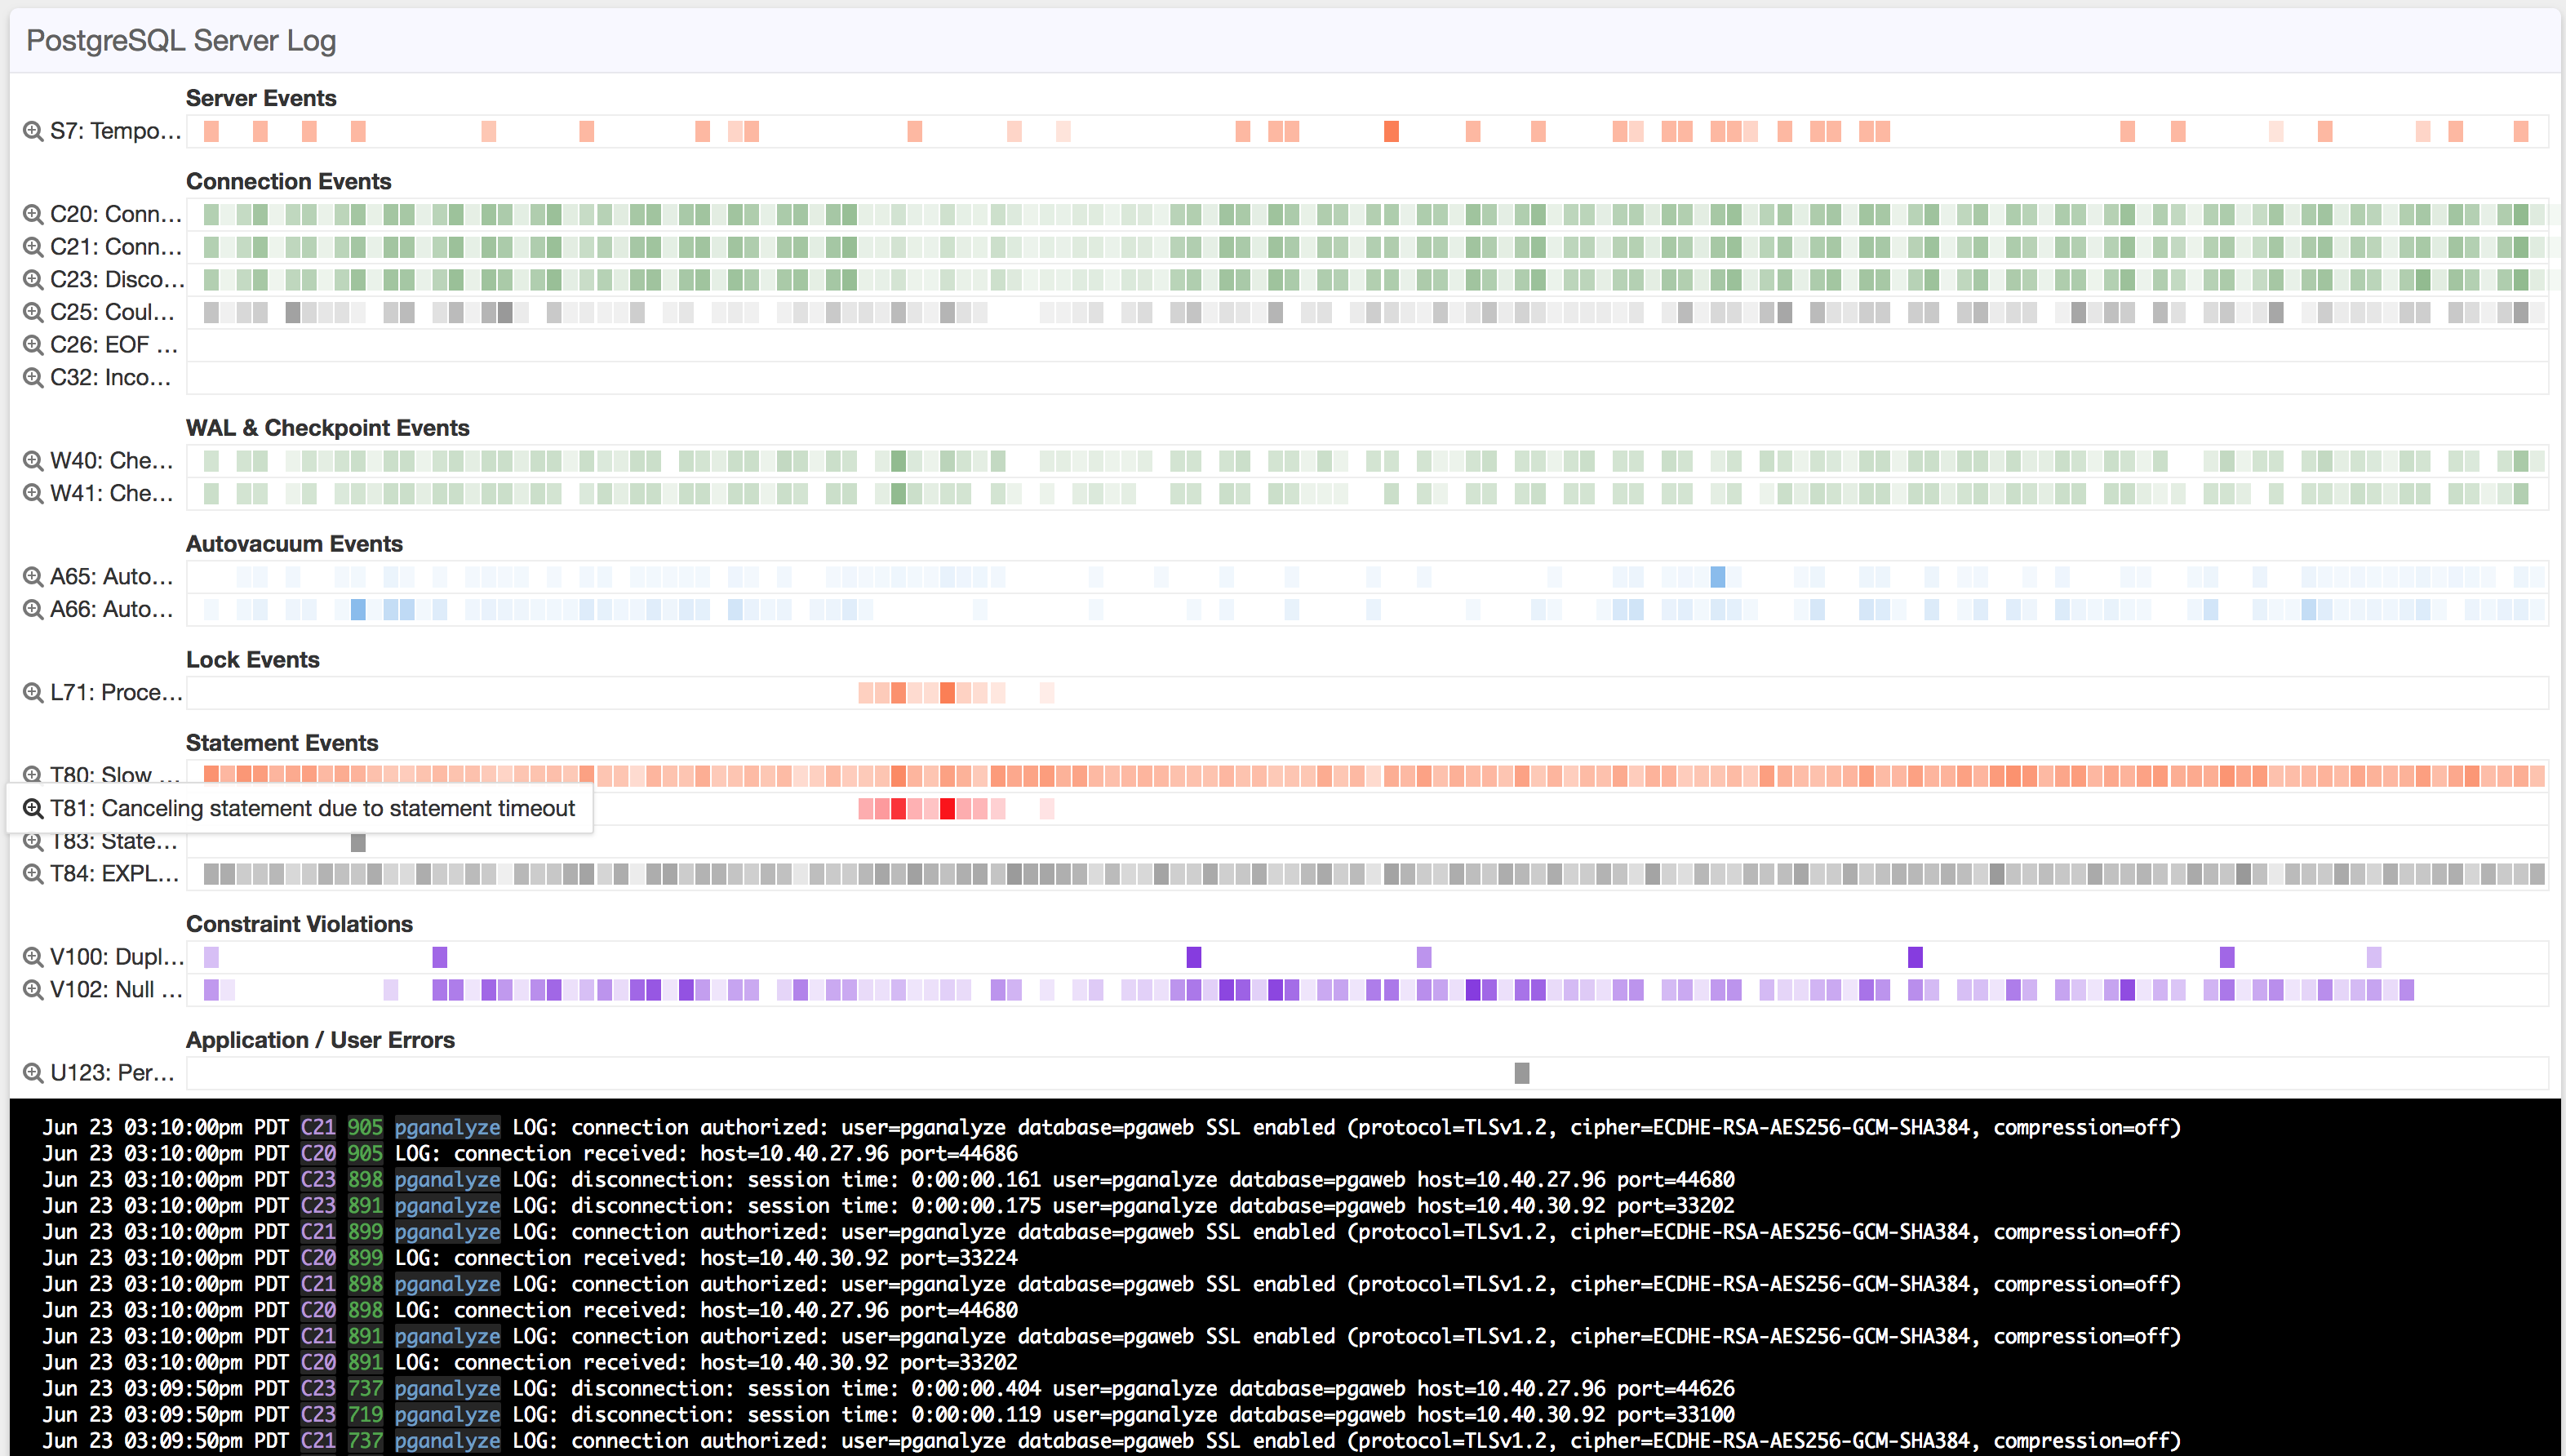
Log Events
Internally in pganalyze each log line gets assigned one of the event types below, to uniquely identify the circumstances under which such an event was triggered.
These classifications are then used for alerting and filtering purposes, and allow you to quickly find the corresponding documentation for an event.
Log Event Categories:
- Server
- Connections
- WAL & Checkpoints
- Autovacuum
- Locks
- Statements
- Standby Servers
- Constraint Violations
- Application Errors
Log event types in comparison to SQLSTATE
Those familiar with SQL error codes (SQLSTATE) might ask themselves: Why invent yet another log line categorization system?
In our experience working with Postgres logs, whilst the SQL error codes in logs are useful (if they are being output), they unfortunately cover less than 50% of the useful log events we encountered.
Where available this documentation includes a reference to the corresponding SQLSTATE code, so you can match it up.
Couldn't find what you were looking for or want to talk about something specific?
Start a conversation with us →