
Monitoring Postgres connections
The Connections page in pganalyze contains information about database
connections, using the data from the pg_stat_activity view.
Select just a server to get overall connection info, or select a specific
database as well to get more detailed data such as wait events.
You can check the history of connection states in the History chart. This chart is using data collected every 10 minutes. This section helps you understand the trend of the total count of connections or unusual patterns such as an increase in Waiting For Lock connections.
Connection States tab
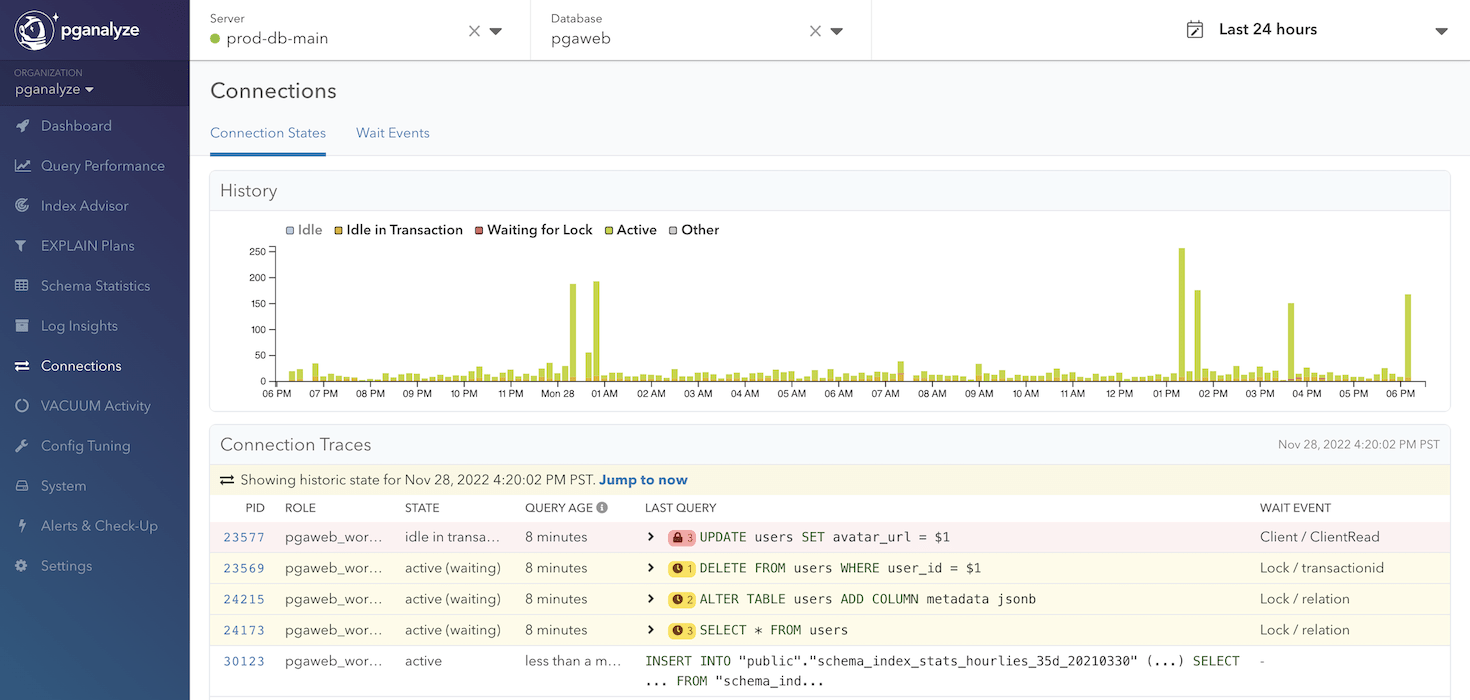
The Connection States tab has the History chart and the Connection Traces panel. The Connection Traces panel shows what kind of queries are running currently, with an automatic refresh to keep the display current (it will pause after a while). You can also jump to a certain time point’s Connection Traces by clicking a specific time on the History chart.
The Connection Traces panel is only available on the Scale Plan and higher.
Lock Monitoring
You can monitor various wait events, including locks, with the Wait Events tab. The History chart of the Connection States tab also gives you the historical count of Waiting For Lock state connections.
With the Lock Monitoring feature, you can dig deeper into this lock information. Within Connection Traces panel in Connection States tab, whenever a connection is waiting for a lock, the background color of the row will be highlighted. Connections that are blocking other queries are also highlighted.
- 🔒: the lock icon with the red highlight indicates that the query is blocking other queries, and the number indicates how many queries it’s blocking
- 🕓: the clock icon with the yellow highlight indicates that the query is waiting for other queries, and the number indicates how many queries it’s waiting for
When a trivial query is taking a long time, it’s often waiting for something.
With the Lock Monitoring feature, you can see which queries the query is
waiting for.
It is common that the waiting situation is “chained”. For example, a query A is
waiting for a query B, and a query B is waiting for a query C. The Lock
Monitoring feature supports situations like this, and highlights query C as the
ultimate (“root cause”) blocking query with the lock icon with the red
highlight.
In this case, you can run pg_cancel_backend or pg_terminate_backend to
cancel query C or terminate its database connection to unblock queries B and A.
This information is available for historical data too. Let’s say the database was slow and requests were timing out 3 hours ago. You can check out the History chart of the Connection States tab to see if there were any queries in a “Waiting for Lock” state during that time. If so, you can click the chart to see the snapshot Connection Traces data at that time. The Lock Monitoring information will show you which queries were running, and which were blocking or blocked, at that time.
Wait Events tab
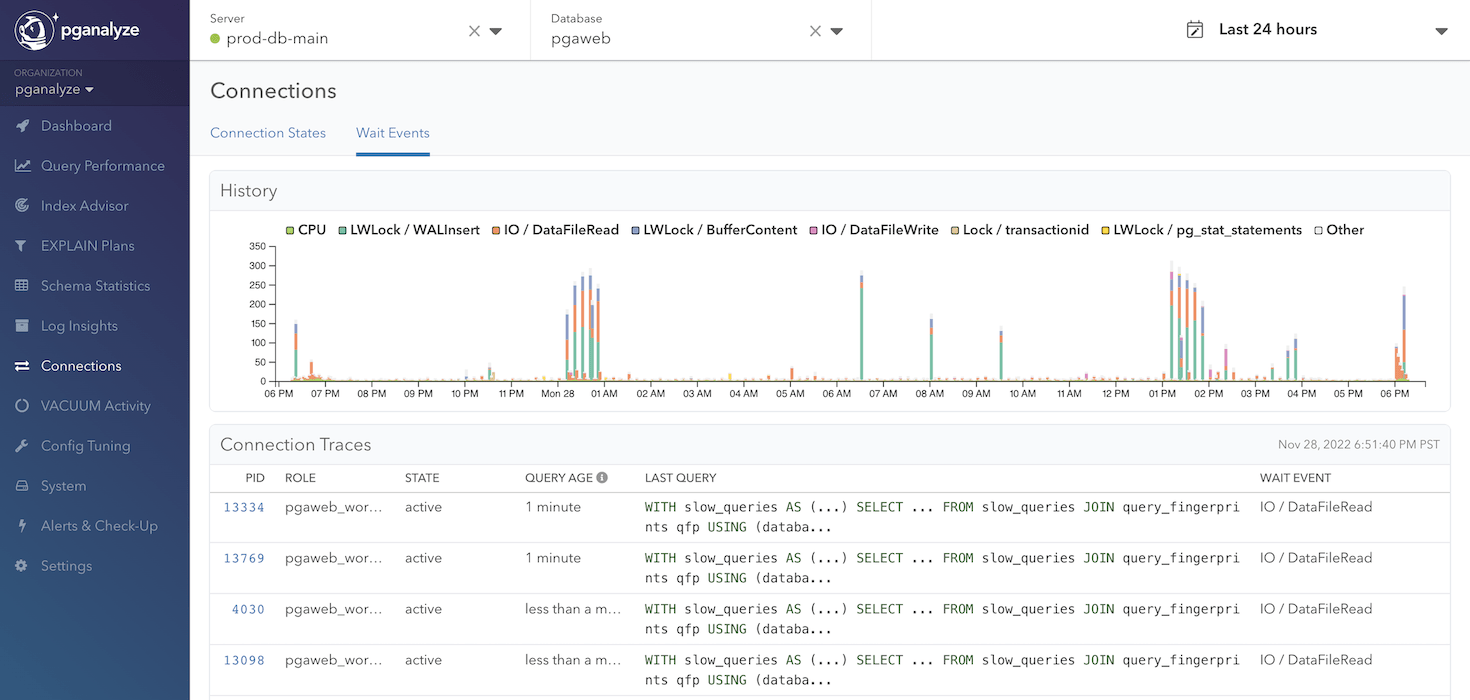
Wait Events history gives you a historical overview of connections with wait
events. For example, wait event IO / DataFileRead indicates that a process is
currently waiting for data to be read from disk or the page cache.
The chart is using the data collected every 10 seconds, but the data is aggregated and plotted in 150-second buckets.
See also this blog post to learn more about wait events.
The Wait Events tab is only available on the Scale Plan and higher.
Checks and Alerts
Connections checks and alerts are enabled by default for all your databases.
The Connections category includes the following checks:
Each check has a different purpose and it is recommended to adjust the check
configuration depending on your requirements. For example, the Active Queries
check will trigger and create a warning issue when the query is in an active
state and running more than 30 minutes by default. If your system is known to
have long running queries such as nightly batch jobs, you can either extend the
threshold or add the /* pganalyze:no-alert */ or /* pganalyze=no-alert */
magic comment to these queries to avoid creating an issue.
The Blocking Queries alert is convenient to be notified when there is a query
blocking other queries. Such situation could easily cause a system wide
performance degradation, so you want to be notified much earlier than for
Active Query or Idle Transaction issues.
You can read more details about the Alerts & Check-Up system in its own section of the documentation.
Couldn't find what you were looking for or want to talk about something specific?
Start a conversation with us →