
Query Performance
The Query Performance page in pganalyze contains information about query
statistics, using the data from the pg_stat_statements view.
The query statistic data is collected every minute and is sent to pganalyze every 10 minutes.
Database Queries
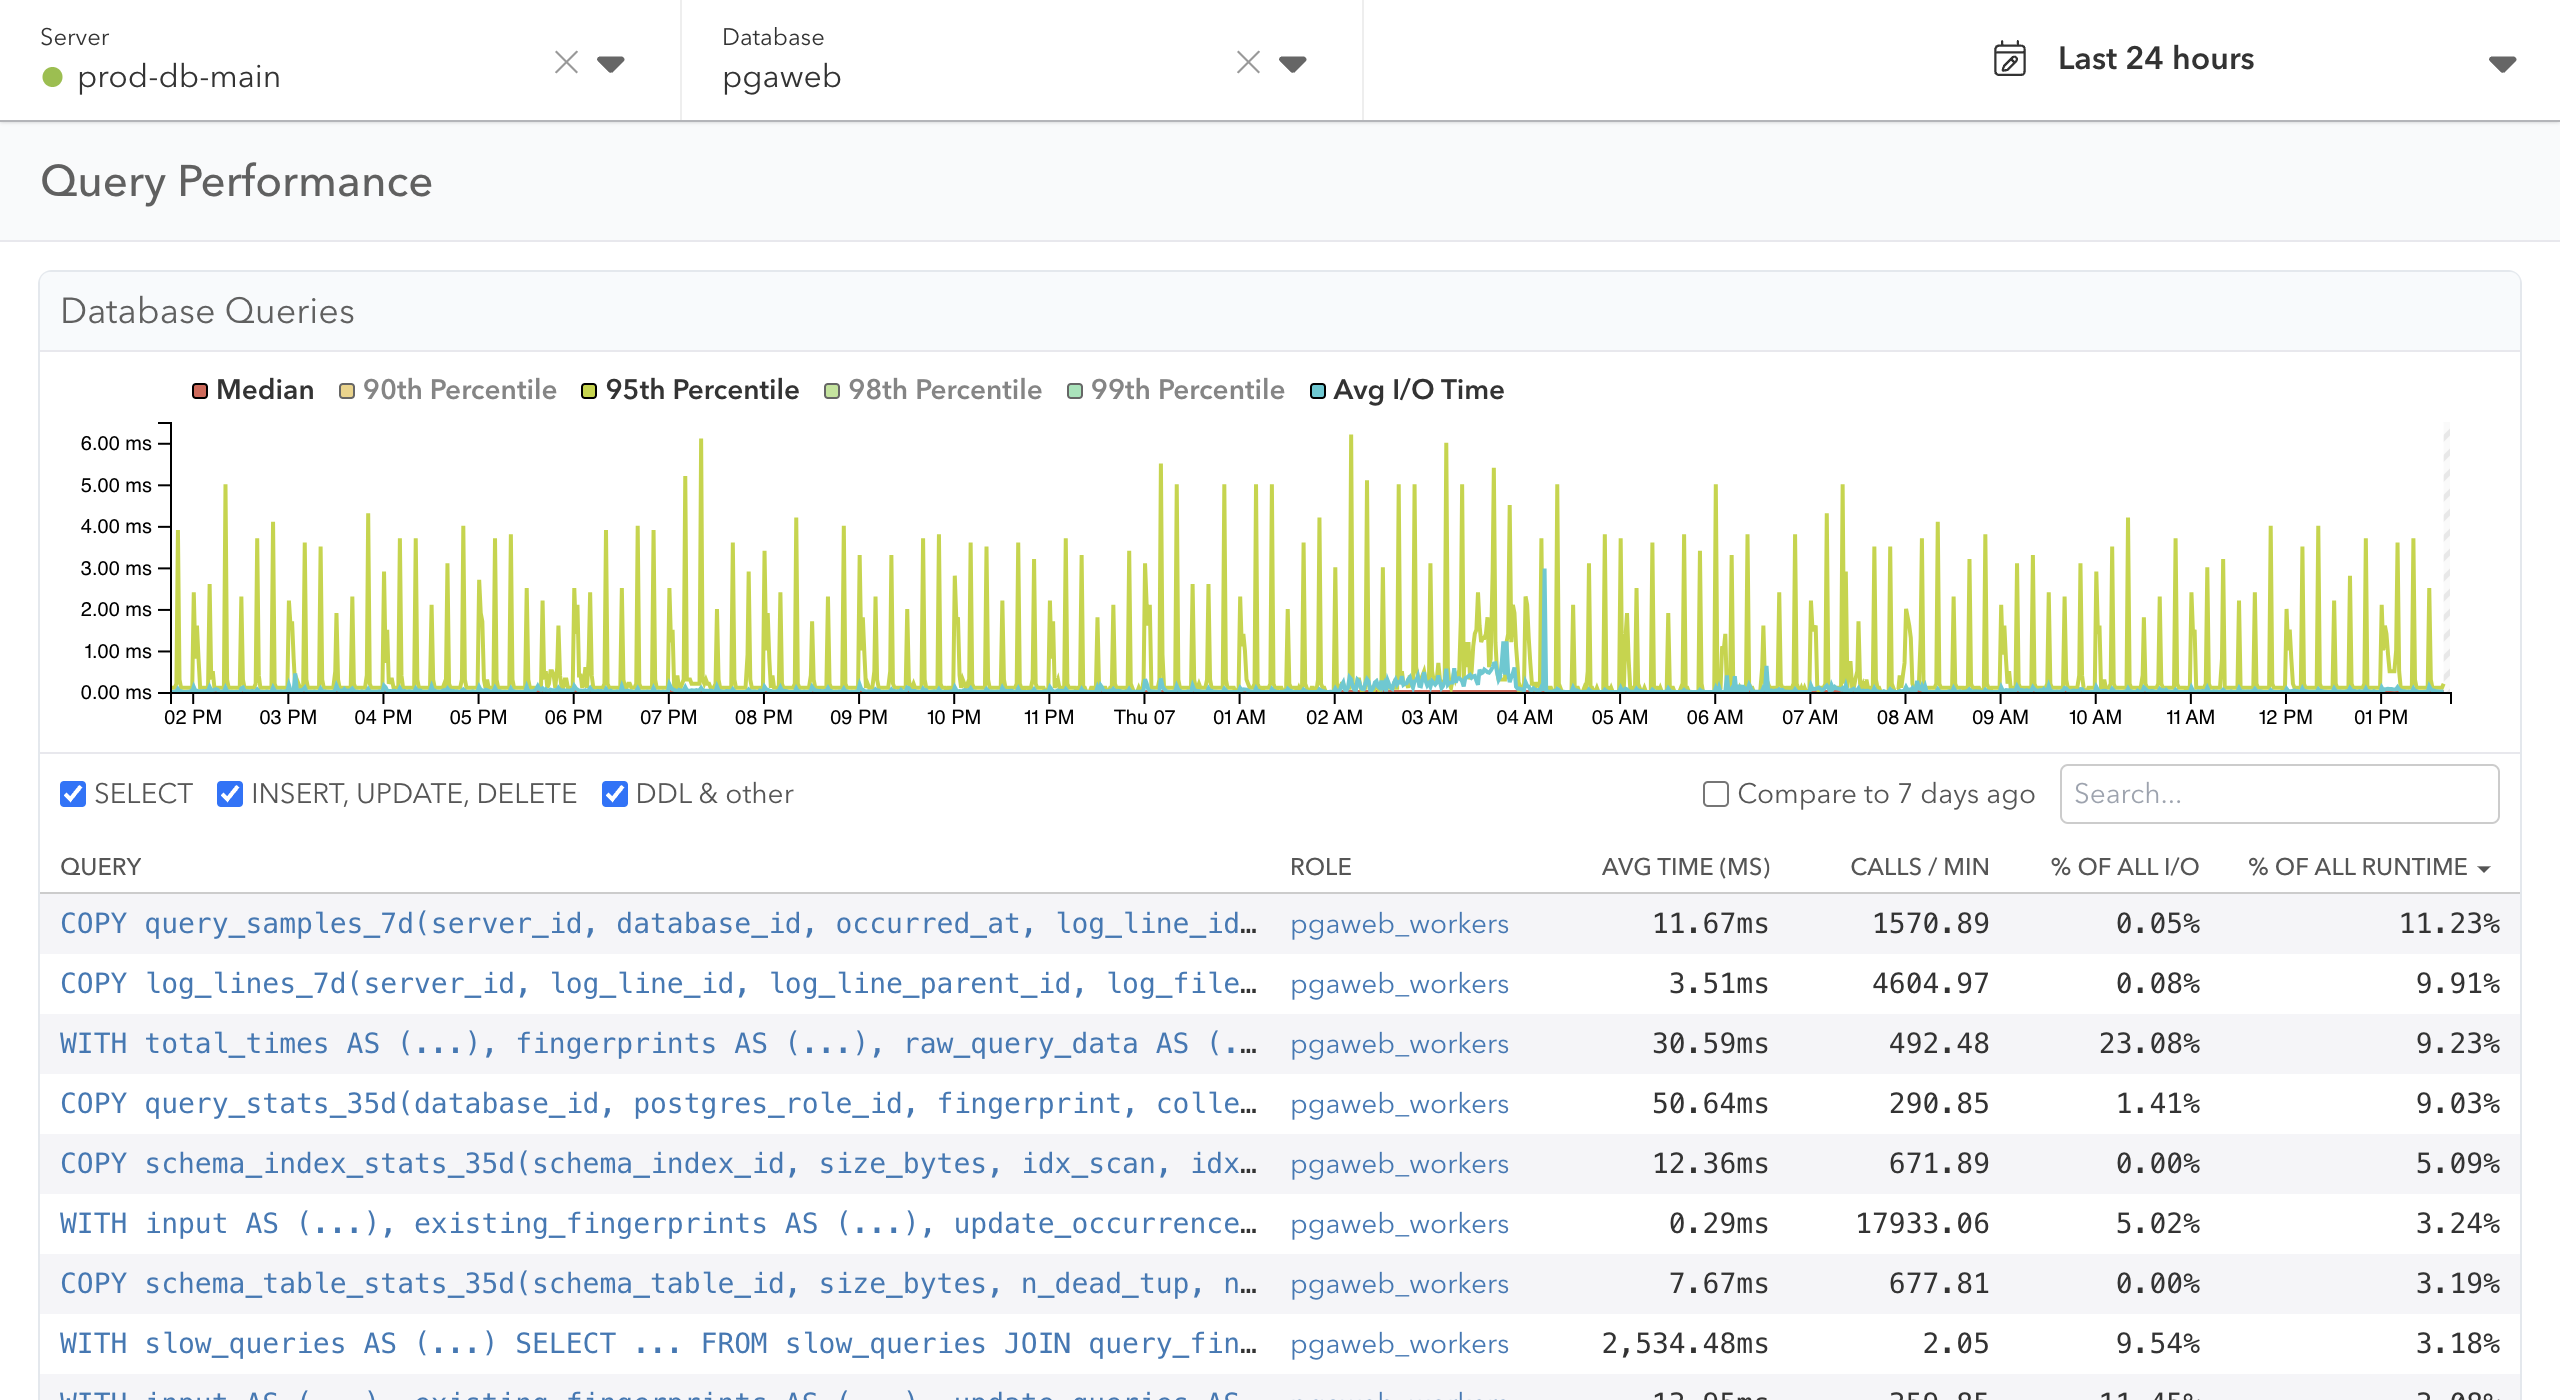
Once you specify a database, you can see statistics for queries in that database. The chart displays the overall query latency.
In the table below the chart, you can find a list of all queries in the database (subject to pg_stat_statements.max). The list is sorted by the percentage of all runtime by default. You can search this list by part of the query text, or the name of the Postgres roles executing the query.
Cluster-wide query performance
For servers grouped into a cluster server group, the same view is available across the whole cluster. The default page summarizes query activity per database group (databases sharing a name across cluster members). Pick a database group from the table or Database picker to see top queries for that group, aggregated across every cluster member that hosts that database. The drill-down offers the same latency graph, statement-type filters, and time filter as the per-server view, and the query list adds a column showing which server each query came from.
How percentiles are calculated
Our percentile calculations use weighted averages of execution times, derived from total times and call frequencies, rather than direct raw execution times. This streamlined approach, however, might not highlight outliers as effectively.
For example, with query statistics over 10 minutes:
- query1: total time 8,000ms for 10 calls, averaging 800ms
- query2: total time 8,000ms for 20 calls, averaging 400ms
- query3: total time 9,000ms for 30 calls, averaging 300ms
- query4: total time 8,000ms for 40 calls, averaging 200ms
This process generates a dataset like [200ms (40 times), 300ms (30 times), 400ms (20 times), 800ms (10 times)].
The median is 300ms, but this method might not fully represent outliers. For
instance, if query1 had two exceptionally slow runs (2,000ms each), the true
99th percentile might be 2,000ms, not 800ms as our averaged data would suggest.
Query details
Overview
The SQL Statement you can see here is a normalized query and all values are
replaced by placeholders, such as $1.
Query can be truncated
When the query exceeds the current size limit set by track_activity_query_size,
it will be shown as <truncated query>. If you encounter this frequently,
consider increasing this limit. Be aware that increasing the limit may result in
Postgres consuming more memory.
Index Advisor
You can see the list of scans executed by this query here. A scan is how a query reads data from a table (either through an index or as a sequential scan). For each scan, the Index Advisor will show if there are any recommended changes.
Query Samples
Shows the list of query samples collected in the last 24 hours, regardless of
the selected time range, up to 5 samples. This is only available when Log
Insights is integrated and the query execution time exceeds either
log_min_duration_statement or auto_explain.log_min_duration.
EXPLAIN Plans
Shows the list of EXPLAIN plans samples collected in the selected time range.
This is only available when Automated EXPLAIN is
integrated and the query execution time exceeds auto_explain.log_min_duration.
With Amazon Aurora versions 14.10, 15.5, and higher, this page also displays
query plan statistics, including a list of query plans with their statistics,
and graphs showing the average runtime and calls per minute over time for each
plan.
Query Tags
Shows the list of query tags collected in the last 7 days, regardless of the selected time range. See Query Tags section for more detail.
Log Entries
Shows up to 100 log entries, up to the selected time range’s “to” time (or the current time if the selected time range is something like Last 24 hours).
Couldn't find what you were looking for or want to talk about something specific?
Start a conversation with us →