
Query Tags
Query tags are key-value pairs of runtime context for a query. You can add them to SQL statements as a query comment. The runtime context can be a name of the background job that is running the query, the ID of a user the query is associated with, or a trace ID.
Query tags can help determine where a query is coming from, support tracing, or help track down the specific background job corresponding to a slow query.
There are several tools to help you add query tags to your query. For instance,
you can use the sqlcommenter to
augment SQL statements before execution, with comments containing information
about the code that caused its execution. Rails 7+ has a built-in feature called
Query Logs
that allows you to add tags like controller and action to the query so that
you can identify which controller and action the query was called from.
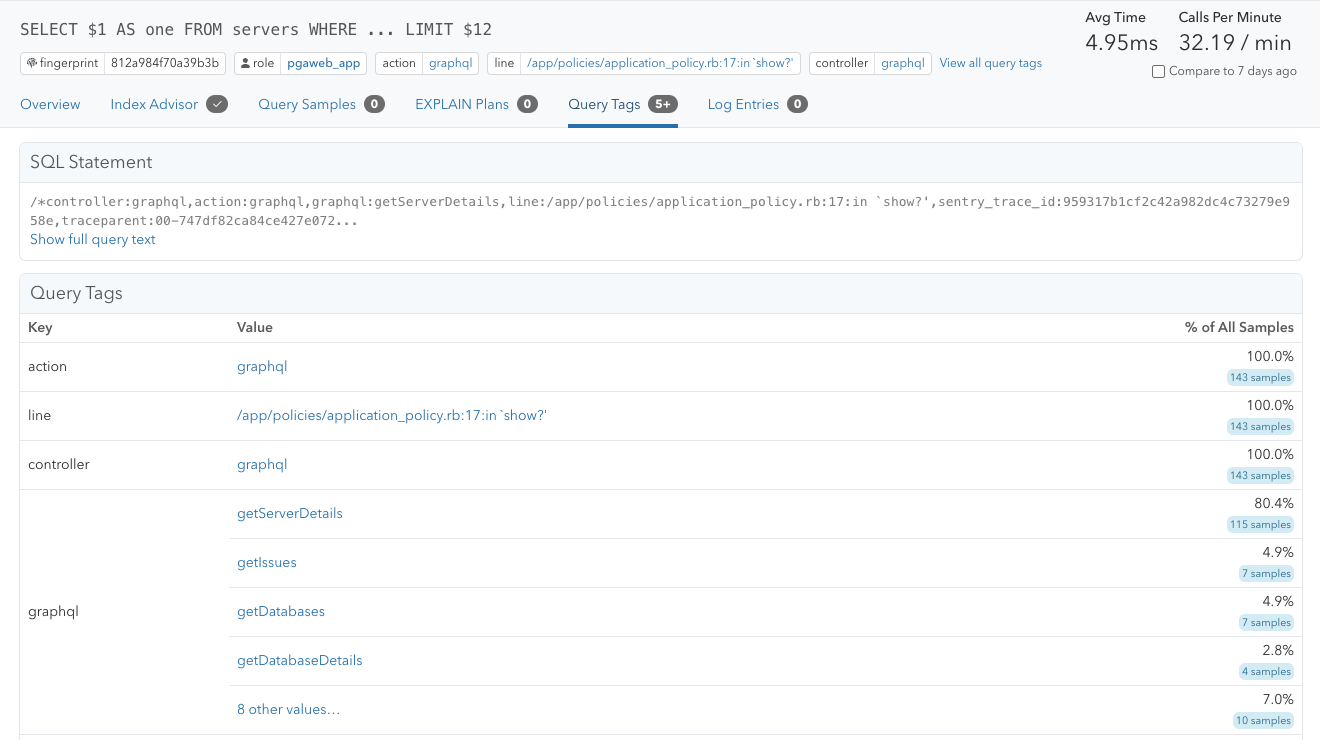
In pganalyze, you can see a query’s tags in the “Query Tags” tab in the individual query details page.
Query tags are also used in the OpenTelemetry integration to specify the traceparent and tracestate. You can learn more in the traceparent section of the OpenTelemetry integration docs.
Supported formats
Currently, the pganalyze collector supports the following Query Tags formats:
- sqlcommenter format:
key='value'SELECT 1 /* key1='value1',key2='value2' */
- sqlcommenter format without single quotes:
key=valueSELECT 1 /* key1=value1, key2=value2 */
- marginalia format:
key:valueSELECT 1 /* key1:value1, key2:value2 */
The query comments can be appended either before or after the query.
Query Tags tab
In the query detail page, you can find query tags in the header of the page, as well as in the “Query Tags” tab.
Query tags are parsed from queries from the following sources:
- Query samples
- When Log Insights is integrated, queries with execution time exceeding
either of the following settings will appear in the logs and their query
tags will be parsed
log_min_duration_statementauto_explain.log_min_duration, if usingauto_explain
- When Log Insights is integrated, queries with execution time exceeding
either of the following settings will appear in the logs and their query
tags will be parsed
- Queries appearing in the Connections page
- The pganalyze collector collects the currently running queries using
pg_stat_activity, every 10 seconds - These queries will be shown in the Connections page and their query tags will be parsed
- The pganalyze collector collects the currently running queries using
Even if all queries contain query tags, it is possible that it’s not shown in the query detail page if there are no query samples for that query, or that query is not running frequently enough or long enough to appear in the Connections page.
All queries matching the above condition are counted as “samples”, and you can see their details, including the frequency of different values for each tag key, in the Query Tags tab.
Couldn't find what you were looking for or want to talk about something specific?
Start a conversation with us →