
Index Advisor: Getting Started
The pganalyze Index Advisor is a tool to analyze your queries, determine how Postgres will fetch data from the referenced tables, and suggest indexes to make those scans more efficient. The Index Advisor uses information pganalyze already collects about your schema and queries in order to provide an analysis for any table and its query workload.
The Index Advisor considers the whole database when it creates insights. We do not recommend adding indexes to every query, since that impacts database performance, especially I/O. Extra indexes compete for space in the Postgres buffer cache, affecting reads, and must be updated for inserts and updates to the table, affecting writes.
Whether your tables are leaning towards read-heavy or write-heavy workload patterns, the Index Advisor can fine-tune its recommendations to suit different constraints. It automatically detects the nature of your workloads and adjusts recommendations accordingly, ensuring the best compromise between performance and resource utilization.
The Index Advisor is powered by the pganalyze Indexing Engine, and you can read about its internals if you want to understand all the details. It’s especially important to be aware of the limitations of the Indexing Engine in order to use the Index Advisor effectively.
What you get with Index Advisor
- Save time manually tracking down slow queries, and focus on insights highlighting suboptimal execution plans that will become more of a problem as your database grows
- Review insights distilled from hundreds of different potential index combinations modeled by the Indexing Engine
- Check statistics for affected queries and use the included “CREATE INDEX” command to easily reason about and test the index insights
- Optimize for the smallest amount of total I/O required to execute the queries in your database
- Keep Index Write Overhead low by maintaining a small number of good-enough indexes for each table, with as few columns as possible
If you have not yet done so, you will need to set up monitoring for your database server. After you start seeing stats from your database in the pganalyze UI, it can take up to 48h for insights to show up due to the extra processing required. Once this is set up, you can navigate to the Index Advisor page in the left-hand menu to view missing index insights. Additionally, Index Advisor will show unused indexes after sufficient time has passed without any activity (default 35 days).
Optionally, you can set up alerts and get automated notifications when we find new indexing insights. When you add the proposed indexes, Index Advisor will detect that and resolve the insight automatically.
Set up the column stats helper for better recommendations
Column statistics are used by pganalyze to improve Index Advisor recommendations. For best results, make sure you are running collector 0.41.2 or later, and set up the get_column_stats helper function.
You can check which collector version you are running on the Settings page for
your server, and can check if the column stats helpers are installed by looking
for warnings in the collector test output (pganalyze-collector --test --verbose).
Set up the extended stats helper for better recommendations
Extended statistics are used by pganalyze to improve Index Advisor recommendations. If you are using the extended statistics, for best results, make sure you are running collector 0.53.0 or later, and set up the get_relation_stats_ext helper function.
You can check which collector version you are running on the Settings page for your server.
How to navigate the insights overview
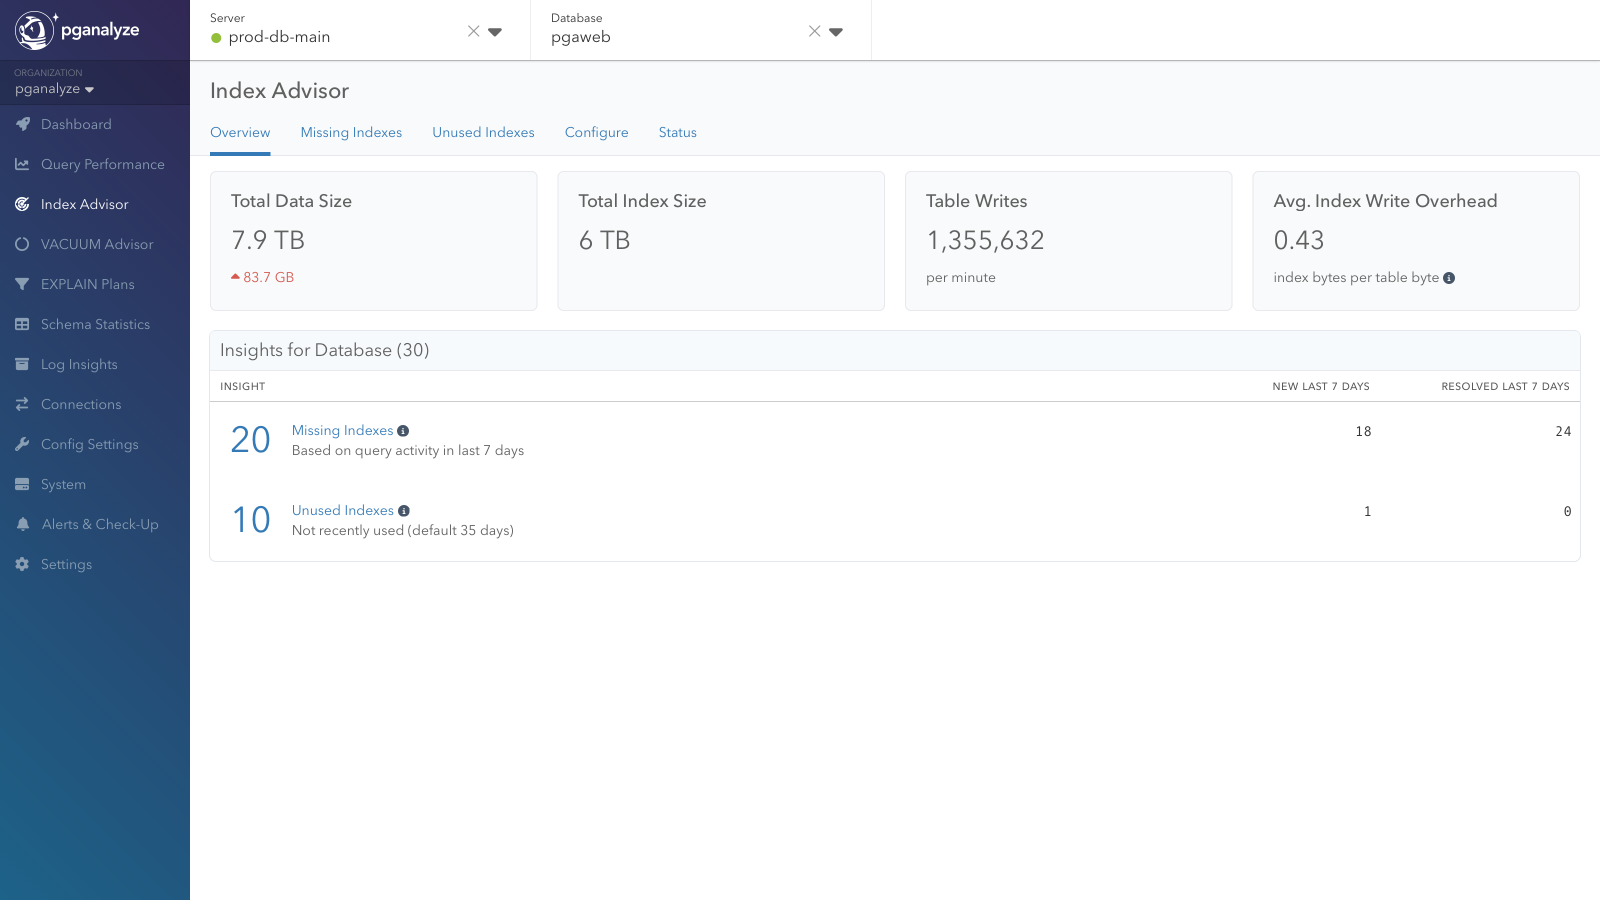
At the top of the overview page you find relevant metrics that frame the insight findings for you. You can reference the same metrics when you look into the missing and unused index insights below.
- Total Data Size
- The total data size across all tables in your database.
- Total Index Size
- The total index size across all indexes in your database.
- Total Table Writes
The number of tables writes (inserts and updates) per second in your database.
- Avg. Index Write Overhead
The average index write overhead across all indexes in your database.
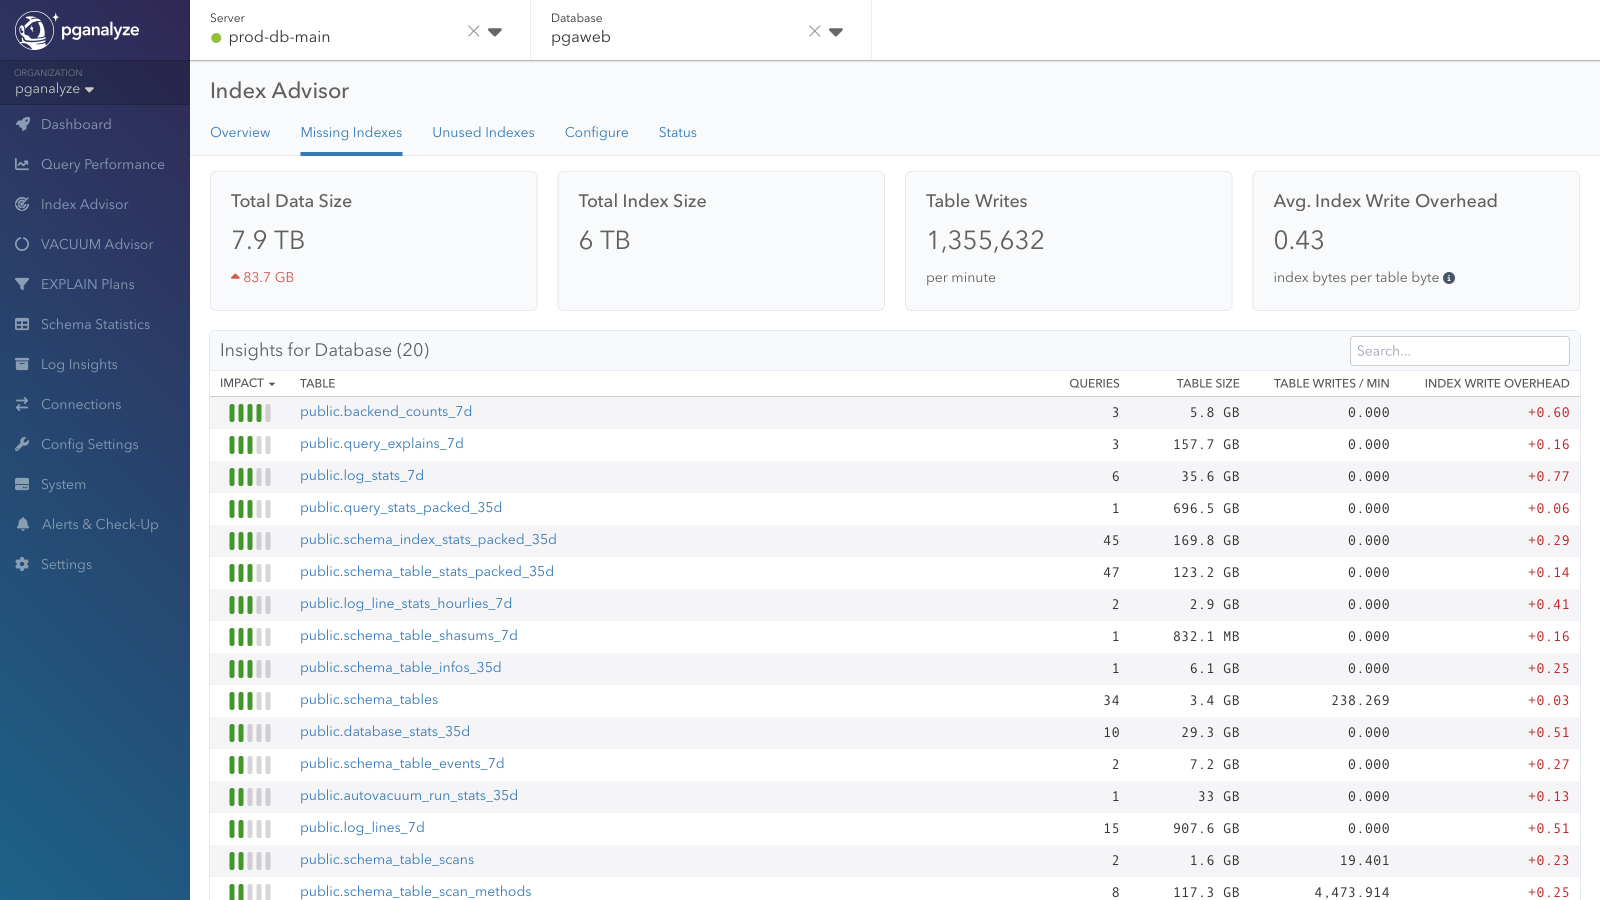
View all insights for your databases
Insights are listed below and split into two types: Missing indexes and unused indexes. By default insights are sorted by impact which highlights the most important items to address.
For servers in a cluster, insights are shown on the primary server and include data from all cluster members. When viewing insights from a replica server, you’ll see a link to view insights on the primary.
These cluster-wide insights require access to the whole cluster, either through unrestricted View or View scoped to the server group. Viewers restricted to individual cluster members see per-server data instead.
Missing indexes
Detects tables that have potential to be improved by adding indexes. Queries fetch data from tables through different types of scans, and some scans can be executed more efficiently if appropriate indexes are present. The Index Advisor attempts to infer what indexes would be helpful for your query workload. See more details in the Indexing Engine documentation.
The impact of a missing index insight is measured by weighted cost improvement, which represents the estimated cost reduction for all scans that are expected to use the index, weighted by the frequency (calls / minute) of the scan. For clusters, this includes scan frequency across all server instances in a cluster.
Unused indexes
Every index causes additional write overhead when its table is written to, and sometimes indexes are created but never used, or cease to be used. This can happen either because a better index is available, the current index cannot be used even though it looked applicable, or the query workload changed.
The unused index check detects indexes that haven’t been used recently (last 35 days by default), as determined by Postgres statistics, and notes these indexes as potentially being candidates for removal. For clusters, an index is only considered unused if it hasn’t been used on any server in the cluster.
The impact of an unused index insight is measured by reduced Index Write Overhead.
In addition to these checks that are performed as part of the Index Advisor, pganalyze can also help you alert on invalid indexes.
From the overview page you can click through to issue pages that explain in detail why the Index Advisor created a table insight.
View insights on query detail pages
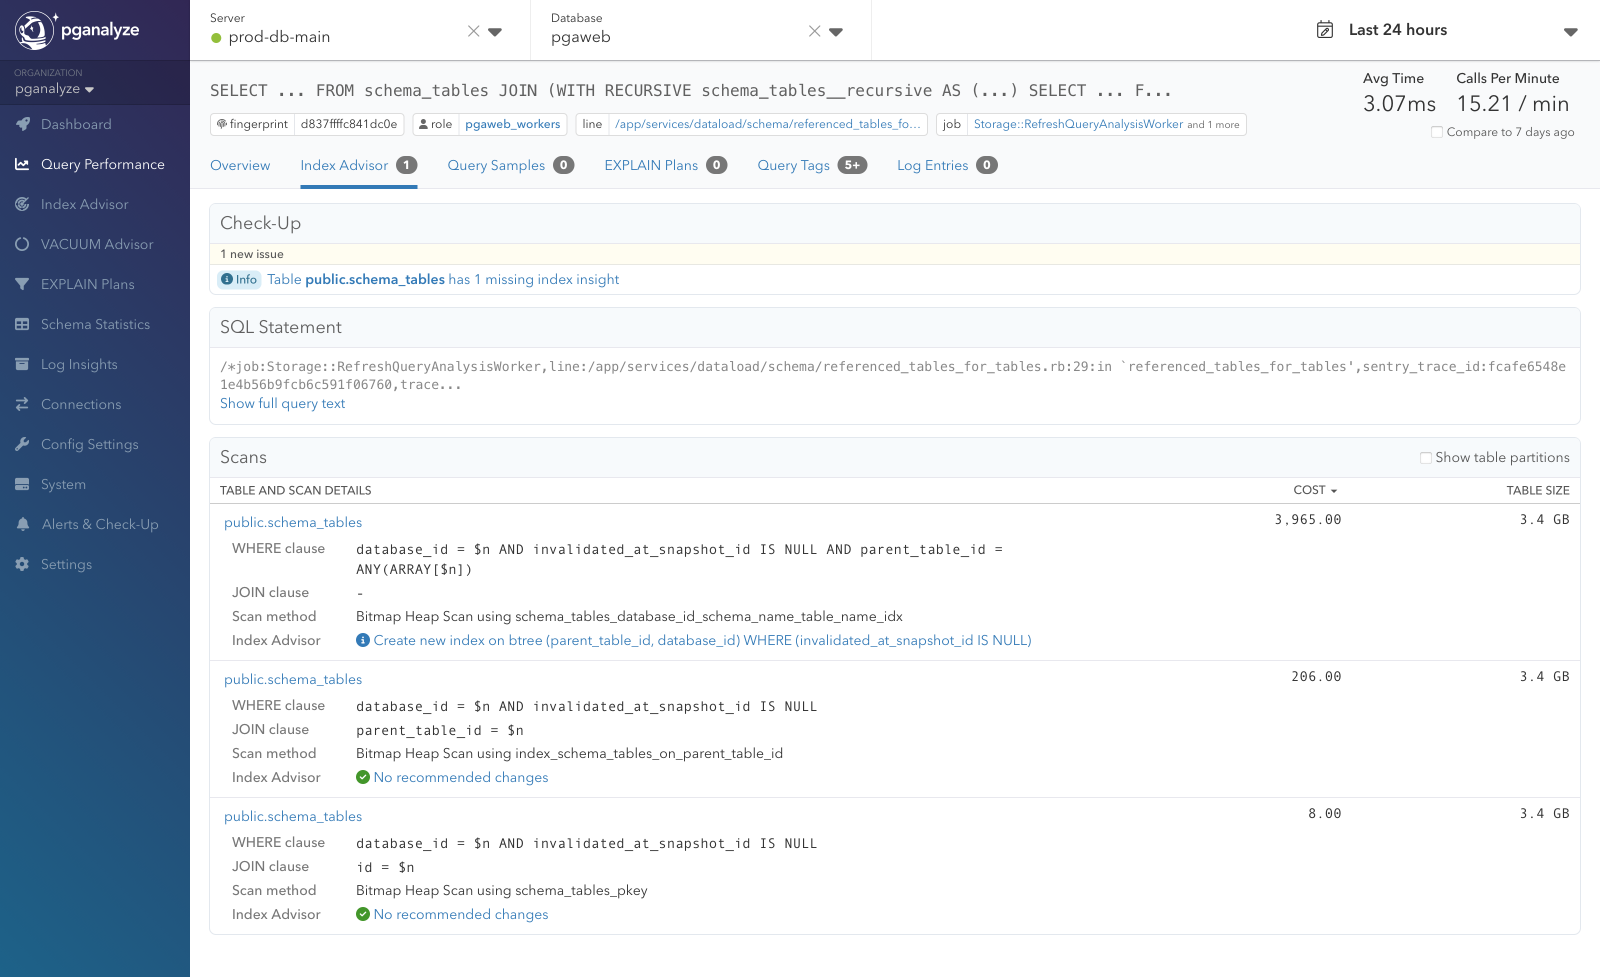
Index Advisor is also available from query detail pages, showing a breakdown of the query into the individual scans that are then analyzed by Index Advisor. For each scanned table you can see the WHERE and JOIN conditions, the current scan method that is expected to be used, and Index Advisor insights, with a link to the full details in the per-table Index Advisor view. For clusters, affected queries may link to databases hosted by any server in the cluster.
Couldn't find what you were looking for or want to talk about something specific?
Start a conversation with us →