


Postgres Connection Tracing, Wait Event Analysis & Vacuum Monitoring go into GA on pganalyze
 By Lukas Fittl
We’re excited to announce the general availability of three new pganalyze features: Connection Tracing, Wait Event Analysis, as well as Vacuum Monitoring.
These features have been developed based on the feedback of hundreds of customers monitoring their production Postgres databases using pganalyze. Thanks so much for consistently taking the time to provide us with valuable information on how you’d like to see pganalyze evolve!
Postgres Connection Tracing & Wait Event Analysis
One of the most essential operational metrics in Postgres is which processes are currently running, so we can better understand what CPU and I/O time is spent on. Getting insights into your Postgres database is one of the biggest levers to improve its performance.
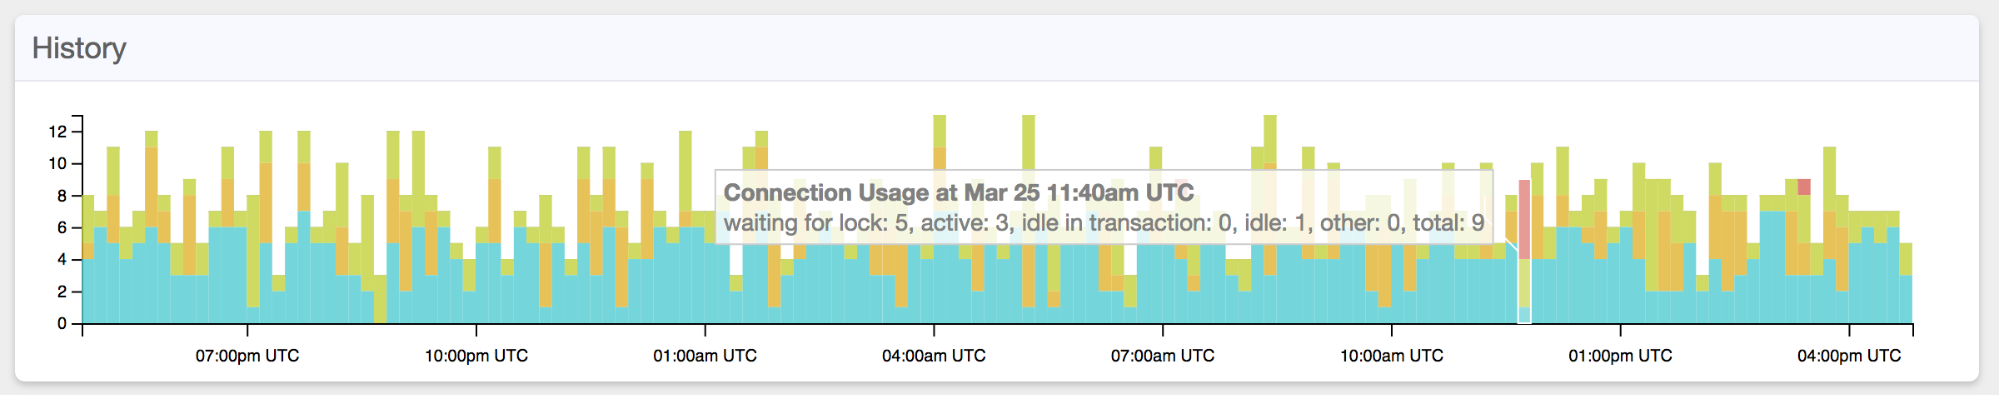
Before Postgres 9.6 the best metric to analyse this was the number and type of connections in pg_stat_activity, based on the “state” column, which indicates a high-level state like “active” or “idle”. We can now see this information in pganalyze:
With Postgres 9.6 and newer, we got the chance to become more sophisticated, through the introduction of wait events. Wait Events tell you the details on what a Postgres connection is currently waiting on, in particular if it’s not actually processing something in the CPU. One example of a wait event may be IO / DataFileRead, which indicates that a process is currently waiting for data to be read from disk or the page cache.
In pganalyze you can see the wait events over time, making it easy to find and debug outliers:
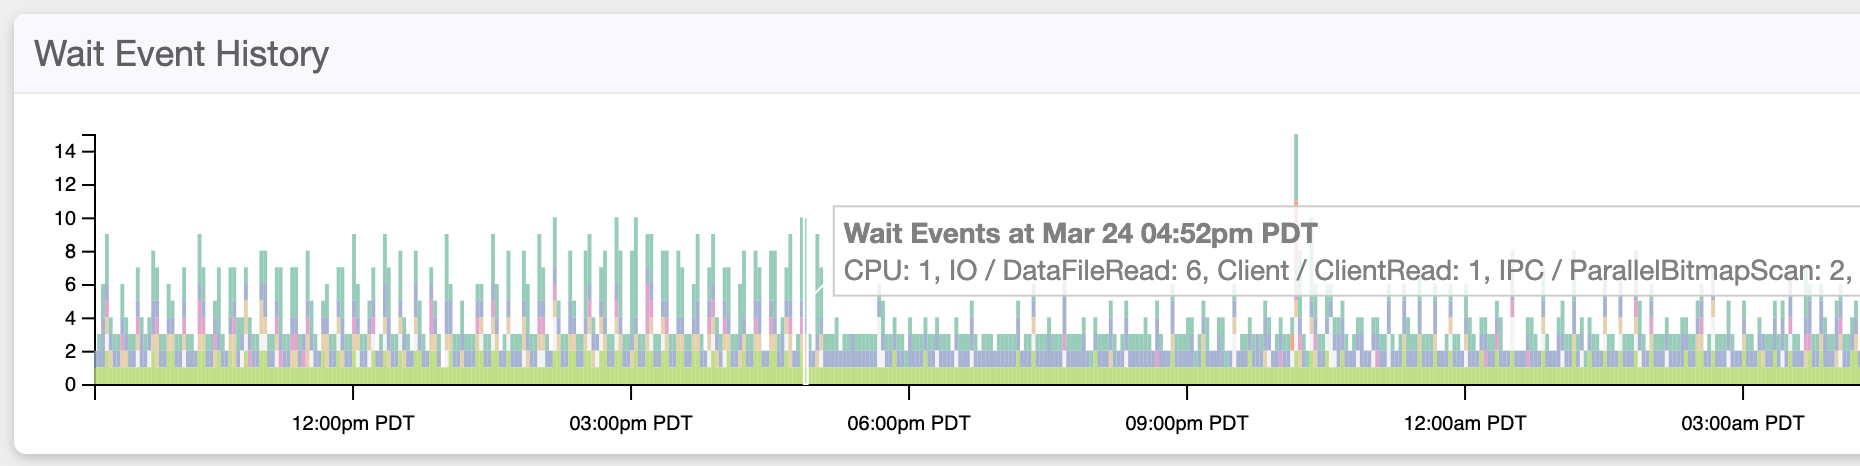
Wait Event spikes can often correlate with higher CPU or I/O usage, and are particularly useful for getting to the root cause of production incidents.
For the case of a specific spike on either the connections or the wait events graph, you can zoom into the specific snapshot of what occurred at the time, by clicking on the graph.
This can also be used in complicated situations involving multiple connections, for example locking issues:

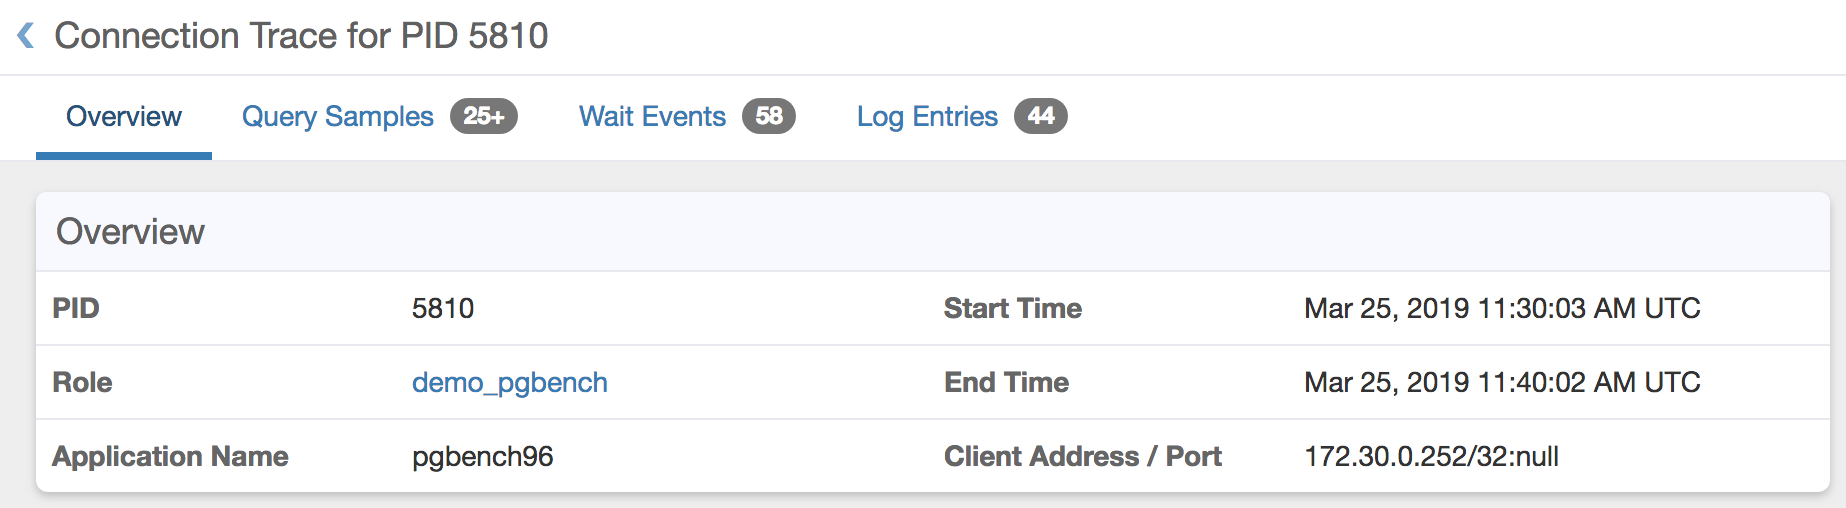
For each of these connections we also provide a detailed connection trace, that records all queries that have run longer than the sampling interval (every 10 seconds), as well as wait events and log entries for that particular connection.
Customizable Postgres Connection Alerts
The story we’ve heard over and over again from customers: One or many queries end up getting stuck due to a locking issue, or finish very slowly due to a query plan change, and cause the database to become unavailable. The solution typically is to stop the problematic queries, often only after end users have noticed the slowdown.
We’ve introduced two new alerts with this release, that help you stay safe from accidental long-running queries and connections:
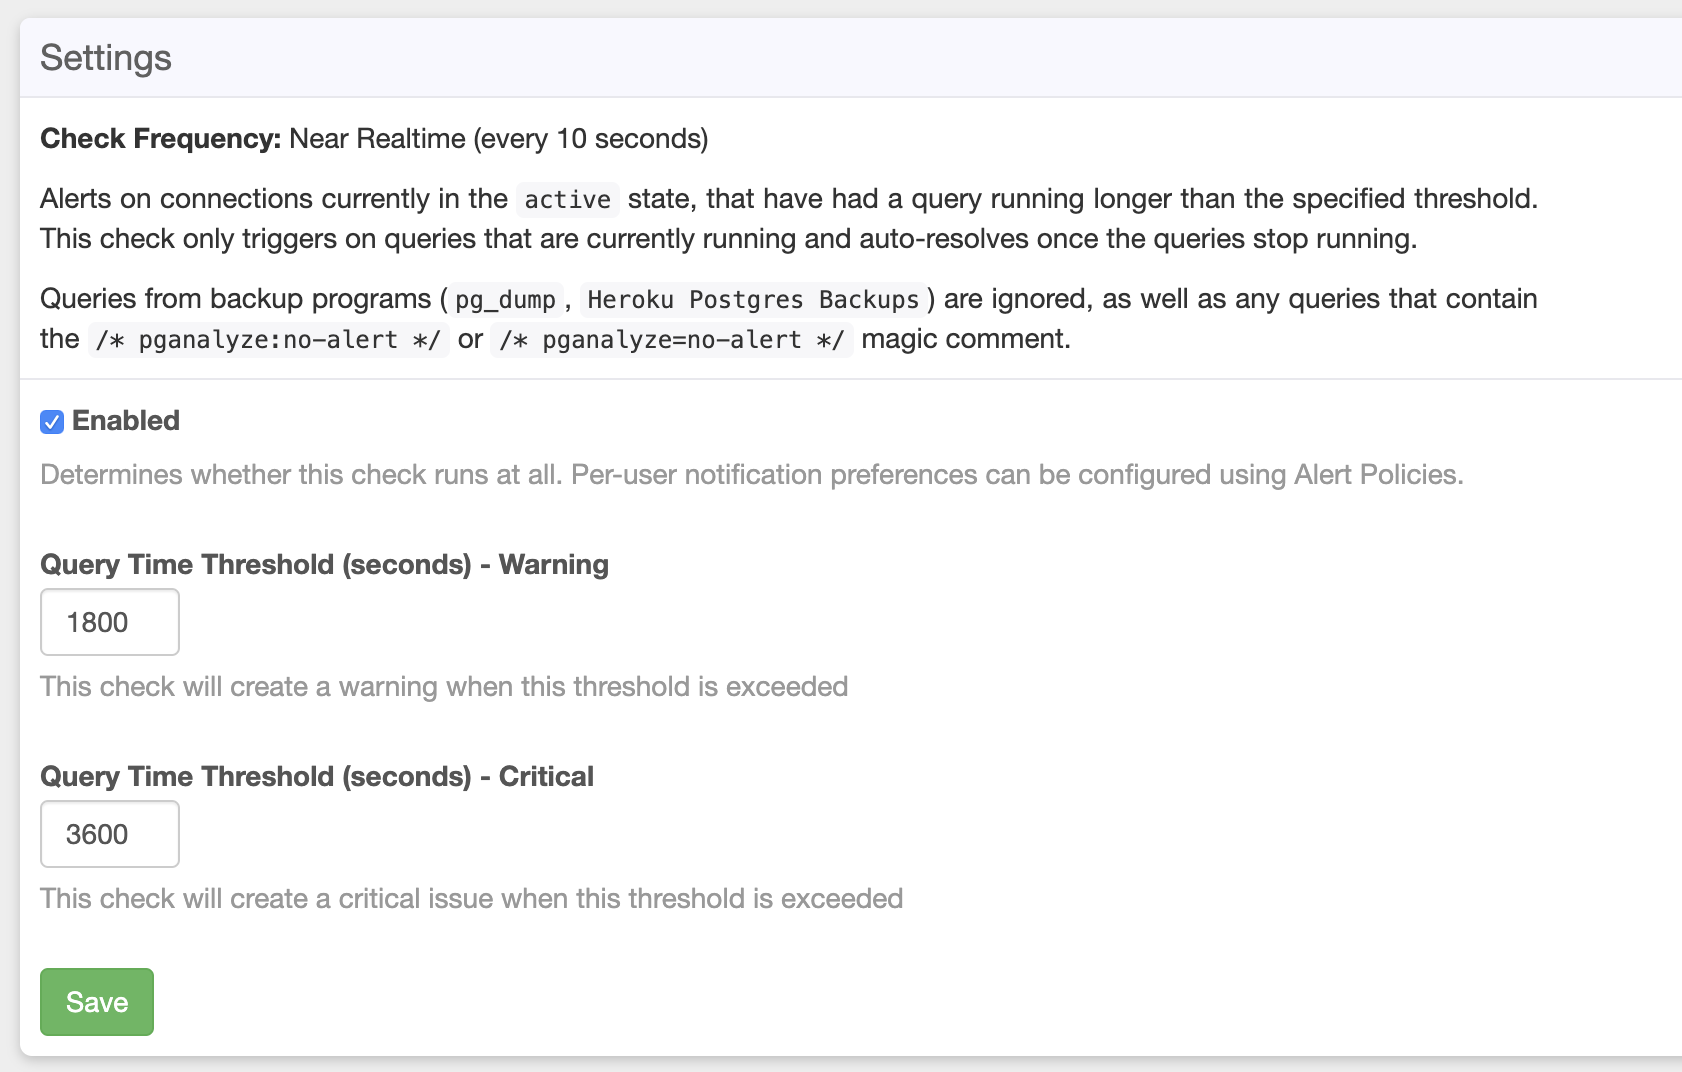
- Active Query Alert: Triggers on any query that is currently running and has exceeded the specified threshold (default 1h)
- Idle In Transaction Alert: Triggers on any transcation that has not been committed but is in the idle state (possibly causing issues such as making autovacuum not run correctly)
For each of these you can customize the settings on the Alerts & Check-up page:
Postgres Vacuum Monitoring
We previously talked about Postgres Vacuum on our blog and are now making Vacuum Monitoring generally available on our Scale plan (you can have a look at our pganalyze pricing and feature matrix that explains which features are available on which pganalyze plan).
Since the initial early-access release of Vacuum Monitoring, we’ve added a couple of important improvements to this feature:
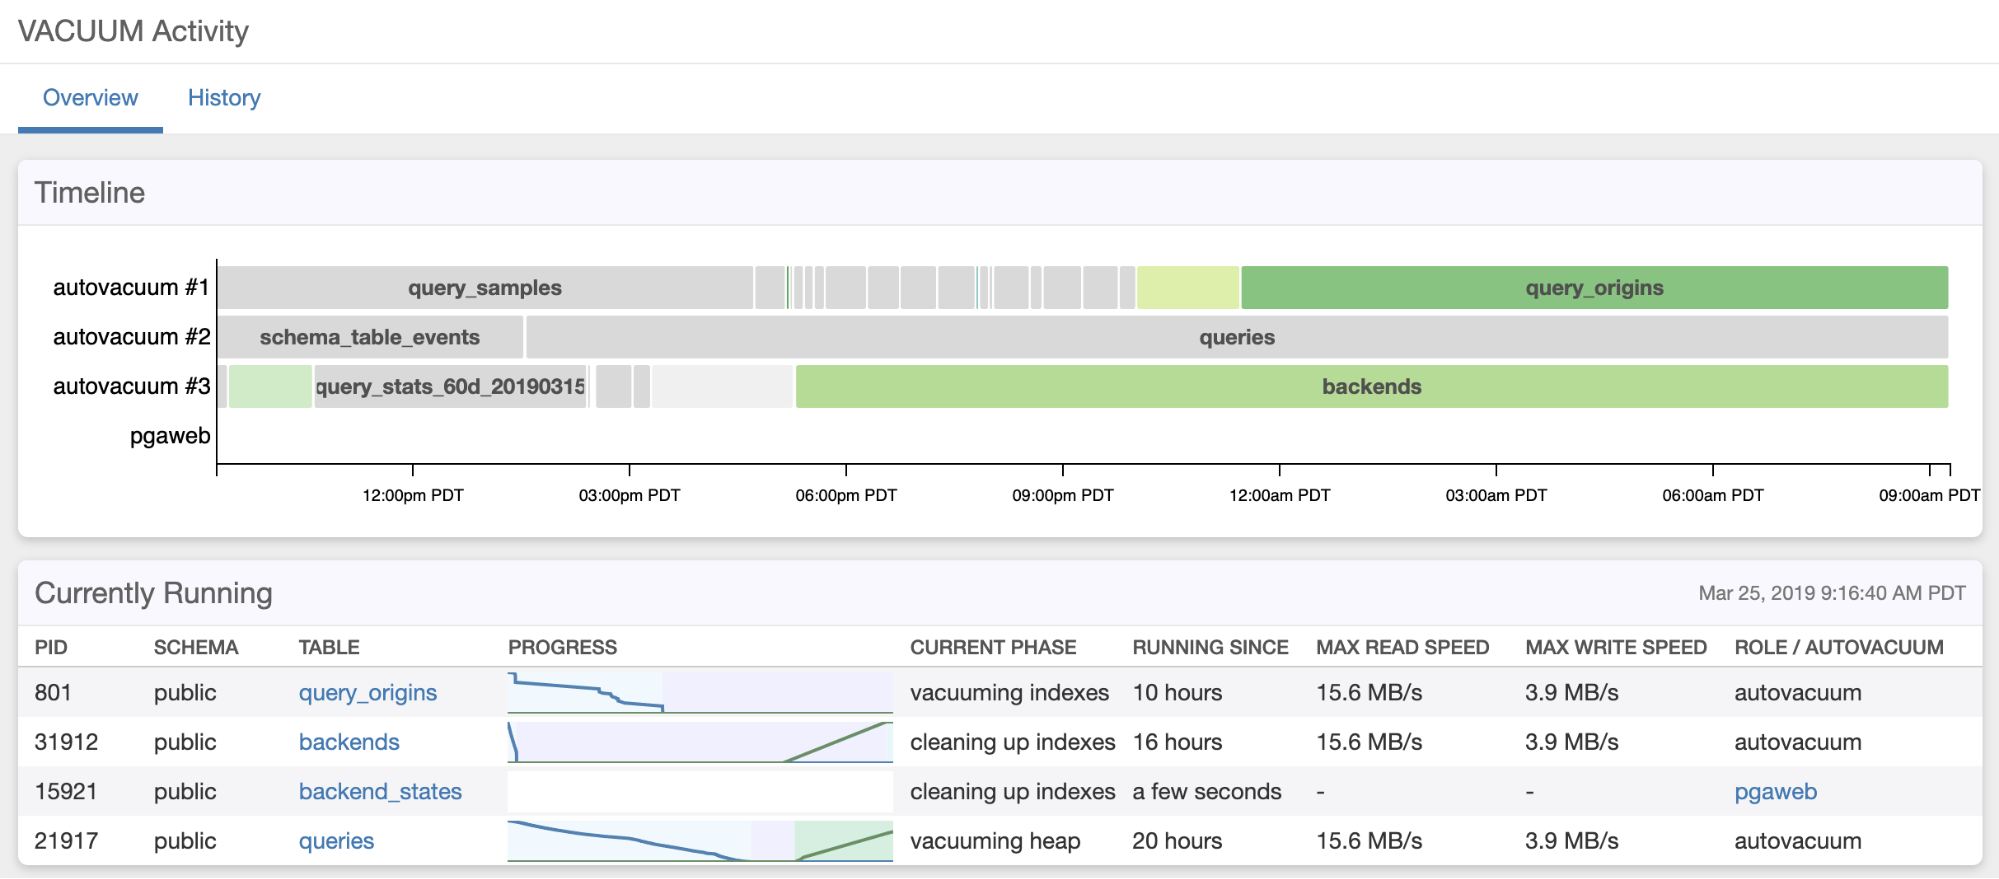
- Easy top-level view for the currently running vacuums, and which phase they are in
- Tracking of per-table autovacuum customizations
- Performance improvements for systems with many active vacuum processes
Thanks to our customers for the active participation during the early-access phase, we’re really appreciative of your consistent help and support and are looking forward to continued collaboration on this feature.
Conclusion
We are proud to have shipped these updates to pganalyze. They are available as of today for cloud customers on the Scale or Enterprise plans. Of course, they are also available when starting a new, free, 14-day trial.
For pganalyze Enterprise customers using the on-premise version, this functionality is included with the 2019.04 release.
We hope you enjoy the new features and encourage everyone to sign up for a free trial. We’re also happy to walk you through a personal demo of pganalyze if you’d like so!
We look forward to your feedback & thank you for using pganalyze!