Visualizing & Tuning Postgres Autovacuum
In this post we'll take a deep dive into one of the mysteries of PostgreSQL: VACUUM and autovacuum.
The Postgres autovacuum logic can be tricky to understand and tune - it has many moving parts, and is hard to understand, in particular for application developers who don't spend all day looking at database documentation.
But luckily there are recent improvements in Postgres, in particular the addition of pg_stat_progress_vacuum in Postgres 9.6, that make understanding autovacuum and VACUUM behavior a bit easier.
In this post we describe an approach to autovacuum tuning that is based on sampling these statistics over time, visualizing them, and then making tuning decisions based on data. The visualizations shown are all screenshots of real data, and are available for early access in pganalyze.
Why VACUUM?
First of all, why we need VACUUM, 101:
When you perform UPDATE and DELETE operations on a table in Postgres, the database has to keep around the old row data for concurrently running queries and transactions, due to its MVCC model. Once all concurrent transactions that have seen these old rows have finished, they effectively become dead rows which will need to be removed.
VACUUM is the process by which PostgreSQL cleans up these dead rows, and turns the space they have occupied into usable space again, to be used for future writes.
A more detailed description can be found in the PostgreSQL documentation.
Which tables have VACUUM running?
The easiest thing you can check on a running PostgreSQL system is which VACUUM
operations are running right now. In all Postgres versions this information shows up in the pg_stat_activity view,
look for query values that start with "autovacuum: ", or which contain the word "VACUUM":
SELECT pid, query FROM pg_stat_activity WHERE query LIKE 'autovacuum: %';-------+----------------------------------------------------------------------------
10469 | autovacuum: VACUUM ANALYZE public.schema_columns
12848 | autovacuum: VACUUM public.replication_follower_stats (to prevent wraparound)
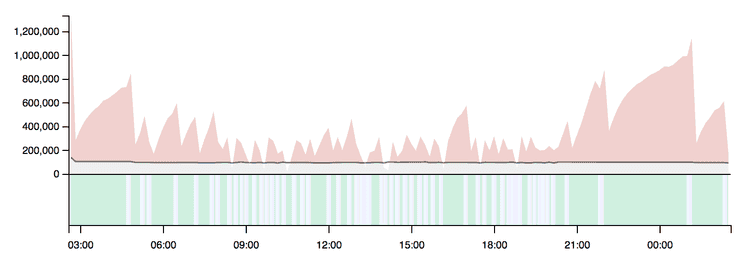
28626 | autovacuum: VACUUM public.schema_index_stats (to prevent wraparound)Based on sampling this data, we can generate a timeline view that helps us distinguish tables that are frequently vacuumed, from tables that have long running vacuums, to tables that don't get vacuumed much at all.
In the screenshot you can see the top 10 tables (by frequency) colored the same way, and in particular the table thats colored light yellow stand out as effectively having VACUUM running continuously.
We can also see that one manual VACUUM was started by the DBA user (colored in cyan), and that it ran much quicker than the same colored version started by autovacuum earlier in the day.
When does autovacuum run?
Another question that frequently comes up is, why did autovacuum decide to start VACUUMing a table?
There are essentially two major reasons:
1) To prevent Transaction ID wraparound
The number of non-frozen transaction IDs has reached "autovacuum_freeze_max_age" (default 200 million transactions), and VACUUM is required to prevent transaction ID wraparound.
We won't go too much into detail on tuning this parameter in this post, but rather reserve this as a follow-on topic.
Note that this can't be disabled, so it will cause autovacuum to start VACUUM, even if it is otherwise disabled. If you keep cancelling autovacuum processes started for this reason you will eventually have to perform a manual VACUUM, as Postgres will shut down the database otherwise.
2) To mark dead rows & enable re-use for new data
As you run UPDATEs and DELETEs, dead rows will accumulate, as described earlier in the post. Once the number of dead rows (or tuples) has exceeded the threshold, autovacuum will start a VACUUM run.
The following formula is used to decide whether vacuuming is needed:
vacuum threshold = vacuum base threshold + vacuum scale factor * number of tuplesBy default the base threshold is 50 rows, and the scale factor is 20%. That means, a table will be vacuumed as soon as the number of dead rows exceeds 20% of all rows in the table, given that at least 50 rows are marked as dead.
In order to understand when this gets triggered, you can look at the n_live_tup and n_dead_tup
values in pg_stat_user_tables:
SELECT * FROM pg_stat_user_tables WHERE relname = 'backend_states';-[ RECORD 1 ]-------+------------------------------
relid | 732156523
schemaname | public
relname | backend_states
...
n_live_tup | 23047184
n_dead_tup | 108373
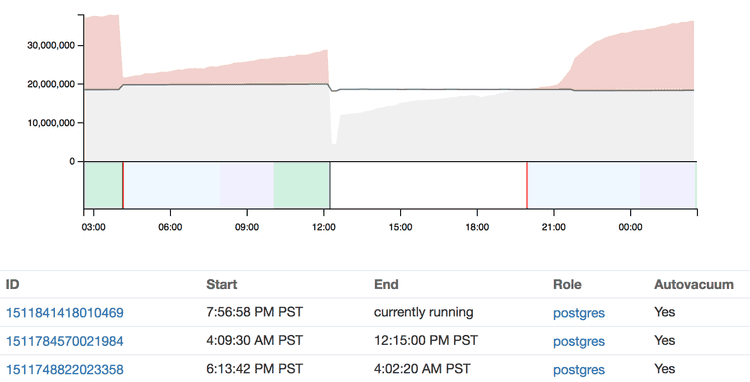
...We can then take this information, together with the autovacuum settings, and visualize it:
Here you can see that as soon as the dead tuples (grey/red area) reach the threshold (grey line), a VACUUM process kicks off (red line in the lower graph).
On a table that can't keep up with VACUUM, which results in bloat due to dead rows, this would instead look like this:
How fast does autovacuum run?
A VACUUM process that was started by autovacuum is artificially throttled in the default PostgreSQL configuration, so it doesn't fully utilize the CPU and I/O available.
That is the correct way to operate for most systems, as you wouldn't want VACUUM to slow down application queries during business hours.
The system that Postgres follows for this is that every VACUUM operation accumulates cost, which you can think of as points that get added up:
- vacuum_cost_page_hit (cost for vacuuming a page found in the buffer cache, default 1)
- vacuum_cost_page_miss (cost for vacuuming a page retrieved from disk, default 10)
- vacuum_cost_page_dirty (cost for writing back a modified page to disk, default 20)
Once the sum of costs has reached autovacuum_cost_limit (default 200 for autovacuum, disabled for manual VACUUM), the VACUUM process will sleep and do nothing for autovacuum_vacuum_cost_delay (default 20 ms).
With the default parameters, that means that autovacuum will at most write 4MB/s to disk, and read 8MB/s from disk or the OS page cache.
How far has this VACUUM made progress?
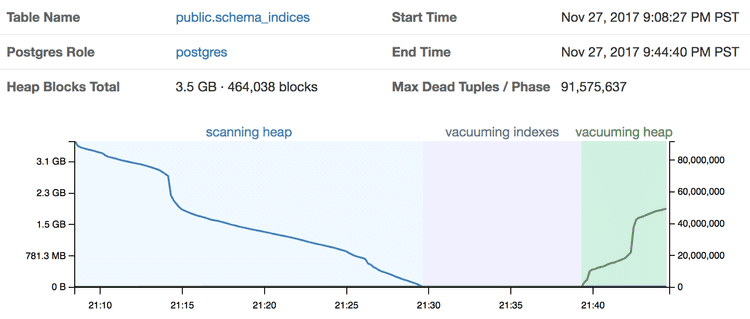
VACUUM runs through three different major phases as part of its operation:
- Scanning Heap
- Vacuuming Indices
- Vacuuming Heap
As well as a few minor phases that are usually really quick.
The "Vacuuming Indices" and "Vacuuming Heap" phase might run multiple times if the
autovacuum_work_mem setting is set to a too low value that not all dead tuples
can be held in memory.
Based on sampling pg_stat_progress_vacuum we can visualize in detail what goes on:
This works even whilst a autovacuum or manual VACUUM is still running, and so we can get a visual indication of how long we will roughly have to wait for it to finish.
What should I tune first?
In general, one might think that VACUUM is an expensive operation, and you'd want to only run it infrequently, maybe even as a nightly maintenance task.
That however is often the wrong way to approach it, as rarely run VACUUMs are much more expensive since they have more work to do, and it also means your system will spend more time in a sub-optimal state.
Instead, try to have VACUUM run more often, in proportion to UPDATEs and DELETEs your application performs. Frequently run VACUUMs will be faster, as there is less work to perform.
There is two primary tunings you should consider on production Postgres databases:
1) Lower autovacuum_vacuum_scale_factor on tables with old, inactive data
For tables with a lot of old, inactive data, consider lowering the threshold by which autovacuum is triggered. Since the calculation is based on the number of total rows in the table, autovacuum will not notice if most recent rows have been modified, since the overall number of dead rows will still be way below the default threshold of 20%.
However, you will see the impact of dead rows on your query performance, as the dead rows have to be scanned over when reading data. Reducing the scale factor to keep down the total number of dead rows can make sense in such cases.
2) Adjust autovacuum_cost_limit / autovacuum_cost_delay for bigger machines
The default settings for throttling are quite conservative on modern systems. Unless you run on the smallest instance type, or with the cheapest storage, it often makes sense to speed up autovacuum a bit.
In addition, for small tables that have a lot of updates/deletes, it can happen that autovacuum is not able to keep up, and that you will see new VACUUMs start pretty much right after the previous one was finished. In such cases adjusting the throttling on a per-table basis might also make sense.
Note that most autovacuum configuration settings can be overridden on a per-table basis:
ALTER TABLE my_table SET (autovacuum_vacuum_scale_factor = 0.05);It often makes sense to review that table's particular statistics, e.g. how often is the table updated and how many dead tuples does it accumulate, before modifying autovacuum settings.
The visualizations shown in this post are based on real data, and are now available for early access to all pganalyze customers on the Scale plan and higher.
Reach out to have this feature enabled for your account - we'd be happy to walk you through it, and help you tune autovacuum on your database.


