


Log Insights: Tuning Log Config Settings
Here we describe the individual parameters you can configure with Postgres to get useful log output that can then be read and analyzed by pganalyze Log Insights.
If you want to skip the details, this is the recommended configuration to start with:
log_min_duration_statement = 1000
log_lock_waits = on
log_temp_files = 0
# Note: log_checkpoints is not available on AWS Aurora (see below)
log_checkpoints = on
log_connections = on
log_disconnections = on
log_autovacuum_min_duration = 0
Slow queries
For logging specific slow queries, instead of the generalized form which has ?
and $1 instead of values, the log_min_duration_statement setting can be quite
useful.
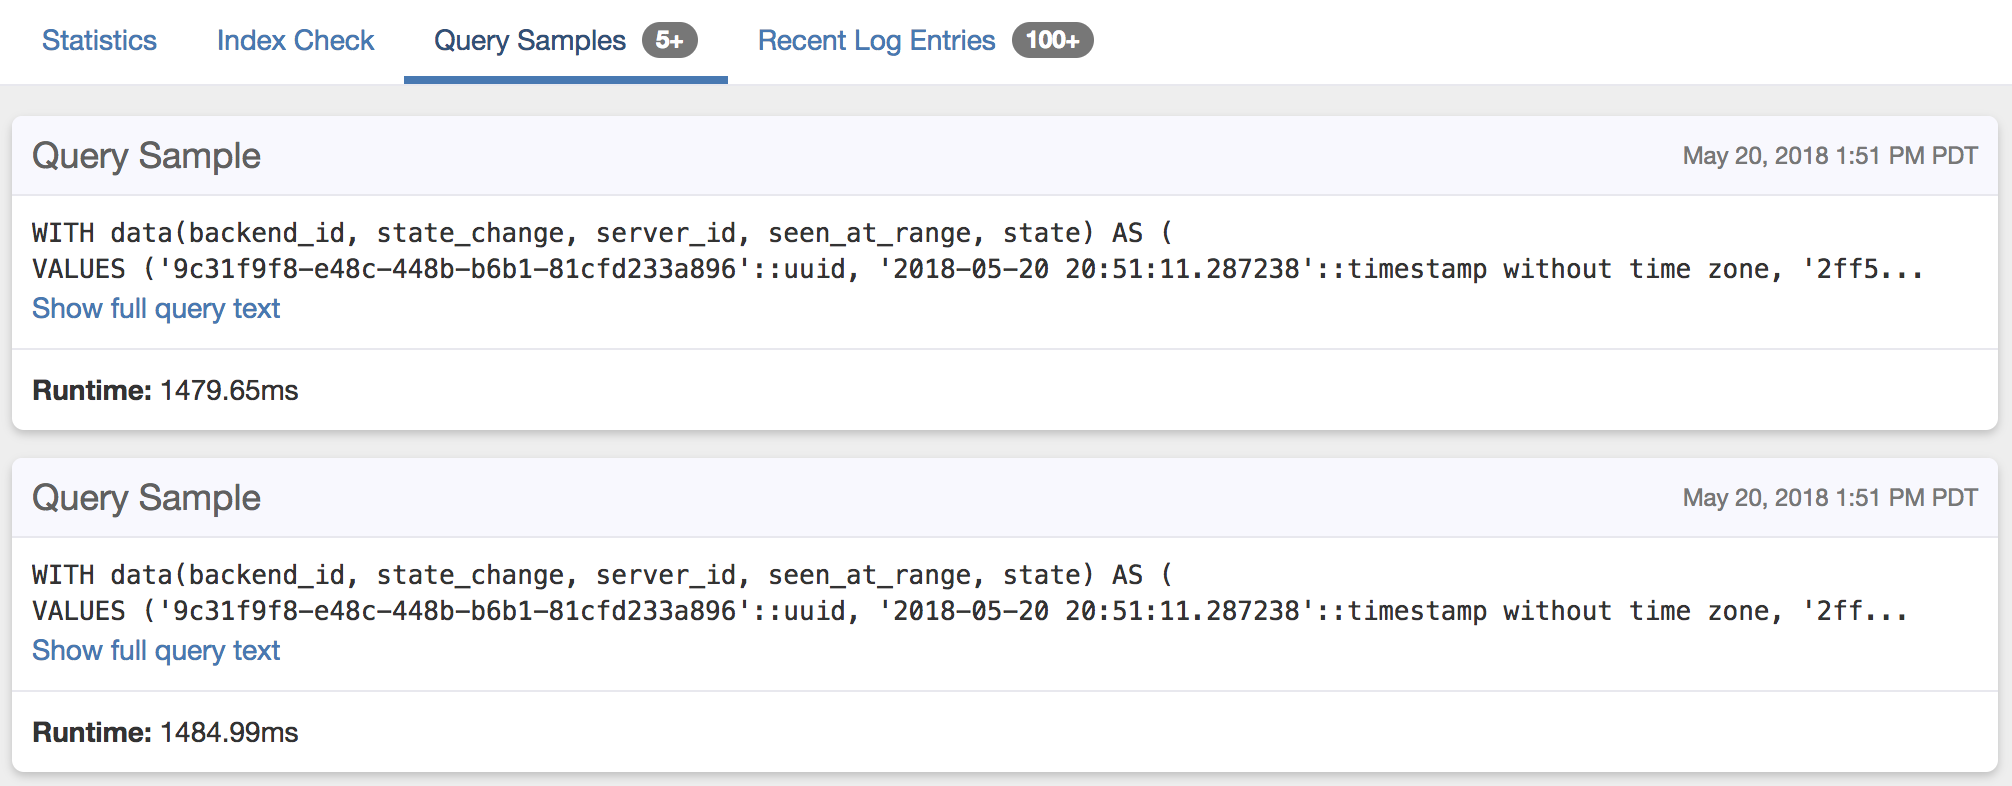
As a start, you can set this to 1s, or 1000 milliseconds, which logs every query
that takes longer than that:
log_min_duration_statement = 1000pganalyze will then show these as query samples on the query detail page:
EXPLAIN plans
See Collect Postgres EXPLAIN plans using auto_explain.
Lock waits
To enable logging of L70: Process acquired lock and Process still waiting for lock events, add the following:
log_lock_waits = onNote that this will only report on lock waits that exceed deadlock_timeout,
which defaults to 1s. Whilst you can lower this a bit, the lock checks can be
expensive if run much more often than the default setting.
See Guide: Monitoring Postgres locks using Log Insights for more details.
Temporary files
For getting S7: Temporary file notices, add the following:
log_temp_files = 0Note that the value here is a threshold, but in practice its often very useful
to start with a threshold of 0 (i.e. log all temp files) and then raise the
setting value if you are getting too much log output.
Also see Guide: Adjusting work_mem based on temporary file creation.
Checkpoints
Checkpoints can be I/O intensive events in Postgres, and so its highly recommended to enable logging for them to get more details:
log_checkpoints = onNote that this setting is not available on AWS Aurora (see here and here).
This will then give you the following log events: W40: Checkpoint starting, W41: Checkpoint complete as well as others.
pganalyze will also do analysis on the checkpoint reason for you:
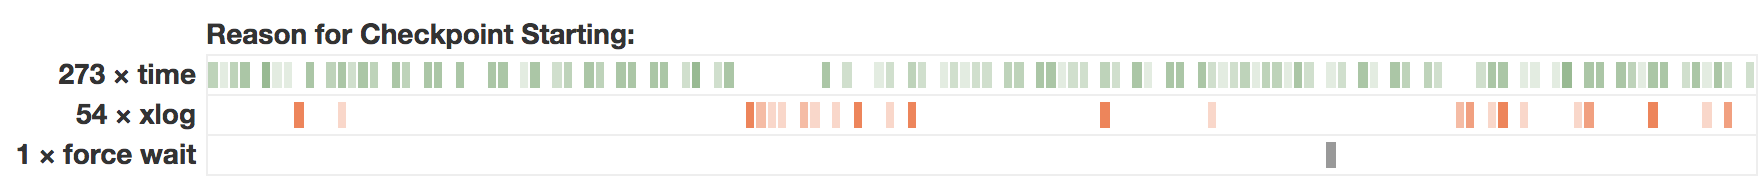
See Guide: Tuning checkpoint intervals to reduce I/O spikes for more details.
Connections
For logging connections, i.e. C20: Connection received and C21: Connection authorized, enable the following:
log_connections = onFor disconnects (C23: Disconnection) add the following:
log_disconnects = onIn general it is very useful to enable connection logging, both from an auditing perspective as well as to be able to trace back when a connection was opened and closed.
That said, if you are not using a connection pooler, and you are getting a lot of very short connections, you might find the amount of log data from connection logs overwhelming, and it’d be better to disable it in such cases.
DDL changes
In order to log changes to your schema, or other database-affecting operations, you can enable logging of all DDL statements:
log_statement = ddlWarning: Enabling this also causes ALTER USER statements to be logged. Make sure that
you run a session-local SET log_statement = none before running any statement that contains
a password.
These will then show up as T83: Statement notice.
Note that there is also a setting that would log every single query (log_statement = all)
which is not recommended for production systems, since the effort of log output
would slow down your database.
Autovacuum logs
You can use the log_autovacuum_min_duration setting to enable logging of autovacuum
operations (A65: Automatic vacuum of table completed and
A66: Automatic analyze of table completed):
log_autovacuum_min_duration = 0If you are seeing a lot of autovacuum activity it may make sense to specify a specific
threshold so only slow vacuums get logged. Note that as a starting point 0 is actually
useful, since you will also see if you have tables that get vacuumed a lot, but VACUUM
is too fast to get seen by other methods (e.g. sampling of pg_stat_activity).
Couldn't find what you were looking for or want to talk about something specific?
Start a conversation with us →