Step 1: Test Log Download
Log Insights works by continuously fetching your Postgres log files from AWS, classifying log lines, and submitting log data and statistics to pganalyze. The RDS configuration usually does not require any additional configuration beyond the steps you performed as part of basic setup, so we can proceed directly to testing the integration.
When the collector is installed in a virtual machine, you can now test and apply the collector configuration (for container environments, simply restart the collector):
sudo pganalyze-collector --test...
I [server1] Testing log collection (Amazon RDS)...
I [server1] Log test successful
I Successfully reloaded pganalyze collector (PID 123)The collector will start sending logs shortly.
The collector will only collect log data when you have an Amazon RDS host name specified (the instance/cluster name is auto-detected), or you manually specify the aws_db_instance_id/aws_db_cluster_id and aws_region settings.
In addition, you need to ensure that AWS APIs can be accessed either by using the EC2 metadata service, or by manually specifying the aws_access_key_id and aws_secret_access_keysettings.
In case you get permission errors, make sure your IAM user has the appropriate policy associated.
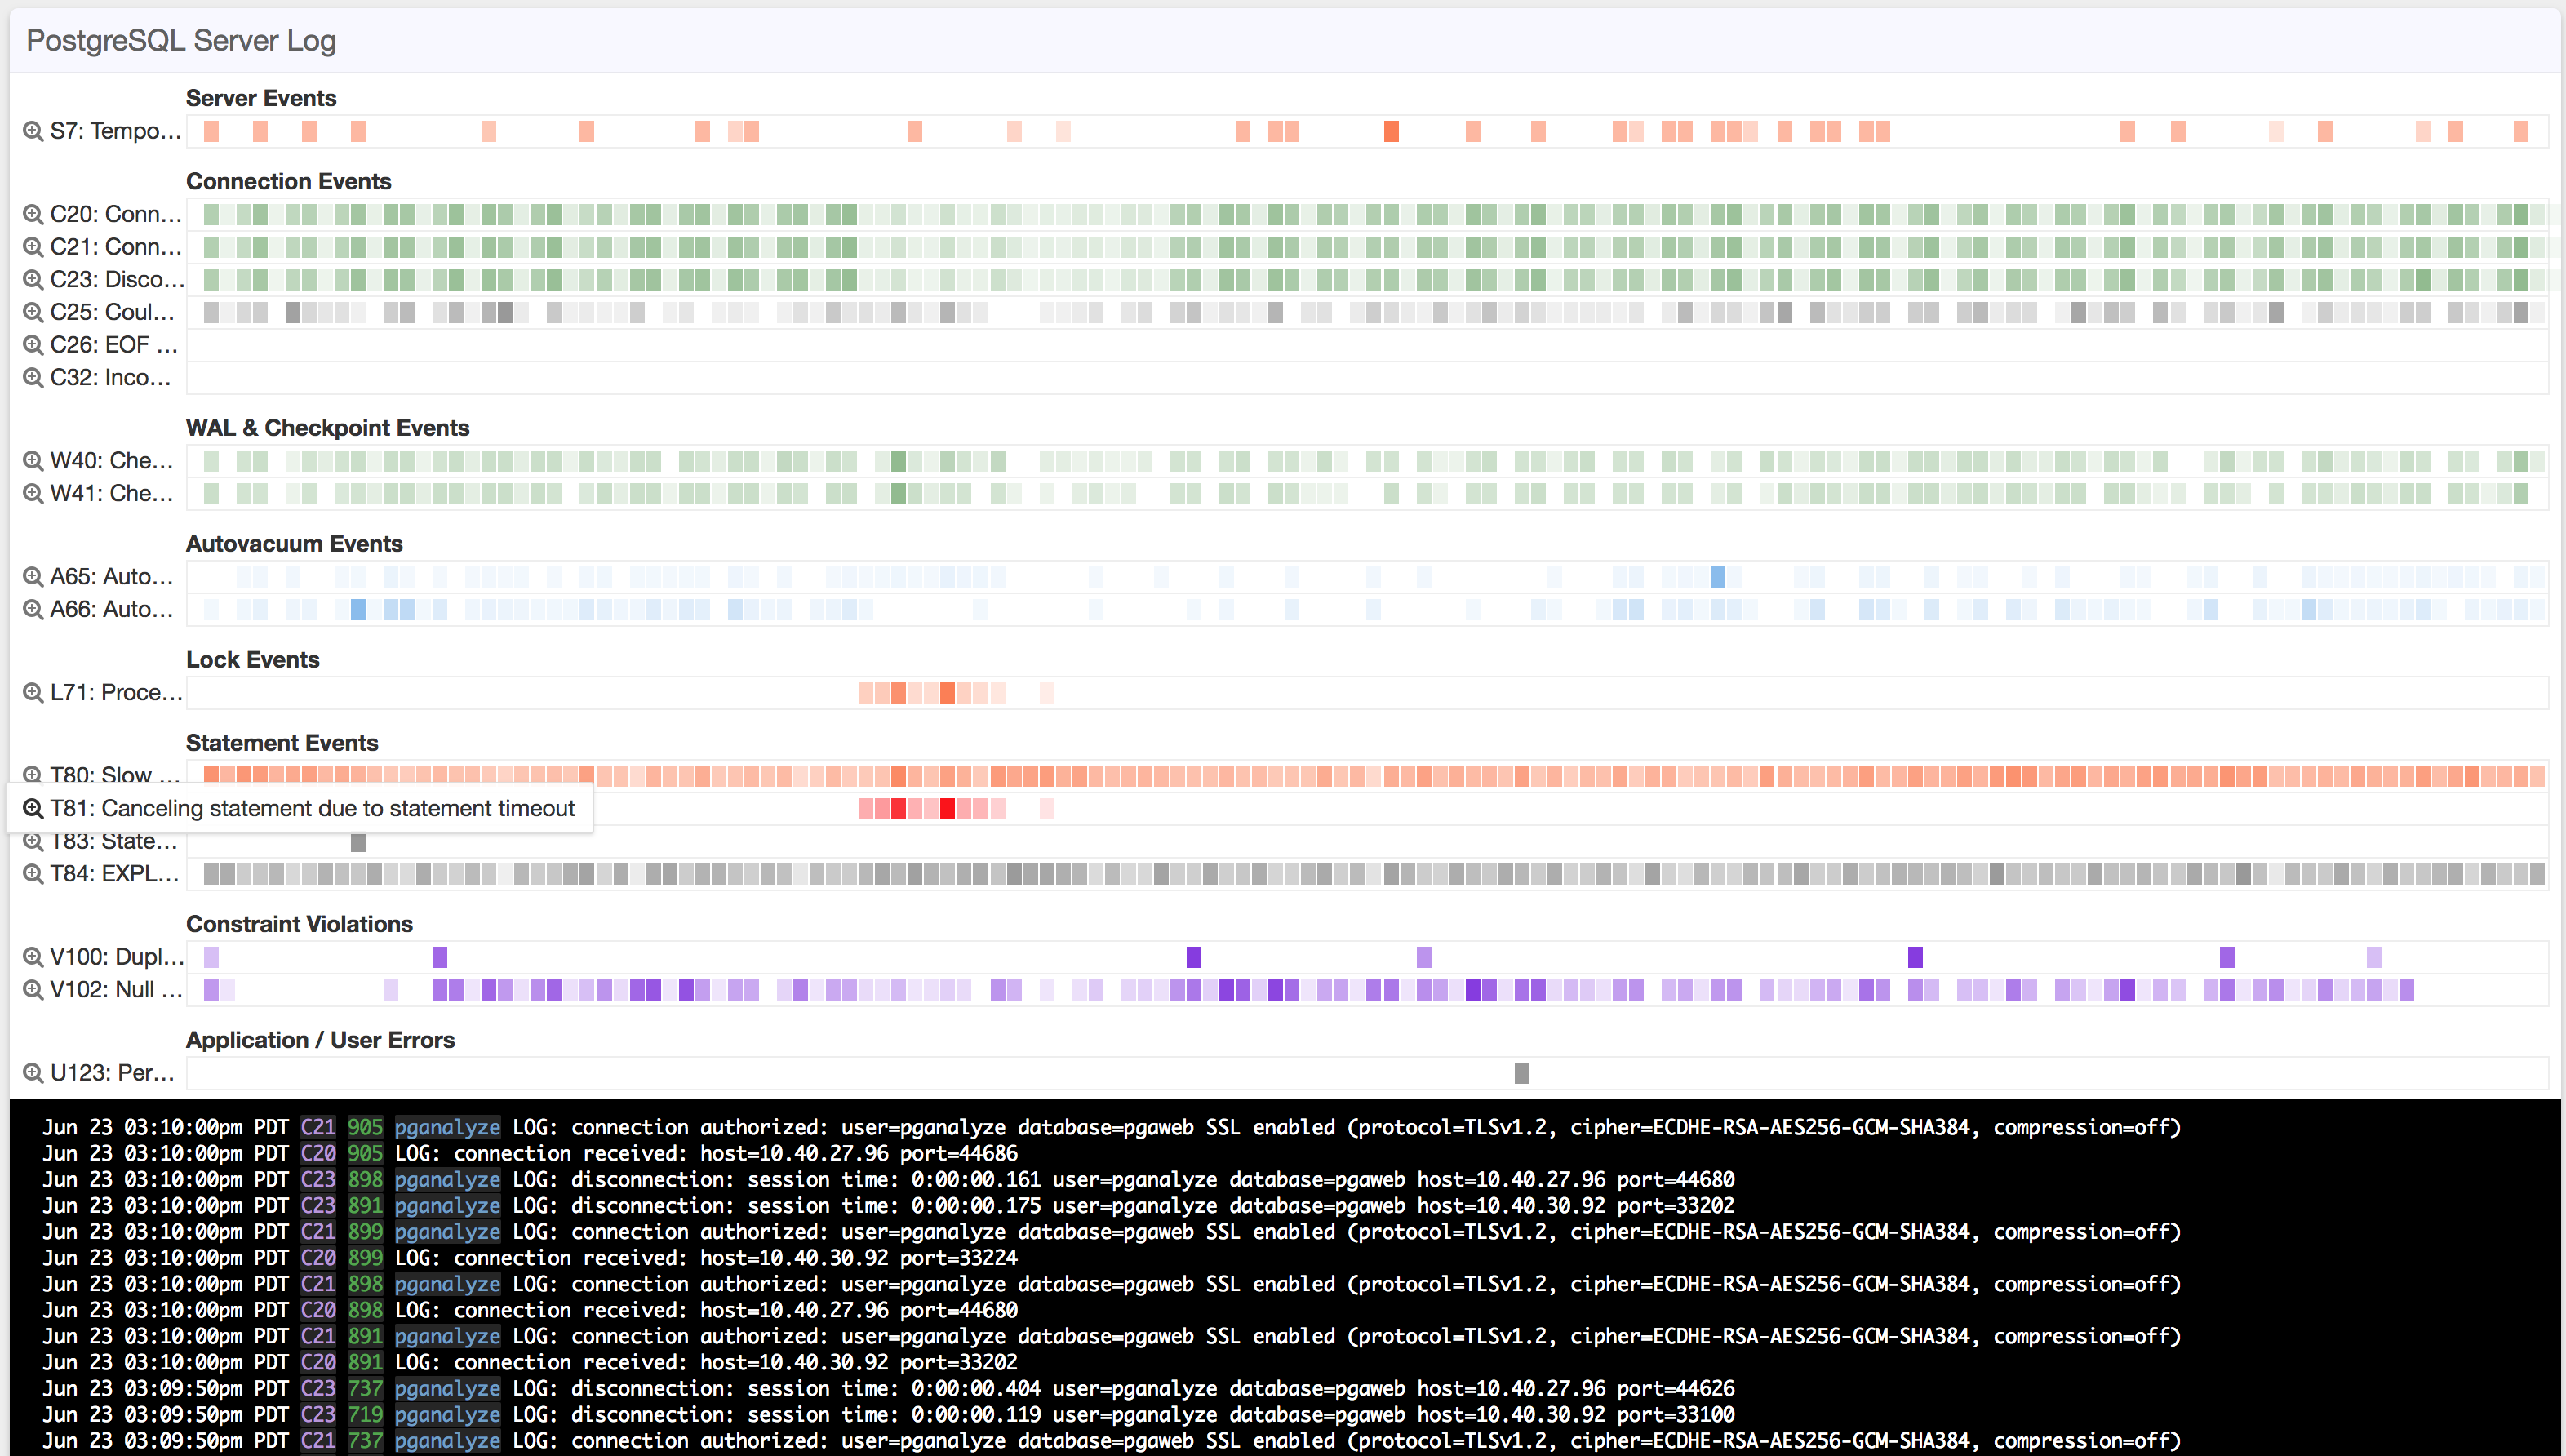
You will then see Log Insights data on your database within a few minutes:

We recommend that you also tune a few configuration parameters to get useful log output from Postgres.
Couldn't find what you were looking for or want to talk about something specific?
Start a conversation with us →