Introducing Log Insights: Realtime Analysis of Postgres Logs
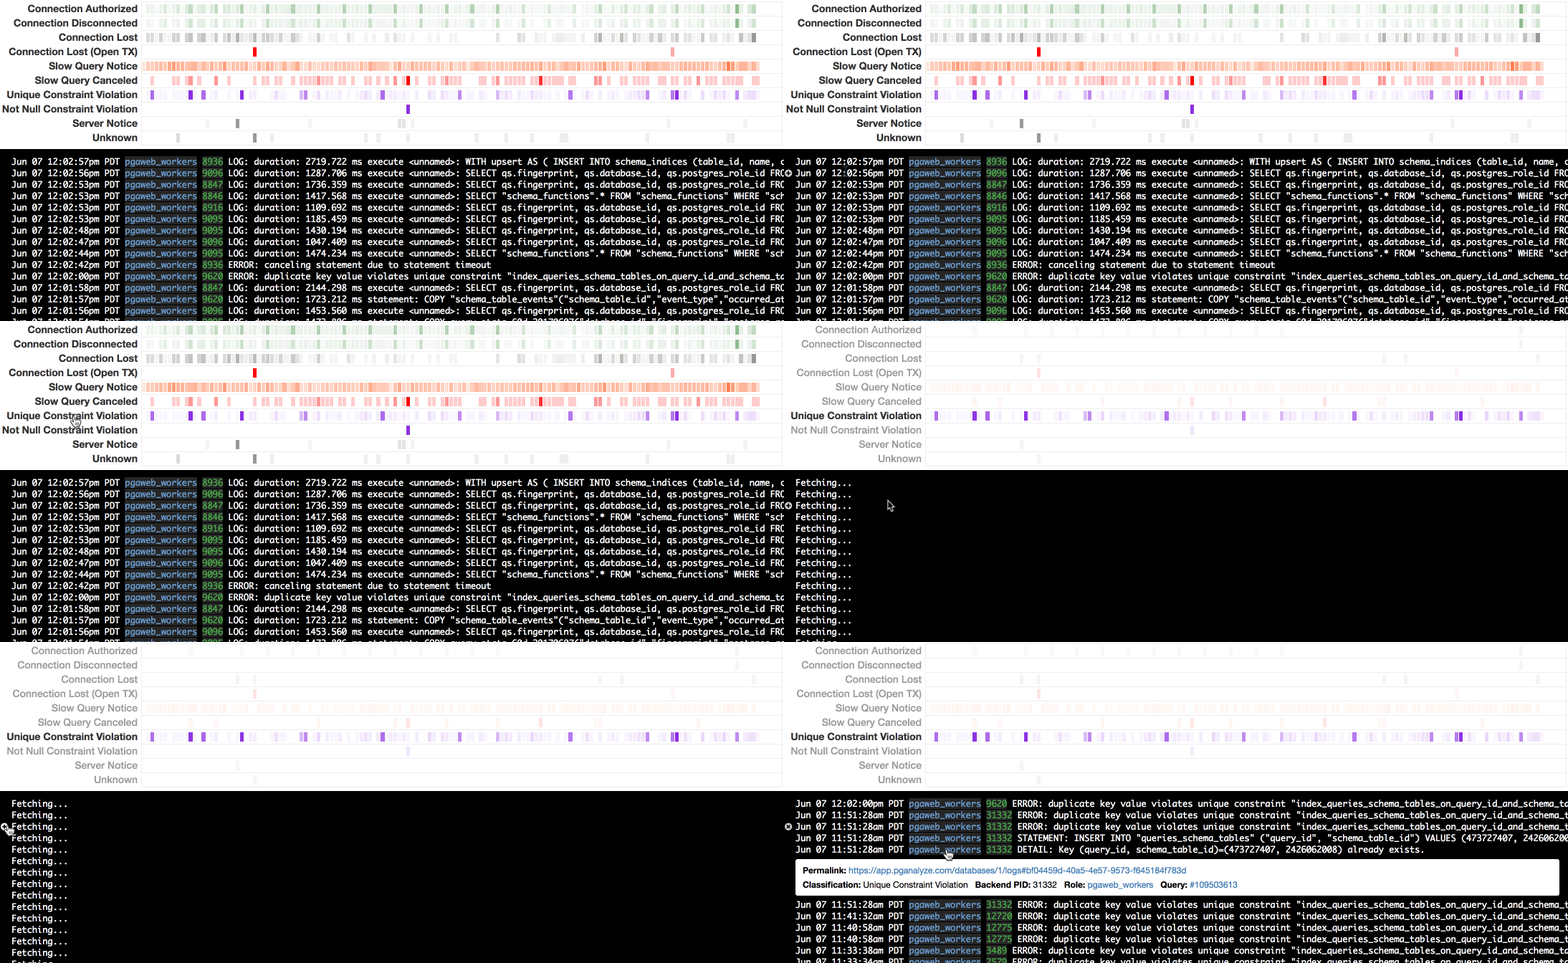
After significant development effort, we're excited to introduce you to a new part of pganalyze that we believe every production Postgres database needs: pganalyze Log Insights
UPDATE: We released pganalyze Log Insights 2.0 - read more about it in our article: Postgres Log Monitoring with pganalyze: Introducing Log Insights.
In the past you used generic log management systems and setup your own filtering and altering rules, which required a lot of manual effort, as well as knowledge of all potential issues that might happen in your Postgres database.
pganalyze Log Insights aims to do better than this.
It's the easiest, out of the box method, to understand what's going on in your Postgres database in realtime.

Realtime Analysis
With existing systems, you often process log data in batches, or after downloading them once every day. Compared to this, pganalyze Log Insights offers near-realtime updates by retrieving log data continuously (when streamed from a syslog source) or once a minute (for systems like Amazon RDS).
The pganalyze collector performs immediate analysis, categorization as well as extraction of important structural data in the message, e.g. the duration of a slow query or the I/O impact of a checkpoint.
Over 50 different log categories make sure that Postgres log events are correctly classified and prioritized, so you don't need to worry if you missed setting up your own filter for rare, but downtime-causing issues like Transaction ID wraparound, or invisible issues like lock contention that can cause spikes in CPU utilization.
Contextual
Because of the data pganalyze already collects, the system is able to associate log information to the correct queries, databases, roles and tables in your server.
For example, you are able to see all constraint violations and slow query notices for a given query in one place, or see connects/disconnects on a per-role basis for auditing purposes.
End-to-End Encryption
Postgres logs often contain sensitive information, with PII hiding in unexpected places like the DETAIL message of a Unique Constraint Violation.
When we built Log Insights we wanted to do better than existing products and make sure PII-encumbered data is only visible to those that need to see it.
To achieve this, all log data we retrieve and collect is stored on Amazon S3 with state-of-the-art AES-GCM encryption, with a client-side encryption key maintained by pganalyze and stored in Amazon's Key Management Service (KMS). For our Enterprise customers we also offer use of your own encryption key stored in your own AWS account, so you can easily revoke or rotate credentials as needed.
Data is encrypted by the pganalyze collector before being sent to S3, and decrypted in your browser using WebCrypto. Our web servers never see the original data in cleartext, only the metadata generated by the collector.
Alerting
We've heard many times that customers want to have better ways to be notified when things go wrong in their databases, or when a new deploy produces problems.
With Log Insights there is now a new data source that gives pganalyze realtime information about whats going on in your Postgres database.
We'll soon re-launch our existing notifications capabilities, with an initial set of alerts for log insights available to select customers today.
Conclusion
We believe Log Insights is the best way to keep track of what's going on with your Postgres database, and it makes pganalyze the only solution that combines query performance statistics and log information for real-time insights and alerts.
It's the easiest way to monitor your database, focused solely on PostgreSQL, providing tailored log filters and alerts out of the box.
pganalyze Log Insights is available today for all Scale plan customers or higher. This initial release supports gathering log data from Amazon RDS and Heroku Postgres with general syslog and file watch support coming soon.


