Introducing New Charts & Date Picker in pganalyze

Clear and flexible presentation of data is the bread and butter of a monitoring service. A good one will display the right data, but a great one can guide you toward meaningful insights. Visual representation of data in a clear and concise way can help you make decisions quickly.
Today we're releasing multiple updates to pganalyze that will help you get to insights more effectively, and keep your database running smoothly.
Date range selection as a first-class concept
The biggest feature in our update is not visual: It's a change in behavior and usability. A common challenge in the context of Postgres databases is answering a question like
"What happened to my database yesterday at 9pm?”
In previous versions of pganalyze, most charts allow you to select from a few different predefined periods, and to zoom in with an overview "scrubber". While it's great to be able to dive into the data, the provided interaction was limited inside individual charts, making it difficult to explore correlations.
Instead of just linking date range selection across related charts, we decided to rethink it entirely. We made date range selection a first-class concept in the application.
When you select a range, that range will apply to all charts on the page. When you navigate to a different page, the selected range is maintained 1, and all charts on the new page will load data according to the current range. This lets you navigate your metrics in a much more natural way, and simplifies analyzing metrics and exploring correlations.
Consistent charts across pganalyze
We've rewritten most of our charting components from scratch. This fixes a number of bugs, and allows us to be more consistent in terms of visual presentation and chart behavior.
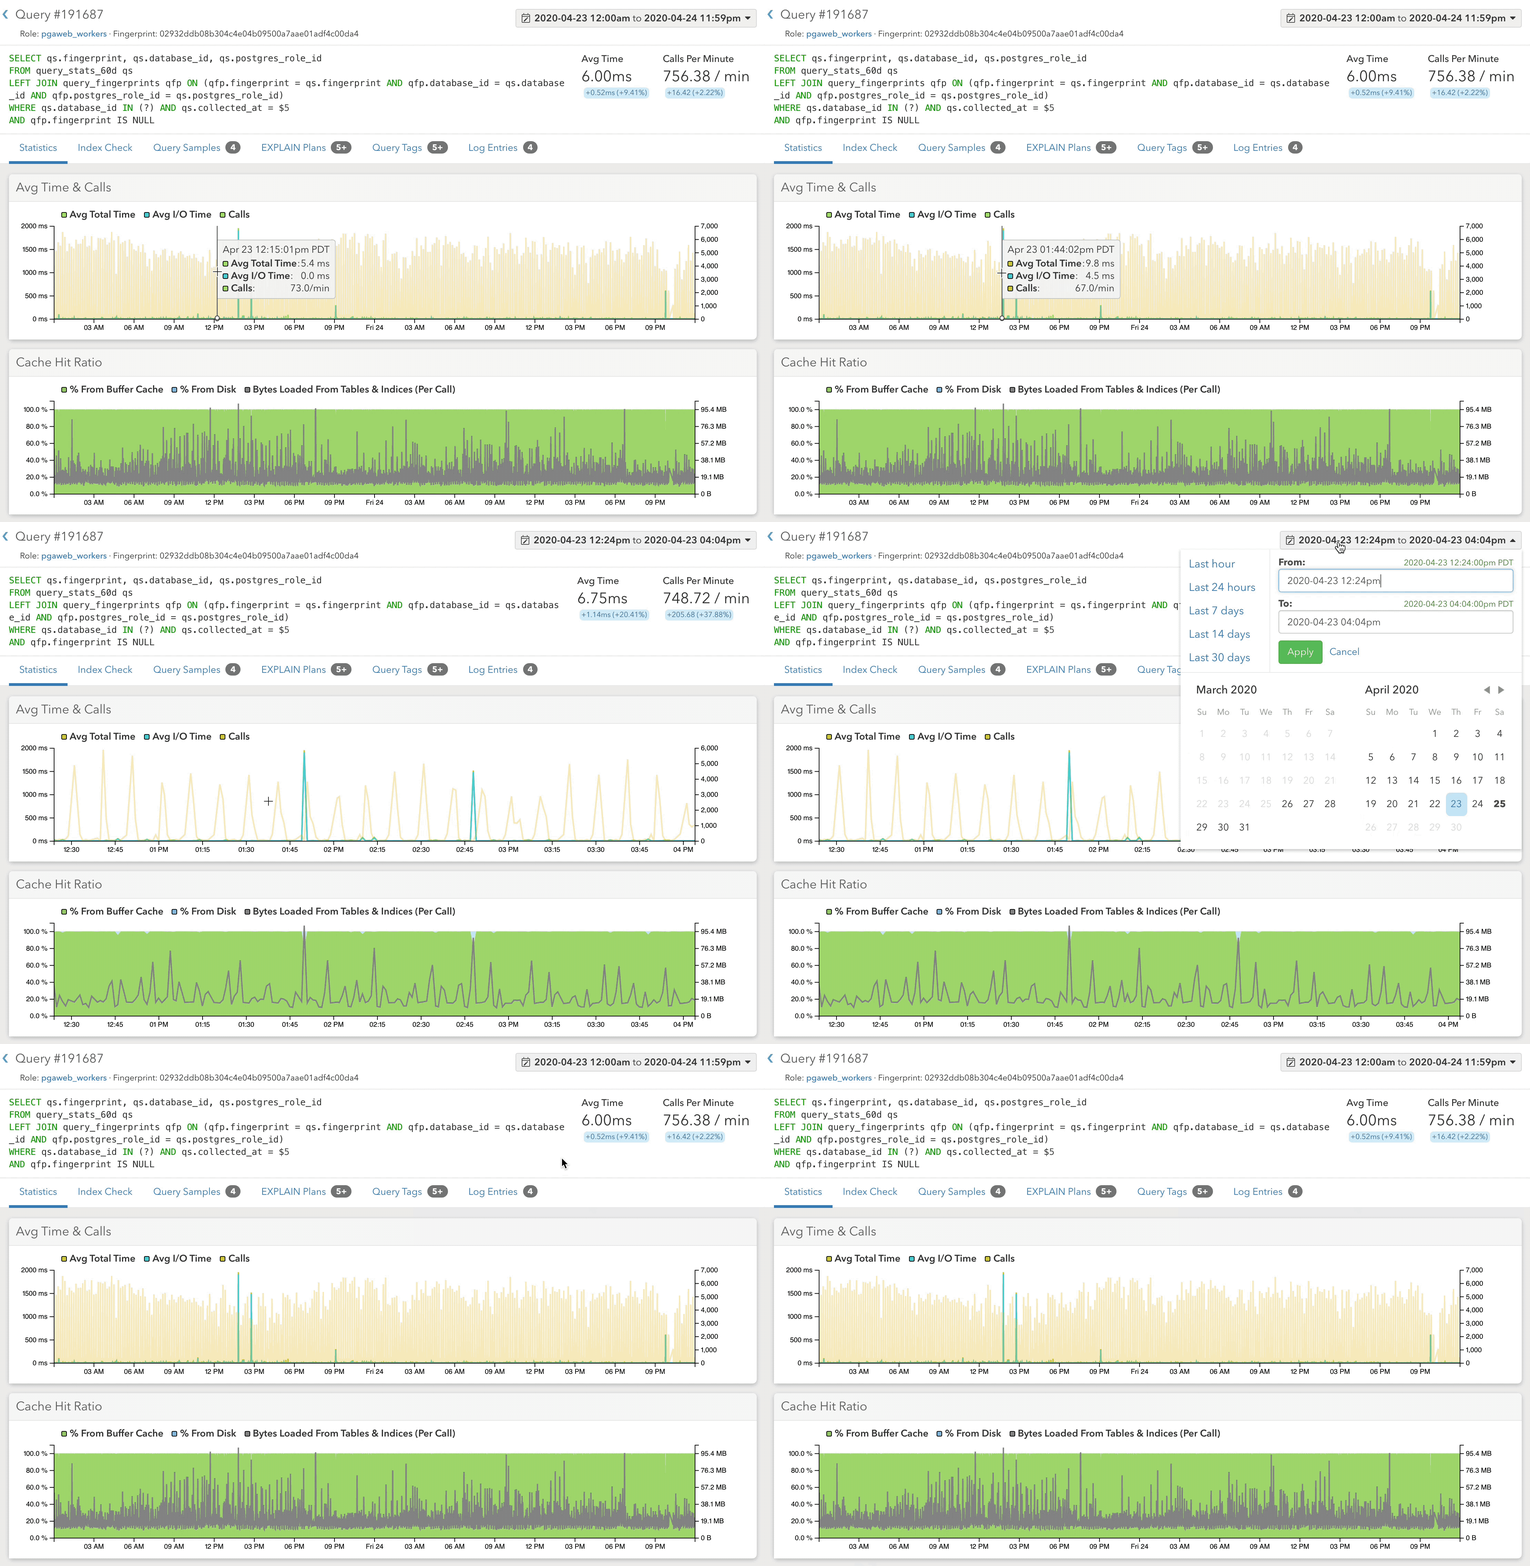
For example, charts on the query details page:
Now work the same way as charts about table VACUUM behaviour:
Click & drag to zoom
Our new charts are tied into our new date range selection mechanism. They not only respond to changes in the application date range, but update it as well. When you drag to select a region of a chart, you'll begin to define a period of time to zoom in on – across the whole application.
The date range is updated when you release your mouse button, and, just like when using the time picker directly, all charts that are tied to the date range update in response. If you start dragging accidentally, or change your mind, you can avoid defining a new date range by dragging the cursor outside of the chart.
New date picker
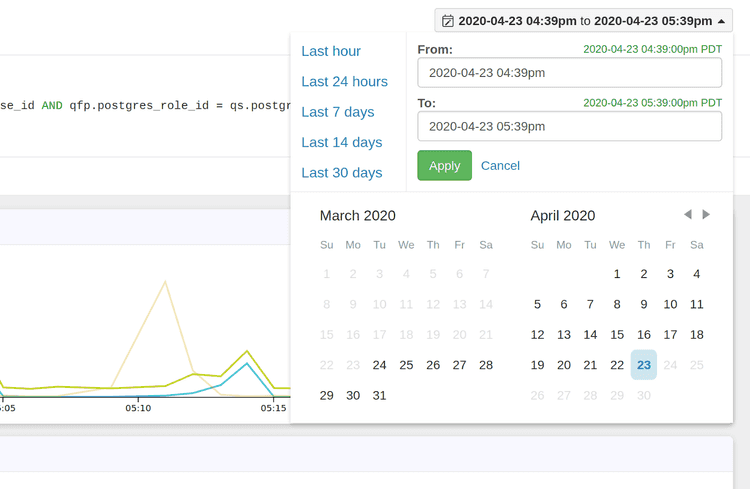
To make this behavior even more useful, we've added a date picker component to simplify selecting date ranges. The date picker is consistently available on the top right of each page:
Common time frames such as “last hour” or “last 30 days” are available directly. You can also select from the calendar to pick specific dates, or even enter more granular timestamps or natural-language expressions like "3 days ago". Dates outside of the range of available data 2 are not accessible.
Treating the selected date range as a first-class citizen, and giving you more granular control over which data you're looking at, makes it easier to navigate and understand your database activity.
Undefined data handling
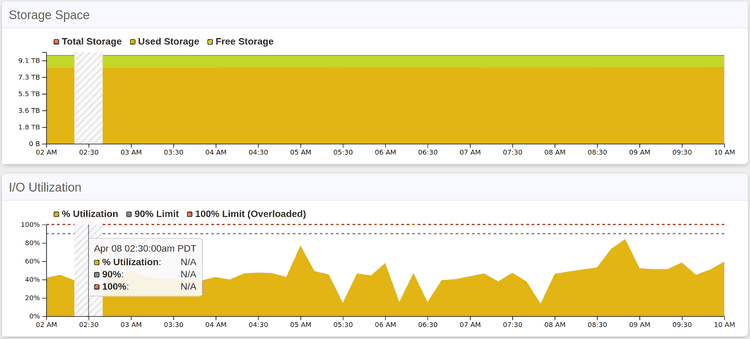
Another behavior change is our undefined data handling. Previously, if there was an issue and the pganalyze collector failed to send metrics data for your database, that was represented as zero values in the graphs. Now, the UI correctly identifies timeframes when no data was received, and lets you know that there is some data missing.
Summary
We've redesigned our chart and date range functionality from the ground up to better support your workflows. Exploring Postgres metrics to discover insights is a key activity with pganalyze, and with this release it's easier than ever before.
The new chart and date range features are available today. If you’re an existing customer, you can sign in to your account to try them now. If you would like to check out pganalyze, please sign up for a free 14-day trial.
We hope the new features make it easier to keep an eye on your PostgreSQL databases.
- Some pages have more limited data availability; if some data in the selected range is not available, pganalyze will load all available data instead and you can refine as needed. When you navigate to another page, the original range is restored.↩
- 30 days on most features on our Scale plans, and 14 days on Production plans↩


