Tracking Postgres Buffer Cache Statistics over time with pganalyze
When Postgres accesses data for a query, the tables and indexes first pass through the buffer cache, which is a fixed-size in-memory cache, configured by the shared_buffers setting. Query performance can often rely on whether the query’s data is already in the cache or whether it has to access the underlying disk (or OS page cache) for a significant amount of data.
Today, we’re announcing the new Buffer Cache Statistics feature in pganalyze, which relies on the pg_buffercache extension to show you how Postgres cache contents are changing over time. This new feature helps you pinpoint whether a slow query occurred because the cache contents changed, as, for example, how an unrelated workload caused the relevant table to go out of cache.
With the new Buffer Cache Statistics you can quickly identify how your workload affects the cache content, and the impact on query performance. You can also use pganalyze to quickly drill down into individual tables or indexes to assess cache behaviour over time, and correlate it with query slowdowns on that table.
How pg_buffercache works
In order to query pg_buffercache, and to use the new Buffer Cache Statistics feature, you first have to create the pg_buffercache extension:
CREATE EXTENSION pg_buffercache;Afterwards you can query the view to get the state of each individual 8kb buffer page:
SELECT * FROM pg_buffercache LIMIT 1;-[ RECORD 1 ]----+-----
bufferid | 1205
relfilenode | 16434
reltablespace | 1663
reldatabase | 16384
relforknumber | 0
relblocknumber | 0
isdirty | f
usagecount | 5
pinning_backends | 0This references that the buffer with the ID 1205 currently contains data from the relation (table or index) that’s identified by relfilenode 16434, the fork 0 (file number in the relation), and the block 0 (8kb block number in the file).
We can identify which table it is by looking up the relfilenode in pg_class, whilst being logged into the database identified by OID 16384:
SELECT relname FROM pg_class WHERE relfilenode = 16434;-[ RECORD 1 ]---
relname | quotesTo do this at scale, you could run a query like the following to get the Top 10 tables currently in cache, as described in the Postgres documentation:
SELECT n.nspname, c.relname, count(*) AS buffers
  FROM pg_buffercache b
  JOIN pg_class c ON (b.relfilenode = pg_relation_filenode(c.oid) AND
                      b.reldatabase IN (0, (SELECT oid FROM pg_database WHERE datname = current_database())))
  JOIN pg_namespace n ON n.oid = c.relnamespace
 GROUP BY n.nspname, c.relname
 ORDER BY 3 DESC
 LIMIT 10;
nspname | relname | buffers
------------+------------------------------+---------
public | invoices | 1587
public | companies | 623
public | contacts | 603
public | subscriptions | 184
public | contacts_pkey | 116
public | index_contacts_on_company_id | 75
pg_catalog | pg_attribute | 65
public | invoices_pkey | 56
pg_catalog | pg_statistic | 50
pg_catalog | pg_proc | 43This tells us that for this database, the invoices table is taking the most space of the buffercache. If we were to load a large table, this could quickly change, making queries on these tables slower.
Tracking per-table changes over time in pganalyze
To correlate a slow query with the state of the buffer cache, and understand changing workload patterns better, the new Buffer Cache Statistics feature in pganalyze automatically tracks the pg_buffercache view every 10 minutes, and summarizes it on a per-table/per-index basis.
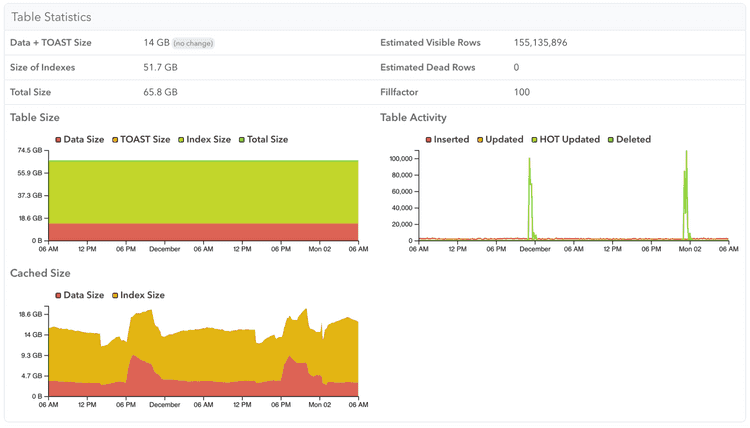
Then viewing a specific table, you can see a breakdown of buffer cache usage for the table, TOAST, and index data over time. Here you can see an example of one table that's always in memory:
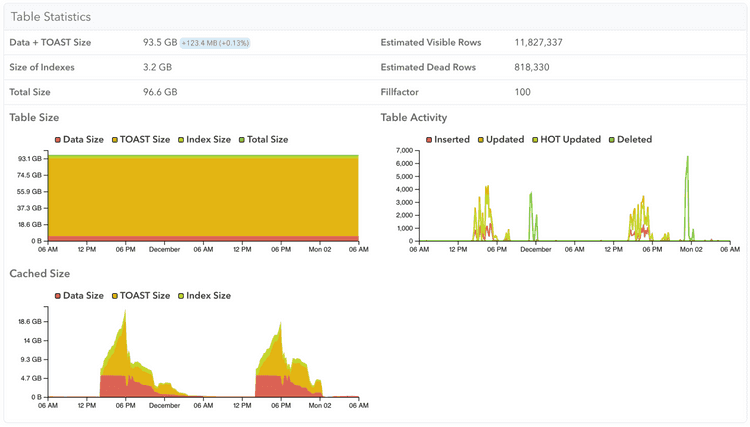
While here is a different table that is only in memory while its query workload requires it:
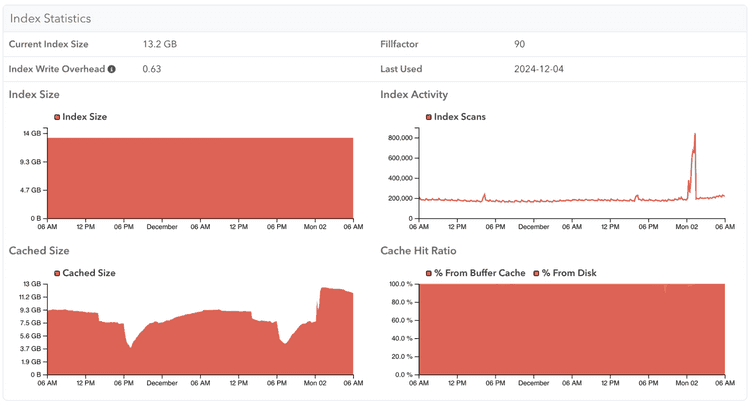
You can also see the buffer cache usage of a specific index, to understand how query performance may be impacted by having to load index pages that are not in cache:
Tracking system-wide cache changes in pganalyze
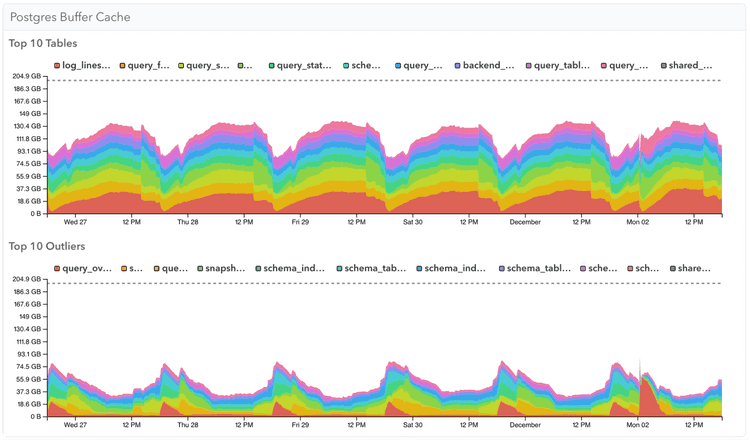
With the new Buffer Cache Statistics, the System Memory page now has two additional graphs showing buffer cache usage across your Postgres server.
Top 10 Tables shows the tables that usually take the most memory, while Top 10 Outliers shows the tables that use the most memory for a shorter period of time:
Note that if a table is considered a Top 10 table it will be excluded from the Top 10 outliers. Further note that this data gets aggregated across all databases in a server, so is most useful when you have a few large tables that influence caching behaviour.
Performance implications of collecting shared buffer statistics
Since Postgres 10, the pg_buffercache view uses reduced locking and as such, in our experience, is generally safe to query on production systems without impacting the regular workload. pganalyze queries the buffer cache data every 10 minutes.
By default this feature is only turned on for servers with shared_buffers configured for 200 GB of RAM or less. You can change the threshold by setting the max_buffer_cache_monitoring_gb setting, e.g. to 300 in the collector config.
This threshold exists because pg_buffercache incurs a fixed CPU cost for each buffer page (more buffer pages = more CPU used by querying it), as well as the fact that it temporarily writes its data to a temporary file, which has a size of roughly 0.5% of the shared_buffers value, or about 1GB at 200 GB shared_buffers.
Getting Started
This new feature to track the PostgreSQL buffer cache is available now for all pganalyze Cloud customers and will be included in the next pganalyze Enterprise Server release. To enable this function follow our documentation for setting up the pg_buffercache extension on your Postgres database server, running pganalyze collector 0.63.0 or newer, with your shared buffers set to 200GB or less. You can control this threshold, or turn off the feature by setting the max_buffer_cache_monitoring_gb collector setting.
We’re excited to bring you this additional Postgres specific data point in pganalyze & are looking forward to your feedback. If you want to learn more about how pganalyze can help make your Postgres database performant don't hesitate to request a demo. We plan to expand this functionality with additional data points, such as buffer usage counts, in the future.


