Introducing Postgres Plan Statistics in pganalyze for Amazon Aurora
At pganalyze we've offered query performance monitoring of Postgres databases for many years now, helping companies at scale ensure their Postgres database is performant and queries are as fast as possible. One common story we hear when it comes to analyzing Postgres performance, and identifying the root cause of slowdowns is: Has my query plan changed?
Recently Amazon Aurora, the highly scalable AWS PostgreSQL service, has made execution plan data more readily available by introducing aurora_stat_plans, a function now integrated with pganalyze to automatically collect plan statistics for all queries.
While pganalyze already offers robust query performance analysis—allowing you to identify slow queries, see how much system resources they're consuming, and dive deeper into why they're running inefficiently—this new integration gives our users on Amazon Aurora access to execution plans not usually retained by Postgres, without measurable overhead.
Today we're excited to introduce the new Plan Statistics feature in pganalyze, initially available on Amazon Aurora, with plans to expand it for all database servers going forward. This function is turned on by default in Amazon Aurora versions 14.10, 15.5, and higher, providing immediate access to enhanced insights without any additional configuration.
The challenge collecting Postgres Plan Statistics
While PostgreSQL's statistics collector offers information about database activity, it lacks detailed execution plans for queries. With pg_stat_statements, PostgreSQL tracks statistics on a per-query basis—but it doesn’t retain the execution plans that explain why certain queries perform poorly, or split out statistics based on different plans chosen for the same query. Tools like EXPLAIN and EXPLAIN ANALYZE can help investigate individual queries, and auto_explain can help track plans for outlier executions, but it isn't practical to run continuously on every single query because it would introduce too much overhead.
Back when pg_stat_statements was first developed, an alternate extension, pg_stat_plans was created as well, that allowed query plan tracking in addition to query statistics. The idea is simple: Instead of tracking a queryid, track the planid, that differentiates different query plans for the same query.
Fun fact: The very first version of pganalyze back in 2012 was built with pg_stat_plans in mind, using it as the main data source. However, we quickly changed our approach when pg_stat_statements became part of core Postgres, and pg_stat_plans was no longer maintained. pg_stat_plans also has some practical issues that make it unsuitable for production, such as accidentally executing multi-statement queries when printing out their EXPLAIN plan.
Since then, other extensions have emerged in the Postgres community, like pg_store_plans, that offer ways to track per-plan statistics. We've done some more investigation of pg_store_plans and its feasibility in production, which you can find later in this post. However, let's talk about Amazon Aurora first.
Amazon Aurora's new built-in aurora_stat_plans function
Earlier this year, Amazon Aurora PostgreSQL introduced new query plan monitoring functionality, that returns per-plan statistics of the given Aurora instance when using Amazon Aurora 14.10, 15.5, and higher. And, most importantly, this new functionality is now enabled by default on Amazon Aurora, making AWS the first cloud provider to make aggregate per-plan statistics available in their managed offering.
We took a closer look at how the new functionality works. At its core, the new aurora_stat_plans introduces a planid to track each kind of query plan for a given queryid:
SELECT planid, calls, mean_exec_time FROM aurora_stat_plans(true) WHERE queryid = -992910594131610293 ORDER BY calls DESC; planid | calls | mean_exec_time
-------------+---------+--------------------
-1742045606 | 2556555 | 144.906537411382
1209720180 | 90376 | 18.398387902275076
1152279781 | 546 | 3.0803269890109903
(3 rows)These are counter values like used in pg_stat_statements, meaning you have to take snapshots over time, or reset statistics, to understand when a given plan was used.
Additionally, aurora_stat_plans also introduces a new mechanism to track the EXPLAIN for each plan. Instead of running EXPLAIN at time of statistics collection, aurora_stat_plans captures the EXPLAIN (or optionally EXPLAIN ANALYZE) for a query at the time of first execution, and at configurable intervals thereafter.
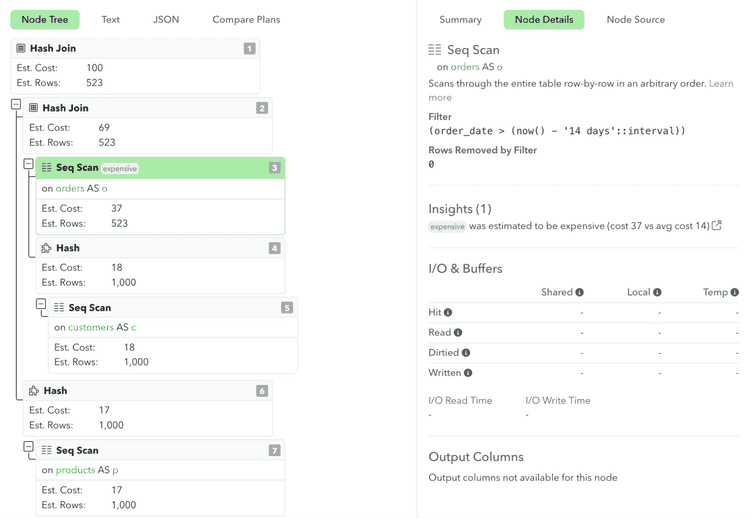
That means we can reliably get the printed out plan structure, like with EXPLAIN:
SELECT planid, plan_type, plan_captured_time, explain_plan FROM aurora_stat_plans(true) WHERE queryid = -992910594131610293 AND planid = -1742045606;-[ RECORD 1 ]------+---------------------------------------------------------------------------------
planid | -1742045606
plan_type | estimate
plan_captured_time | 2024-11-14 08:35:28.182251+00
explain_plan | Hash Join (cost=60.00..100.24 rows=523 width=35)
| Hash Cond: (o.product_id = p.product_id)
| -> Hash Join (cost=30.50..69.36 rows=523 width=28)
| Hash Cond: (o.customer_id = c.customer_id)
| -> Seq Scan on orders o (cost=0.00..37.48 rows=523 width=20)
| Filter: (order_date > (now() - '14 days'::interval))
| -> Hash (cost=18.00..18.00 rows=1000 width=16)
| -> Seq Scan on customers c (cost=0.00..18.00 rows=1000 width=16)
| -> Hash (cost=17.00..17.00 rows=1000 width=15)
| -> Seq Scan on products p (cost=0.00..17.00 rows=1000 width=15)The cherry on top: If we know what plan a given planid refers to, we can also get the planid for a currently running query, using the new aurora_stat_activity view:
SELECT state, query_start, activity.query, explain_plan
  FROM aurora_stat_activity() activity
  JOIN aurora_stat_plans(true) plans ON (activity.plan_id = plans.planid)
 LIMIT 1;
-[ RECORD 1 ]+-------------------------------------------------------------------
state | active
query_start | 2024-11-20 23:52:06.339318+00
query | INSERT INTO orders (customer_id, product_id, quantity, order_date)
| VALUES (233, 639, 7, NOW() - INTERVAL '10 days');
explain_plan | Insert on orders (cost=0.00..0.02 rows=0 width=0)
| -> Result (cost=0.00..0.02 rows=1 width=24)These functions allow for automatic, low-overhead collection of execution plans for all queries without impacting performance. By exposing this data, Aurora allows users to gain deeper insights into how queries are executed. This means you can understand not just which queries are slow, but why they are slow by examining the execution plans.
New pganalyze Features for Aurora Users
But what if we don't want to query this data manually using SQL?
Today, we're excited to introduce the new pganalyze Plan Statistics feature, initially available for Amazon Aurora. This functionality automatically integrates with aurora_stat_plans when available, and captures per-plan statistics over time, making them accessible in the pganalyze user interface. By leveraging Aurora's new capabilities, pganalyze now offers:
Comprehensive Execution Plan Collection
pganalyze automatically uses the aurora_stat_plans function to collect execution plans for all queries without manual intervention or performance impact.
Note: pganalyze includes the original plan ID in addition to the Plan Fingerprint calculated by pganalyze. The original plan ID can be used with Aurora Query Plan Management, e.g. by calling the set_plan_status function, to mark a particular plan as preferred.
Historical Execution Plan Analysis
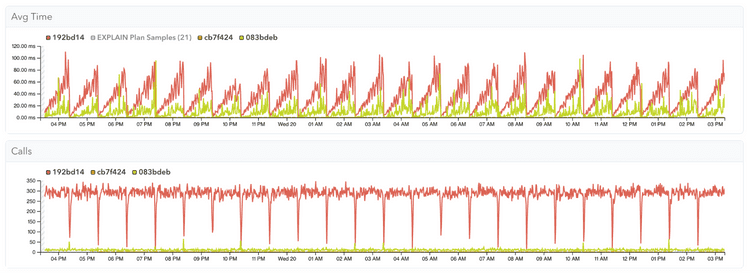
Execution plans are stored over time, allowing you to compare past and present plans for the same queries. This helps in identifying when and why a query's performance may have changed, or whether certain query plans perform worse than others for the same query:
Deeper Insights into Query Performance
With access to detailed execution plans, you can dive into the actual execution strategies used by the database. This enables you to understand the root causes of slow queries, such as inefficient joins, missing indexes, or suboptimal planner decisions. You can also detect when queries start using inefficient plans due to changes in data or configurations.
With pganalyze and Amazon Aurora PostgreSQL version 14.10, 15.5, or higher combined, you can:
- Efficiently Troubleshoot Performance Issues: Quickly find the root causes of slow queries by examining execution plans.
- Optimize Queries Effectively: Make informed decisions on query rewrites, indexing, and configuration adjustments.
- Monitor Changes Over Time: Keep track of how execution plans evolve, helping you maintain optimal performance.
Why auto_explain can be a useful data source, even with plan statistics
One notable detail about aurora_stat_plans is that it captures the plan of the query, but doesn't capture any execution statistics by default. This is intentional, since capturing execution time statistics for individual plan nodes carries some overhead, and it would make it harder to turn this on by default for every Aurora customer.
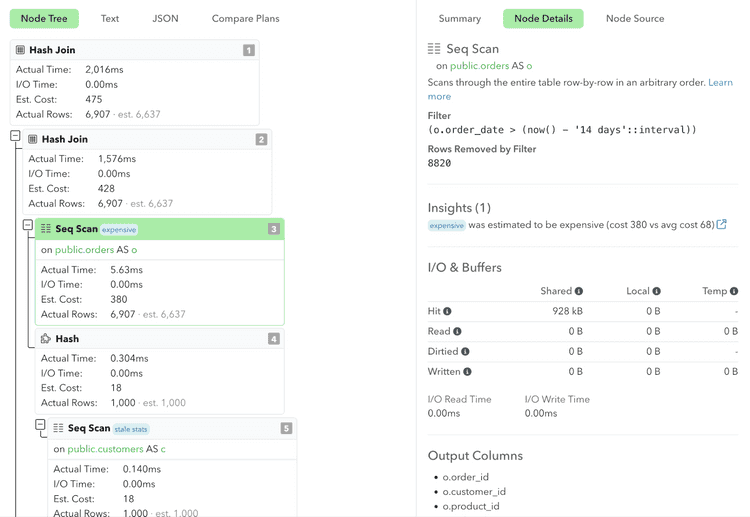
At pganalyze we've recommended using the auto_explain extension for Postgres for many years now, as part of our Automated EXPLAIN feature. We typically recommend using it in production with the log_timing setting set to off, but log_analyze and log_buffers set to on (see the pganalyze auto_explain setup guide). Whilst this omits per-plan node timing information, it gives per-plan node I/O timing information, as well as actual row numbers returned by each plan node. This presents a good trade-off that lets you understand exactly where an execution went wrong—for example when Postgres chose to pick the wrong index, or an inefficient join order, due to a row mis-estimate.
You could use the aurora_stat_plans settings aurora_stat_plans.with_analyze and aurora_stat_plans.with_timing to achieve a similar behavior—with one main downside:
auto_explain allows you to capture the outliers of queries, that is, every query execution that exceeds a particular threshold, for example 1000 ms. This helps with debugging the most problematic cases that are likely impacting customers the most.
aurora_stat_plans on the other hand captures the EXPLAIN (or EXPLAIN ANALYZE with the mentioned settings) the first time when a query is not yet captured in its internal table. It also allows recapturing query plans on an interval, e.g. once a day, or after a certain number of executions. But that leaves out the use case where the same plan structure results in different execution times, e.g. because one customer has more data than the other.
We, therefore, continue to recommend auto_explain in pganalyze, even to Aurora customers. We now show the plan statistics together with the plan samples, depicted by the purple dots in the plan statistics graphs:
And you can also see that plans from auto_explain have all details necessary for a full analysis of execution behavior, like how many rows were not used in the result of a scan:
Expanding Plan Statistics Beyond Aurora
We recognize, of course, there are many Postgres databases not on Amazon Aurora. And we think it’s important to have a reliable solution that can be used on self-managed servers, and other managed database providers.
Per our research, the closest contender that exists today is the pg_store_plans extension. As part of adding the new plan statistics feature, we took a close look at whether we should recommend pg_store_plans as an open-source alternative, and integrate it with pganalyze as well.
First of all, whilst pg_store_plans is not yet available for Postgres 17, it supports Postgres 16, and as such is certainly more maintained than the previously mentioned pg_stat_plans (that we do not recommend using).
Functionally, at the surface, pg_store_plans seems comparable to what aurora_stat_plans offers. However, we've found one main reason to not use pg_store_plans in production today: It has considerable overhead in how it calculates the planid.
A quick excursion into the pg_store_plans source code shows that the planid is calculated by printing the EXPLAIN plan, and then hashing a modified version of the resulting text using built-in Postgres hash function:
ExplainPrintPlan(es, queryDesc);
…
normalized_plan = pgsp_json_normalize(plan);
shorten_plan = pgsp_json_shorten(plan);
elog(DEBUG3, "pg_store_plans: Normalized plan: %s", normalized_plan);
elog(DEBUG3, "pg_store_plans: Shorten plan: %s", shorten_plan);
elog(DEBUG3, "pg_store_plans: Original plan: %s", plan);
plan_len = strlen(shorten_plan);

key.planid = hash_any((const unsigned char *)normalized_plan, strlen(normalized_plan));
We've done some benchmarks with pgbench, and this can have up to 20% overhead, unfortunately making it clear that we can not recommend use of pg_store_plans in production today, for use with databases outside of Aurora.
But not all is lost: We’ve prototyped an alternate approach that builds a hash of the plan tree to calculate the planid, similar to how Postgres calculates the queryid, and in our testing this reduces the overhead to near zero.
We still have more work to do before this prototype is ready for use in practice or community discussion, but we're confident we can deliver a better solution here in the near future. And one that will fully integrate with pganalyze, so you can have aggregate per-plan statistics wherever your Postgres database runs.
Getting Started
If you’re a current pganalyze customer on the Scale or Enterprise Cloud plans using Amazon Aurora PostgreSQL version 14.10, 15.5, or higher, this new feature is already enabled in your account. To take advantage of this new information in your Aurora databases, you need to:
- Enable the
aurora_compute_plan_idparameter in your parameter group settings. This enables the feature in Aurora. - Update your pganalyze collector to v0.62.0 or greater
Once both of these actions are completed, you can start exploring enhanced execution features in right away. pganalyze customers on Enterprise Server can expect these features in the next major release.
If you're new to pganalyze, now is a great time to try it and take advantage of these enhanced insights to optimize your PostgreSQL performance on Amazon Aurora. Visit our Getting Started Guide and sign up for a free trial today.


