
Customer Story: How CounterPath accelerates their Postgres queries up to 1000x using pganalyze
Download as PDFCounterPath Corporation (NASDAQ: CPAH) is revolutionizing how people communicate in today’s modern mobile workforce. Its award-winning Bria solutions for desktop and mobile devices enable organizations to leverage their existing PBX and hosted voice call servers to extend seamless and secure unified communications and collaboration services to users regardless of their location and network.
The company’s technology meets the unique requirements of a variety of industries, including service provider, contact center, retail, warehousing, hospitality, and healthcare verticals. CounterPath solutions are deployed worldwide by 8x8, Airbnb, AmeriSave, Aspect, BT, Citibank, Comcast, Fusion, Fuze, Honeywell, Liberty Global, Uber, Windstream, and others.
CounterPath solutions are built on open-source technologies, using PostgreSQL as a system of record for multiple core server products. Typically, applications are written in Java or C++ and access either the primary database, or run as a dedicated service that receives replicated data using the pglogical Postgres extension.
How CounterPath uses pganalyze for Postgres Monitoring
CounterPath is using pganalyze successfully to improve database performance, benefiting from, amongst other things:
- Deep insights into Postgres that help surface important and urgent issues
- Query analysis and missing index checks
- pganalyze EXPLAIN Insights to learn how the database is actually executing queries and to see what’s slow and what’s fast
- Built-in pganalyze recommendations to optimize slow queries

Postgres at CounterPath
The application team at CounterPath works with Postgres databases every day. They are a core component for the company’s Stretto™ Platform, which provides services for Bria Solo, Bria Teams, and Bria Enterprise, as well as custom developed solutions.
Let’s take a closer look:
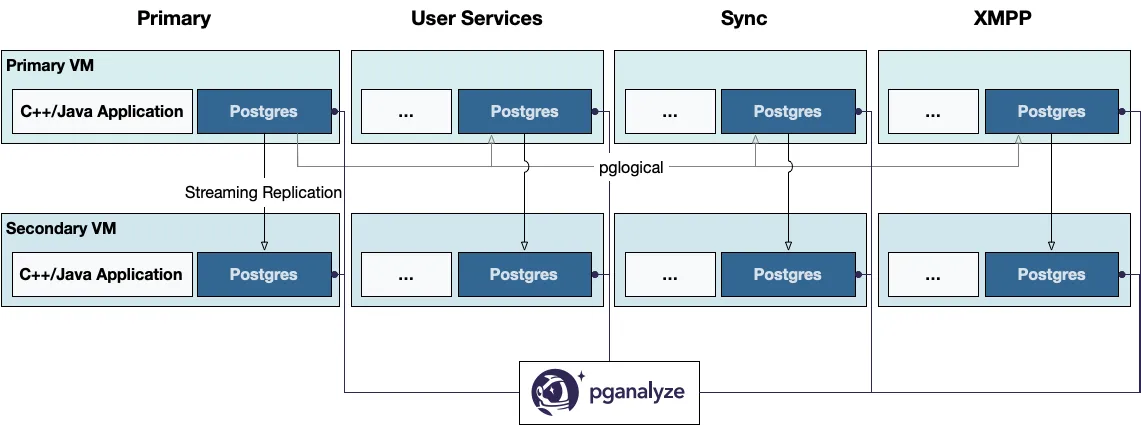
Postgres is the main persistent datastore, and in addition Redis is being used as a communication channel between different services. The overall architecture is still quite traditional, primarily built on virtual machines. Currently, databases and services live together on the VM, as opposed to being separated out like in a Microservices model. All the lightweight services, such as provisioning, admin, etc. run by themselves. All the information data goes into a primary database and pglogical is used to replicate the data into specialized services.
After initially building on a proprietary in-memory database, CounterPath switched to Postgres many years ago, having first used PostgreSQL 8.4, and currently running their systems on Postgres 11.
The heavy use of Postgres at CounterPath doesn’t come without its challenges. Scaling out Postgres and achieving predictable query performance has been difficult for the team. When the team encountered database issues, they had to manually log in to the database and look at the Postgres statistics tables, or use JMX (for their Java applications) to see which functions and associated SQL queries were taking a long time to run.
Deep insights and recommendations on database performance optimization
Before switching to pganalyze, detailed query statistics and meaningful insights into the database were often not available. In order to get actionable information on database performance, Jim O’Brien (VP Server Engineering, Operations and IT) and his team had to manually look into the database logs to see information about slow queries. There was built-in friction that made answering questions like "Why is this customer having a slow experience? Is our database having issues?" harder than it needed to be.
Today, CounterPath developers are looking at pganalyze multiple times per week to get a prioritized view of what they should be working on next, and what could be improved upon.
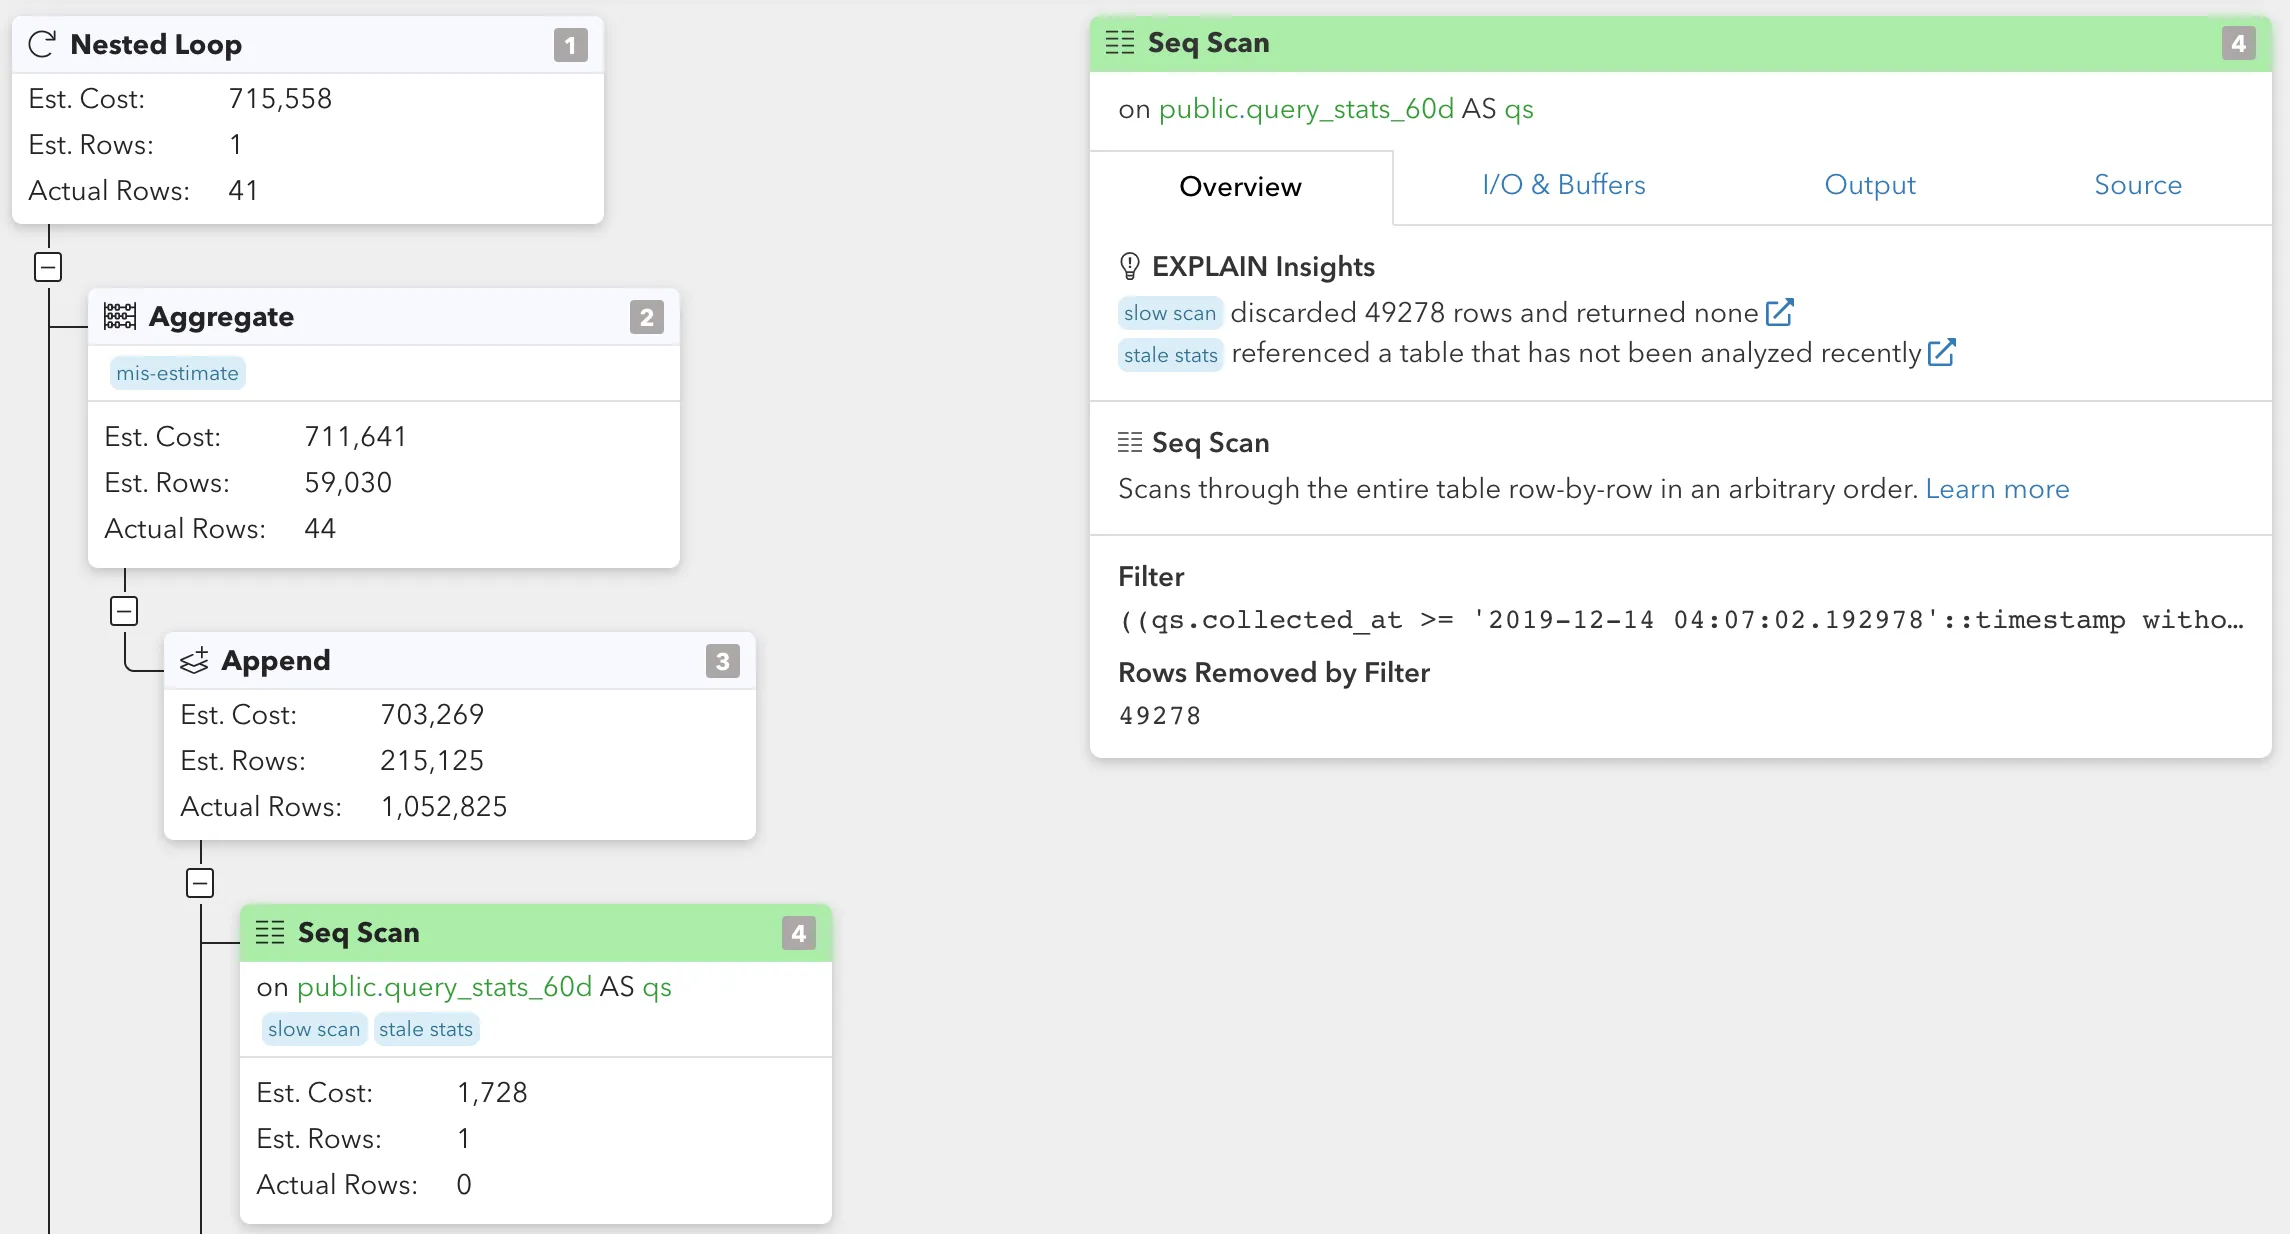
The team is also actively looking at EXPLAIN plans via pganalyze EXPLAIN insights to see how the database is actually executing a query. This lets them identify what parts of a query could be optimized.
Proactive database analysis leading to better customer experience
With pganalyze, the CounterPath team can be proactive and doesn’t have to rely on customer feedback to discover database issues. As described by Jim in his role as manager and team lead:
"It is great that we now can be proactive as opposed to reactive when working on improvements. We are not just using pganalyze to get insights on user load, but also for doing QA. For example, by performing activities like doing a large-scale load test against the sync server to see what pganalyze can tell us about it."
Jamie adds, "We use pganalyze frequently to identify problem areas to work on in our database setup. It’s instrumental to see how often each query is called, not just which queries are slow."

The impact of pganalyze
1) Reduced database CPU utilization by 16x
Jamie Strachan (Development Team Lead) remembers a specific improvement that pganalyze helped his team make.
"We were excited when we started to use pganalyze and saw all the insights it could give us. pganalyze empowers us to understand how we can improve Postgres performance. After setting up pganalyze, we optimized the sync server for our Bria Solo product and improved some queries by orders of magnitude. We had a query that was filtering only by account_id, but the existing index was (user_id, account_id), so we were constantly doing sequential scans over all accounts.
Adding a temporary index on account_id (until we could patch the code to add the user_id to the query) caused the CPU to drop instantly from 400% down to 25%."
2) Reduced database startup time by 4x
Jamie also recalls another big win for CounterPath was reducing database startup times: "Some of our systems took 10 or even 20 minutes to replicate. But thanks to changing our shared_buffers setup, and a few other changes, we improved performance 4x. This has had a real benefit to us as it speeds up maintenance tremendously."
3) Optimized Postgres Query Performance by up to 1000x
When asked for further examples, Jamie mentioned that one particular query his team had took over 1 second to run, which is now taking 1/10th of a millisecond to run.
"We were running this query 100s of times a minute. After getting insights from pganalyze we optimized the query and improved it 1000x. With pganalyze, we can push query improvements regularly with every new patch release. Today, we are running pganalyze on basically every service we have."
Conclusion
With the help of pganalyze, CounterPath receives detailed query statistics and meaningful insights into their database, can be proactive as opposed to reactive on managing their customers' experiences, and can catch potential issues before they become real problems. Thanks to the detailed analytics and the built-in recommendations, CounterPath engineers are working more efficiently.