
AWS Performance Insights has been deprecated: What to know about CloudWatch Database Insights
 By Lukas Fittl
Editor’s note (May 2026): AWS has extended the Performance Insights deprecation date to June 30, 2026, from the originally announced November 30, 2025. The post below has been updated to reflect the new timeline; the functionality and pricing comparisons remain accurate.
AWS is deprecating the built-in performance monitoring tool in Amazon RDS and Aurora, Performance Insights, on June 30, 2026. AWS customers are asked to migrate to the new Database Insights functionality in CloudWatch before that date, with AWS noting:
If you take no action, DB instances using Performance Insights will default to using the Standard mode of Database Insights. With Standard mode of Database Insights, you might lose access to performance data history beyond 7 days and might not be able to use execution plans and on-demand analysis features in the Amazon RDS console. After June 30, 2026 only the Advanced mode of Database Insights will support execution plans and on-demand analysis.
Since we have many customers using built-in AWS tools together with pganalyze, we’ve heard many questions on what this migration is about, and how the functionality between the two AWS tools differs. In this blog post we’re going to explore key functionality differences, the difference between Standard and Advanced Mode in Database Insights, and hidden cost drivers in CloudWatch Logs that are important to know about when migrating.
Whilst pganalyze can supplement or replace AWS CloudWatch Database Insights, in this post we’re fully focused on comparing the tools offered by AWS. If you want to know how pganalyze compares for your organization’s use cases, reach out to us for a demo.
The essence of Performance Insights: Active Session History
One of the key benefits of AWS Performance Insights was its ability to capture wait events and active query information using sampling. For Postgres specifically, this mainly utilizes information from pg_stat_activity, which we can also query directly like this:
SELECT COUNT(*), state, wait_event_type, wait_event FROM pg_stat_activity WHERE state <> 'idle' GROUP BY 2,3,4;
 count | state  | wait_event_type | wait_event
-------+--------+-----------------+-------------
     8 | active | Client          | ClientRead
     1 | active | Client          | ClientWrite
     2 | active |                 |
Performance Insights let us visualize this information over time, making it easy to understand where internal performance bottlenecks occur:
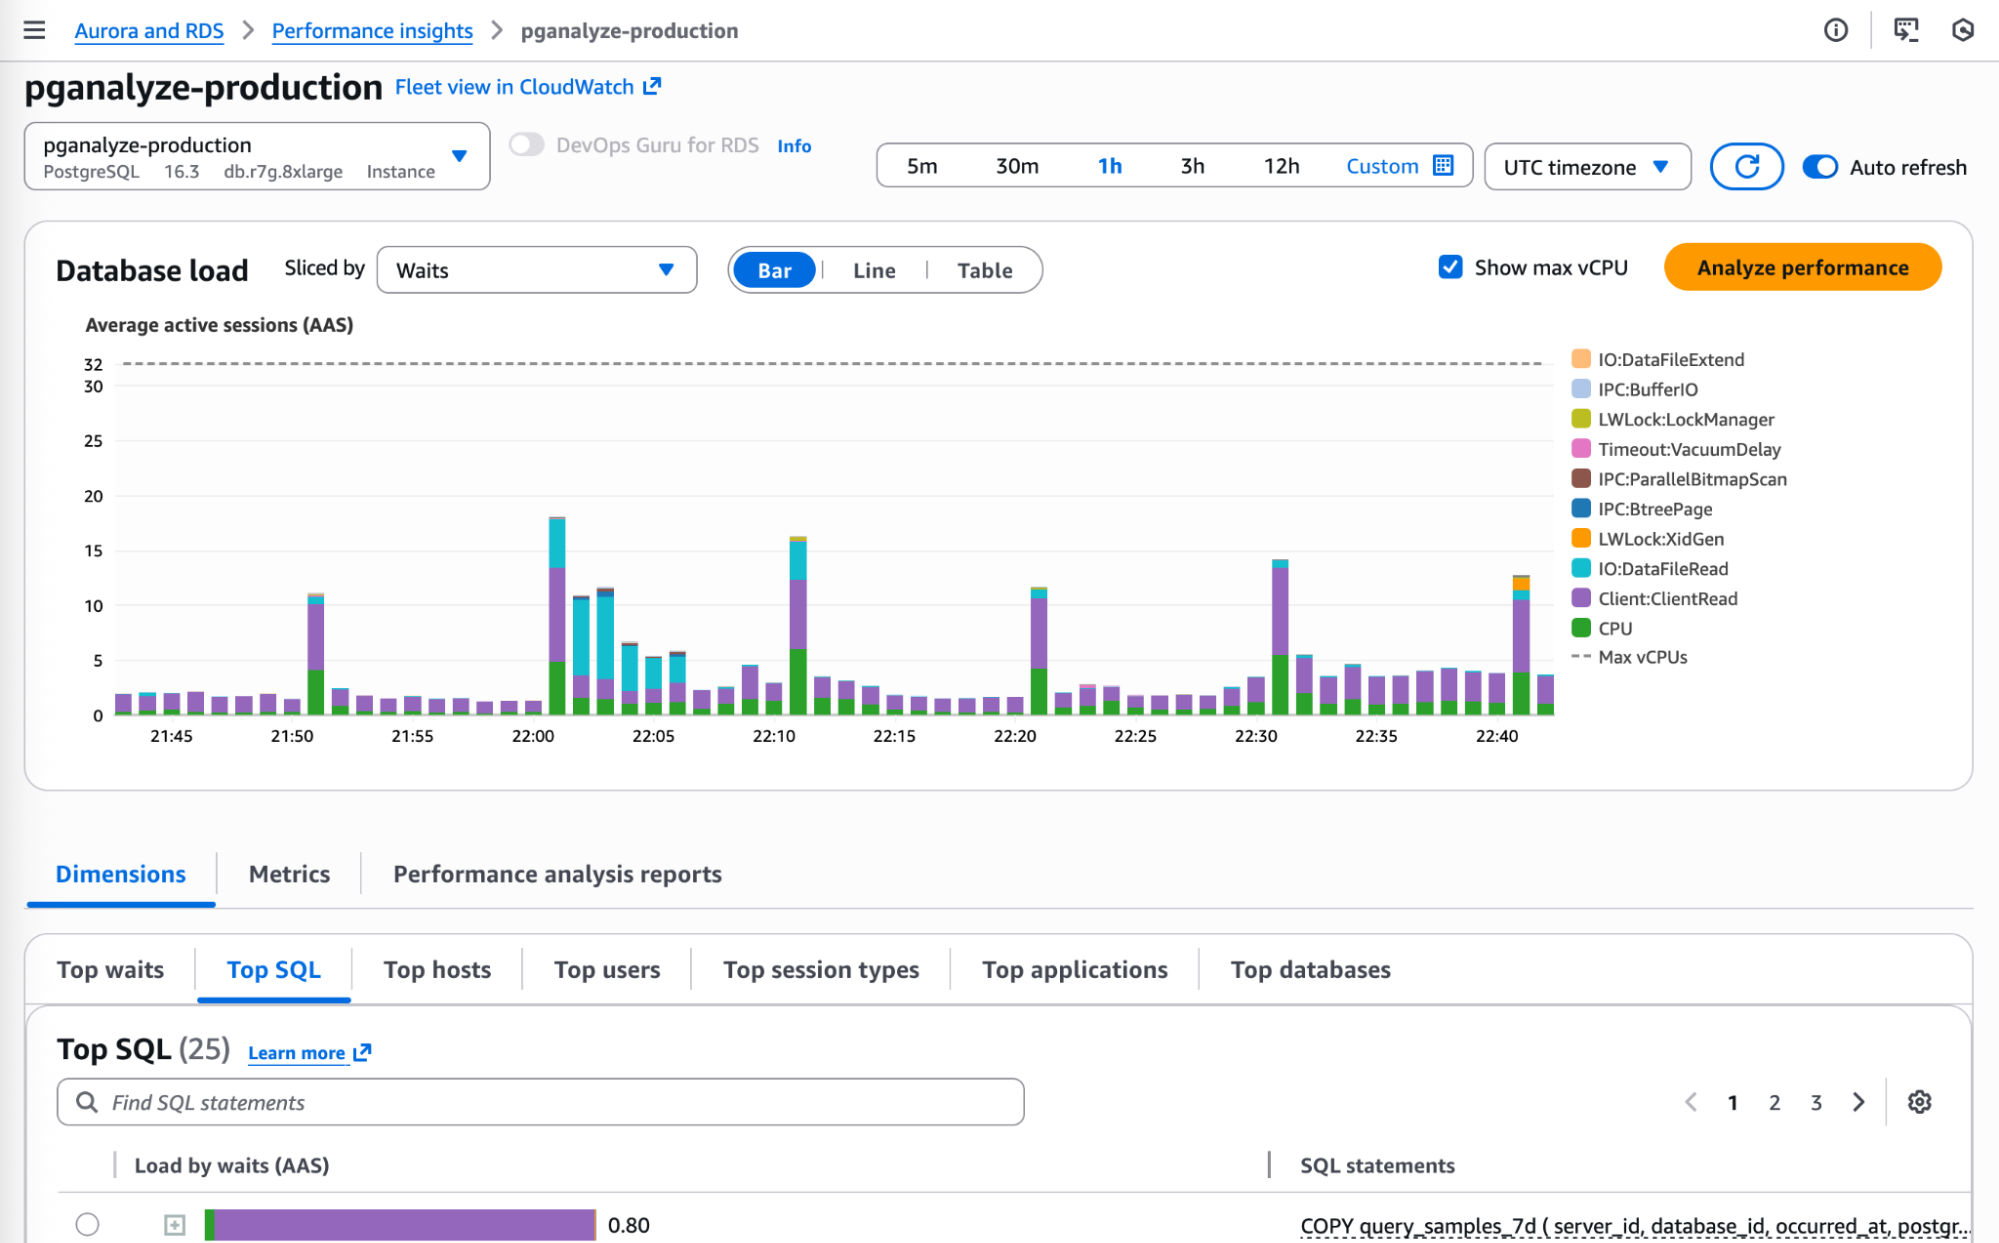
To many Oracle DBAs, this visualization is familiar, as Oracle Enterprise Manager has offered an Active Session History feature for decades - and it’s likely that this also inspired the initial design of Performance Insights.
CloudWatch Database Insights retains this functionality in both of its product variants (Standard and Advanced mode), pretty much without any changes:
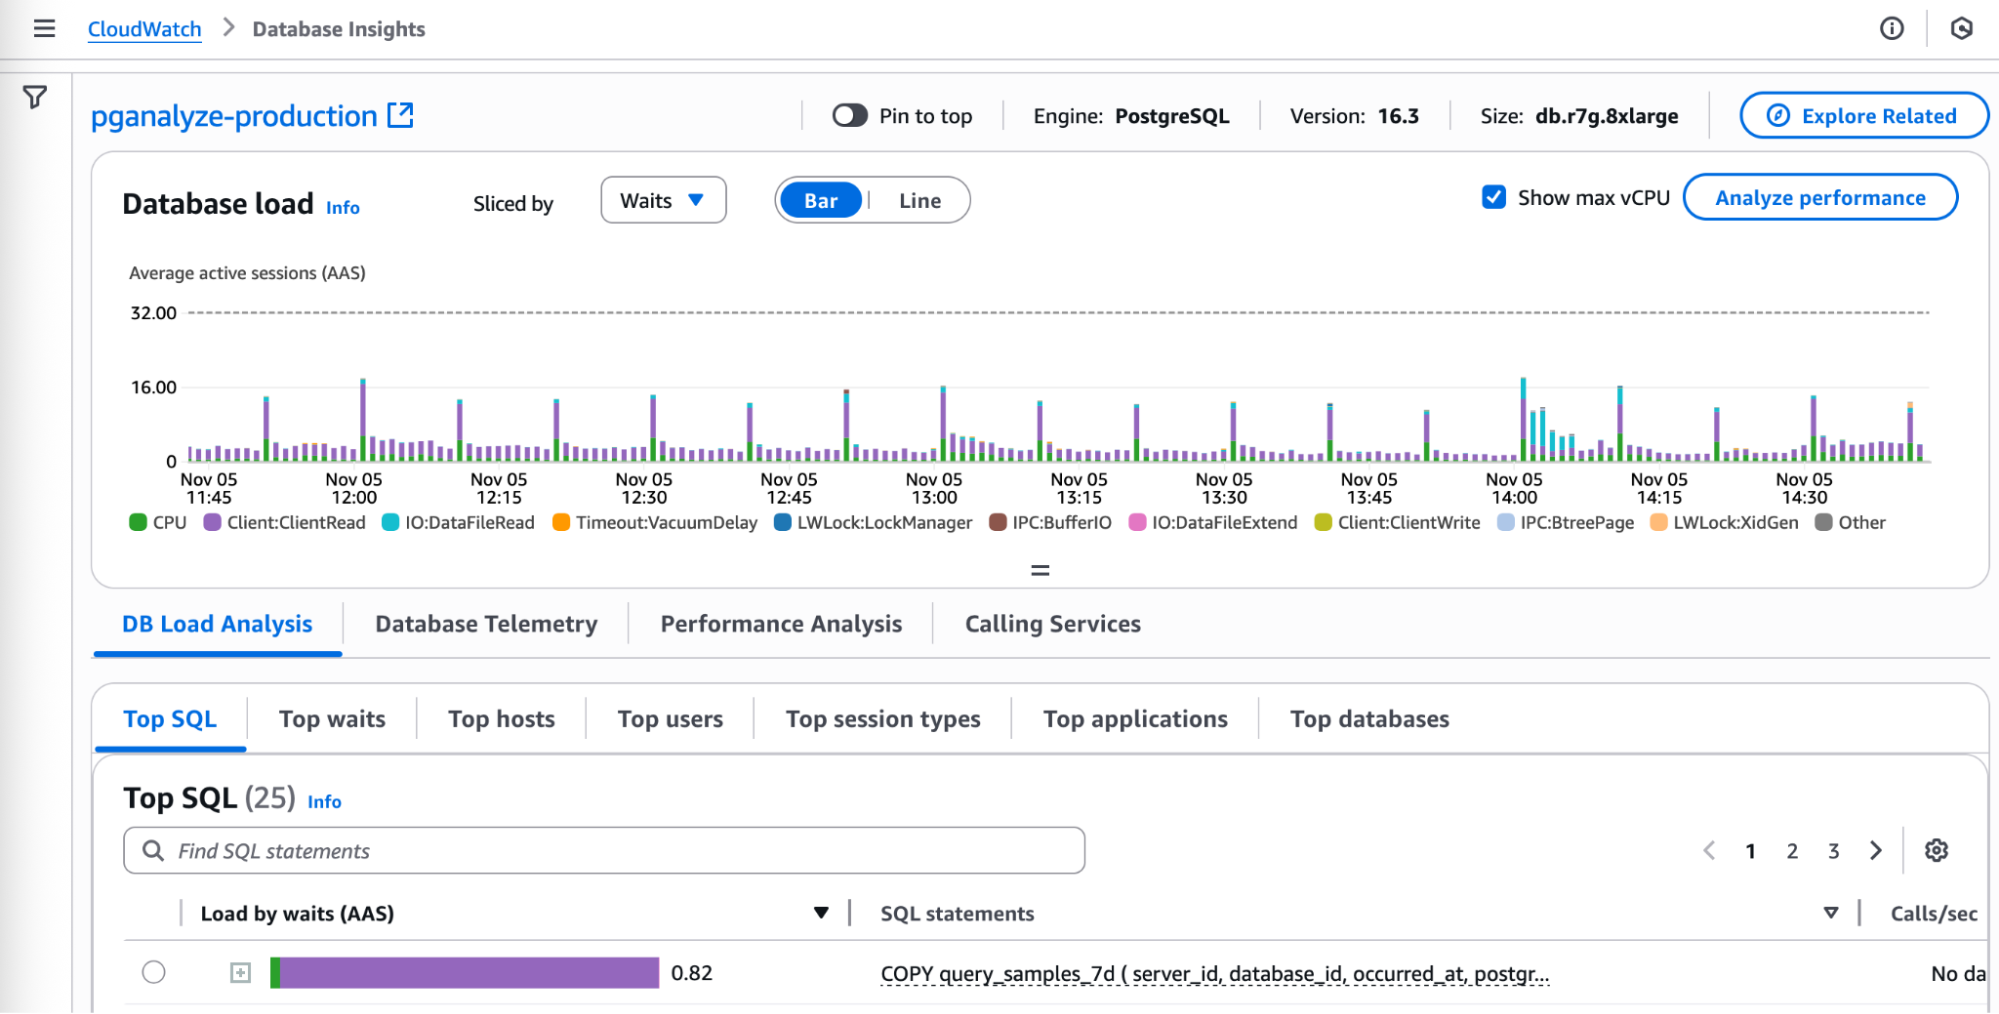
Existing limitations, such as limited query text being visible (up to the track_activity_query_size), or only showing the Top 25 queries in a given timeframe, appeared to persist in Database Insights in our testing.
Whilst Postgres makes full query text available through pg_stat_statements (as is used in pganalyze), it does not appear that AWS is making use of that at this point.
Plan Statistics now Requires Advanced Mode
Performance Insights recently gained the ability to capture query plans for certain databases (SQL Server and Oracle), with support for Aurora PostgreSQL in preview (using aurora_stat_plans).
Database Insights Advanced Mode offers the same functionality that can record query plan statistics, and officially makes this available for Aurora PostgreSQL:
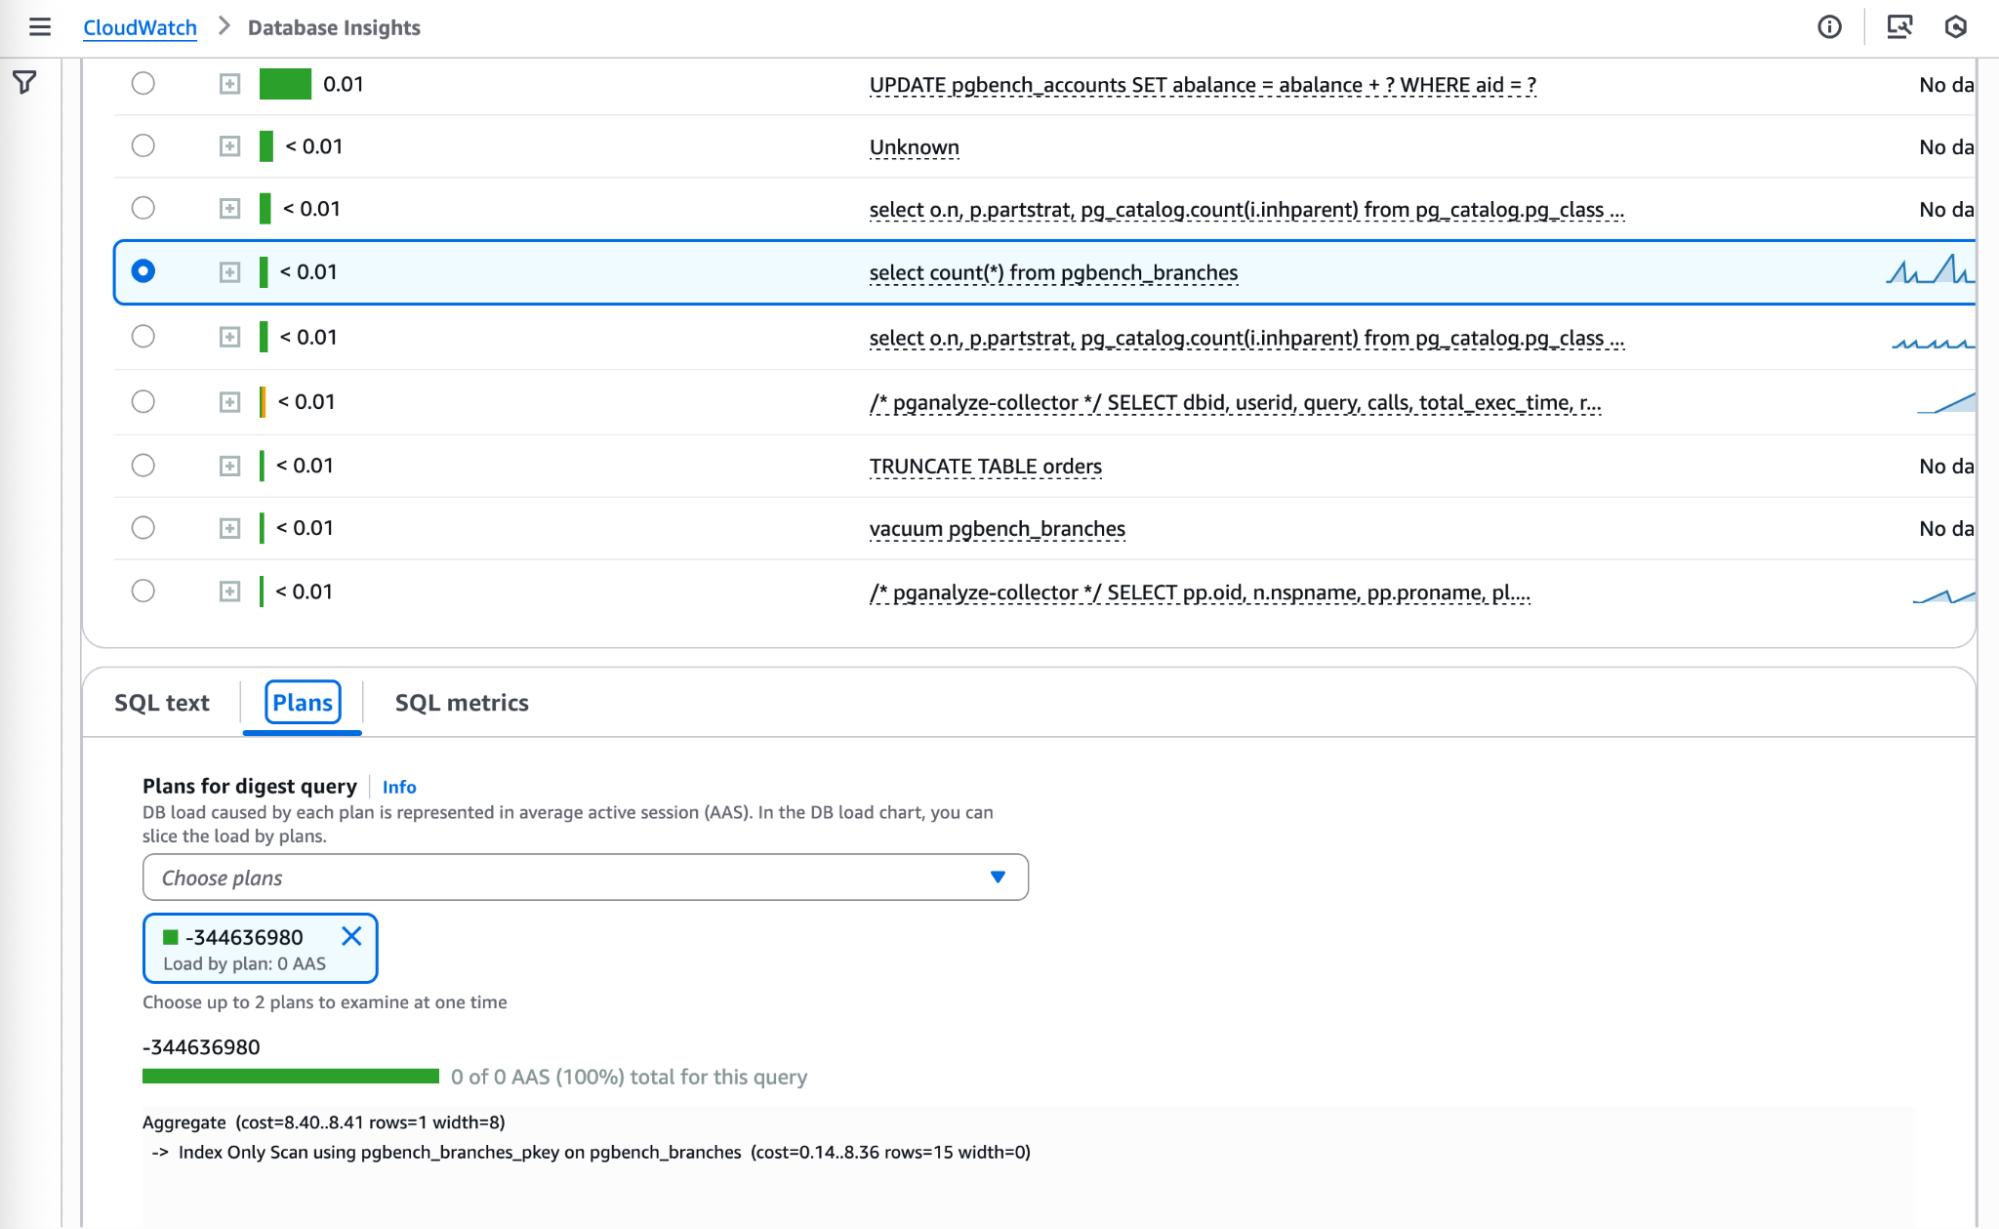
This support is no longer available on the free offering (Database Insights Standard Mode), as it was previously on Performance Insights.
New: Fleet-wide overview
One of the new functionalities introduced by Database Insights is the all-up view of database instances across an AWS account. This is only supported for instances configured with the paid tier (Advanced Mode), and has two key functionalities. It can surface instances that have an active CloudWatch alarm firing, and highlight them in red in a hexagon-based visualization:
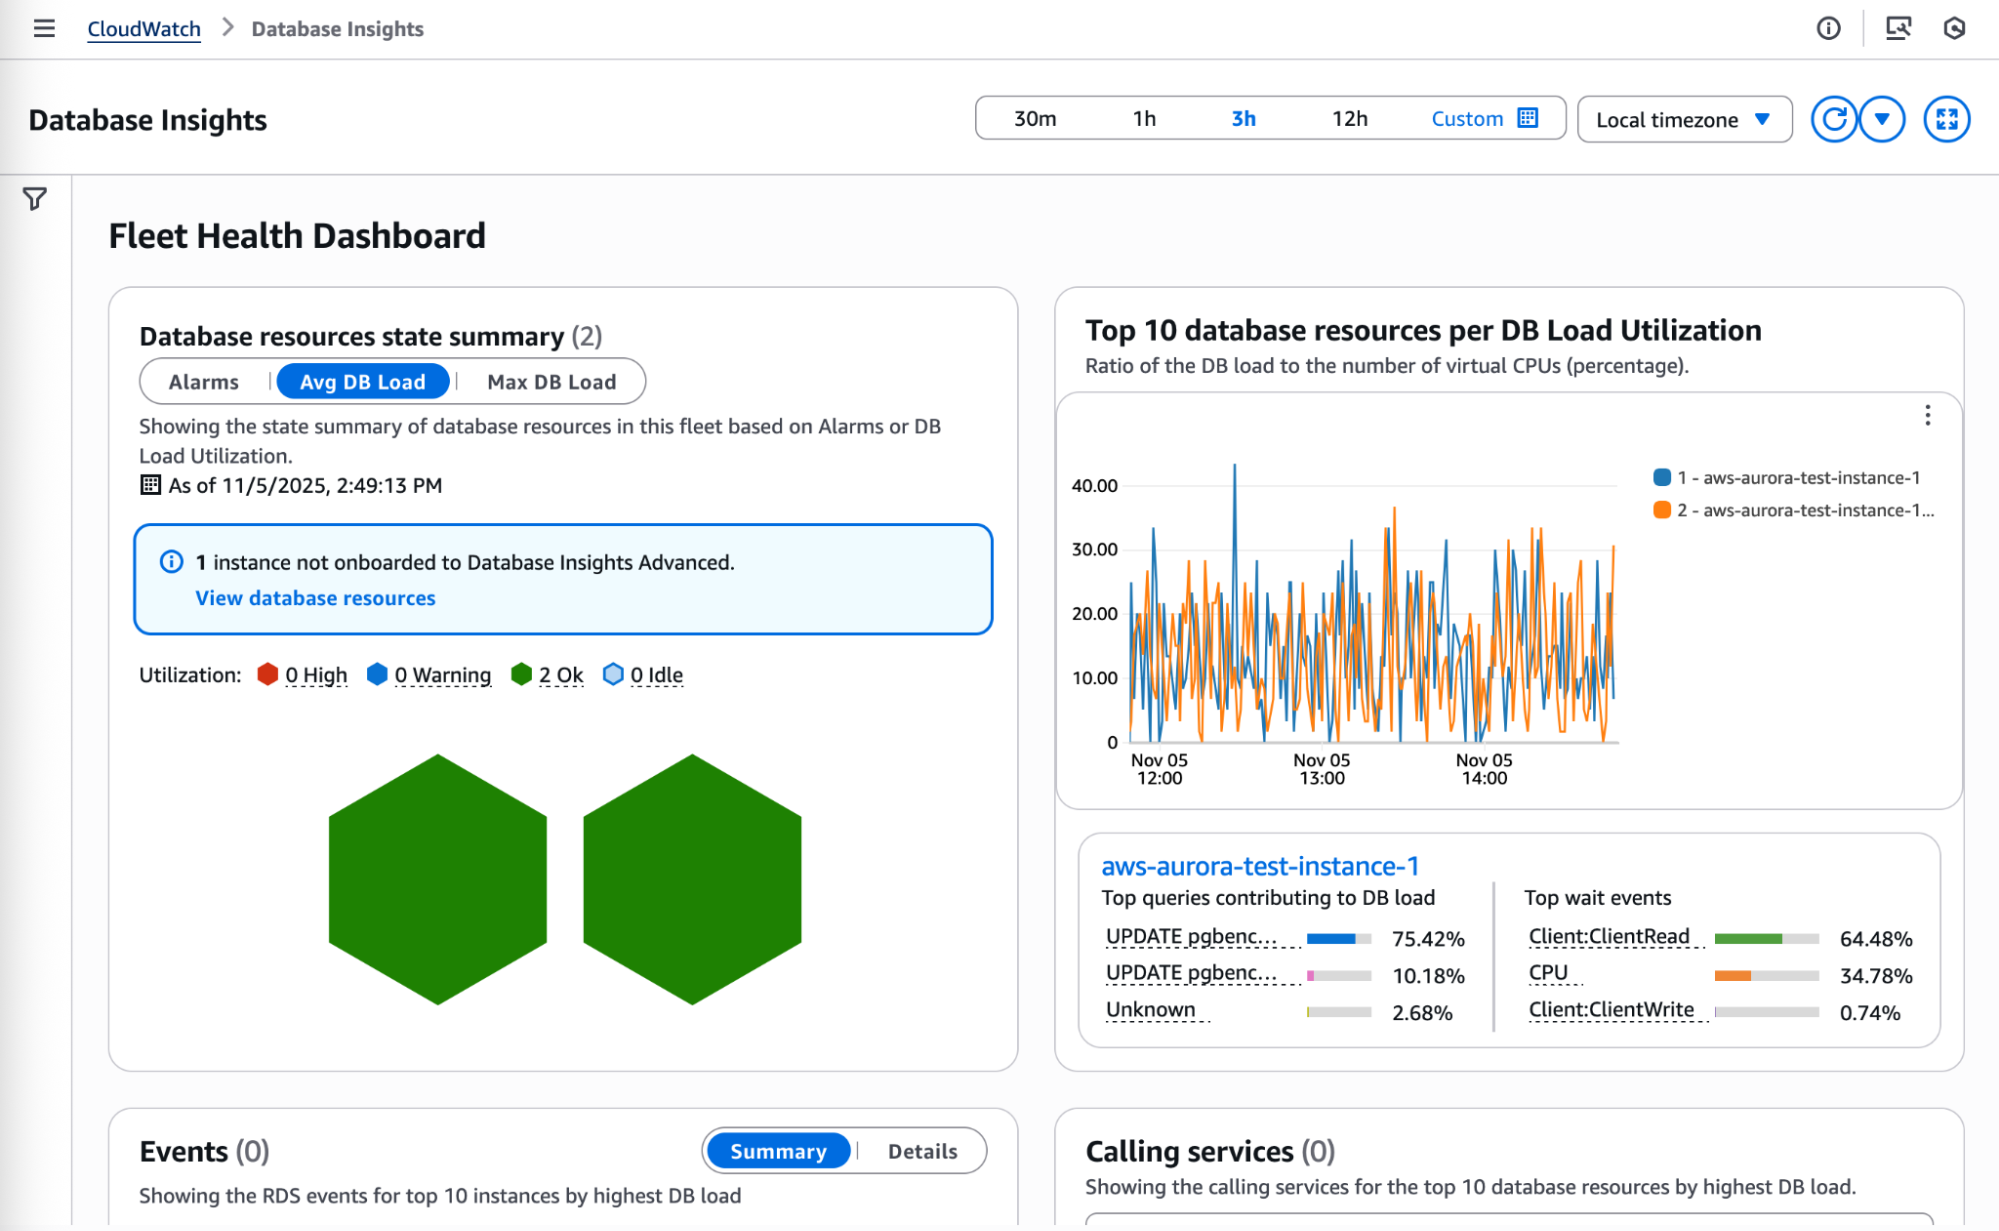
Additionally, the fleet view also surfaces top activity across all instances, like instances consuming most CPU, and top queries across all instances.
Detailed analysis still requires drilling down to individual instances, but the new fleet view makes it easier to surface the Top 10 instances or active alerts firing.
New: Log Viewer and Slow Query Log
With CloudWatch Log exports enabled, Database Insights can also surface data previously available in the Logs view:
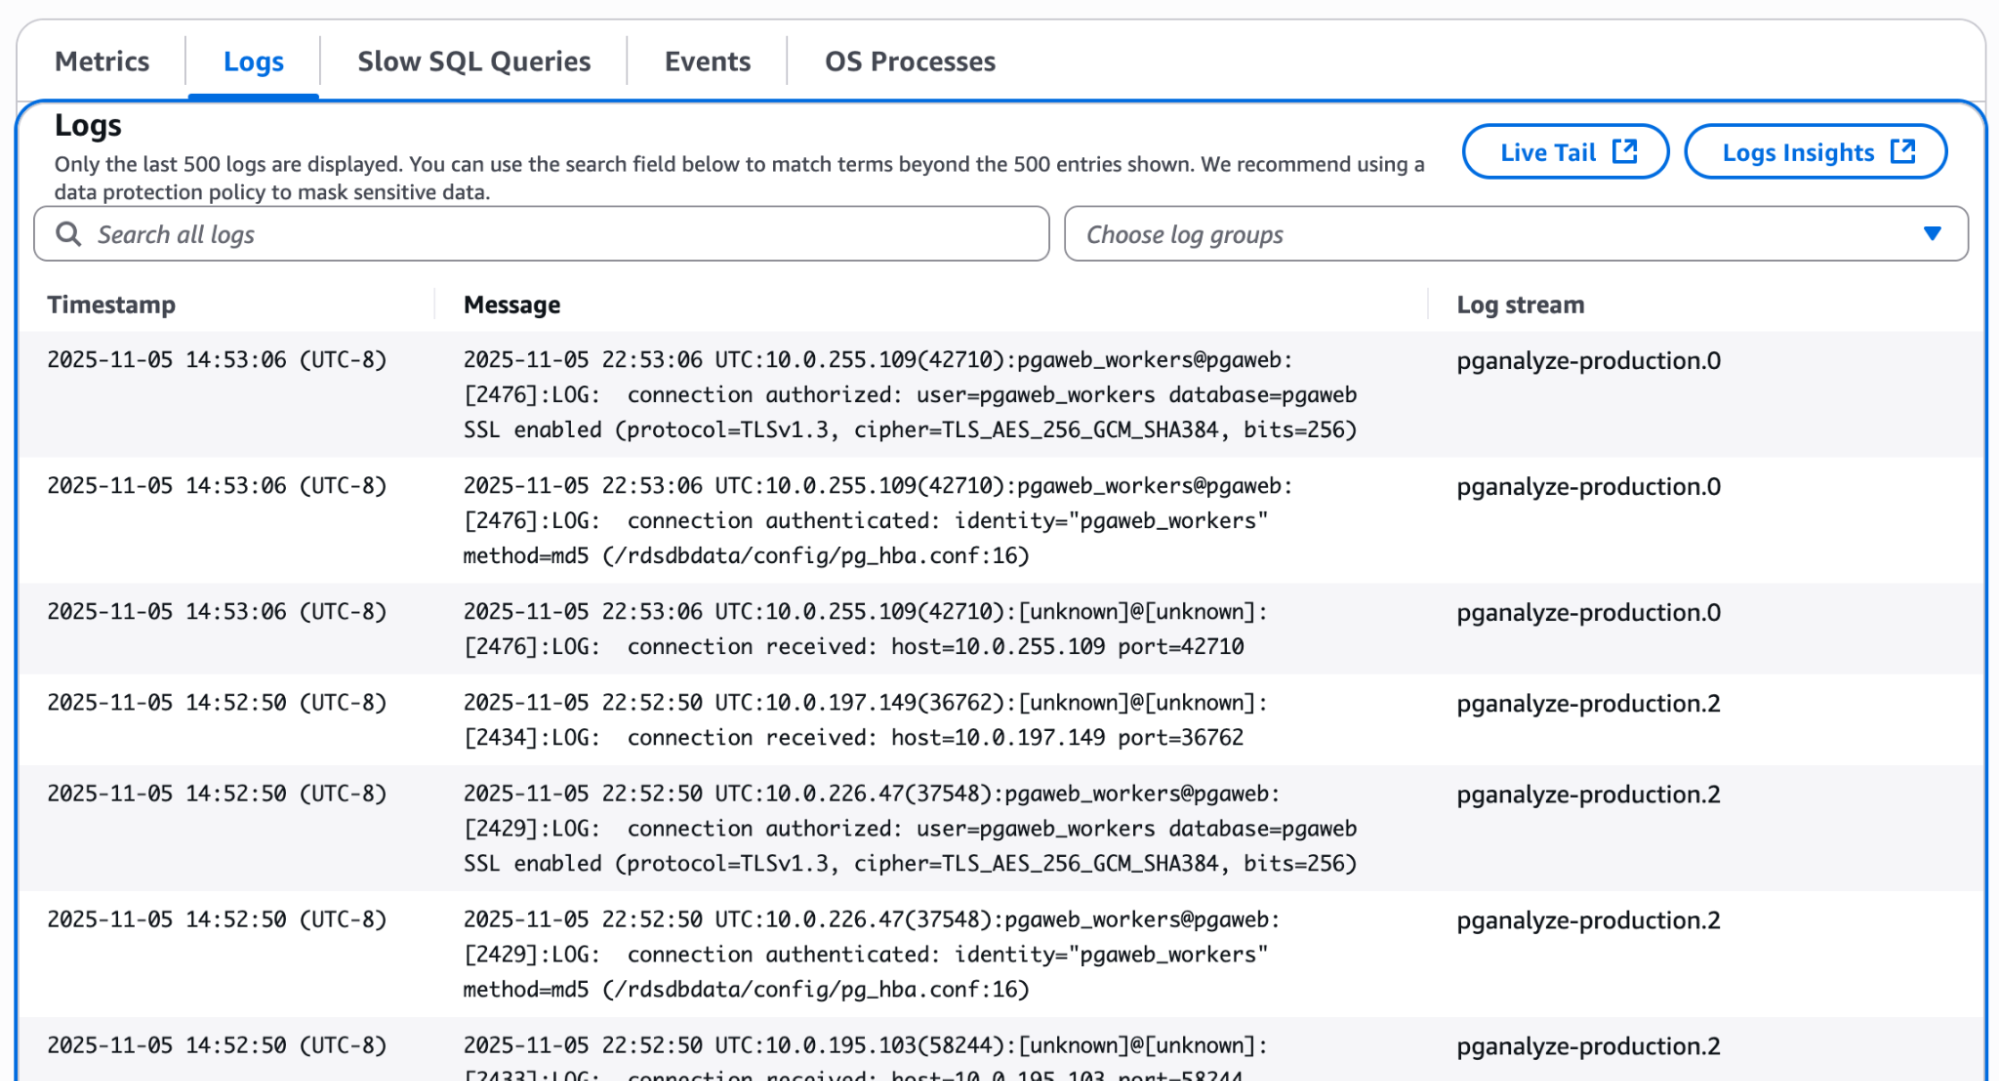
This functionality is similar to the built-in log viewer in other platforms like Google CloudSQL, but requires using the separately charged CloudWatch log export functionality. The existing log view/downloads in the Aurora/RDS console remain available and free of charge.
Additionally, this view can pull out only slow query log events:
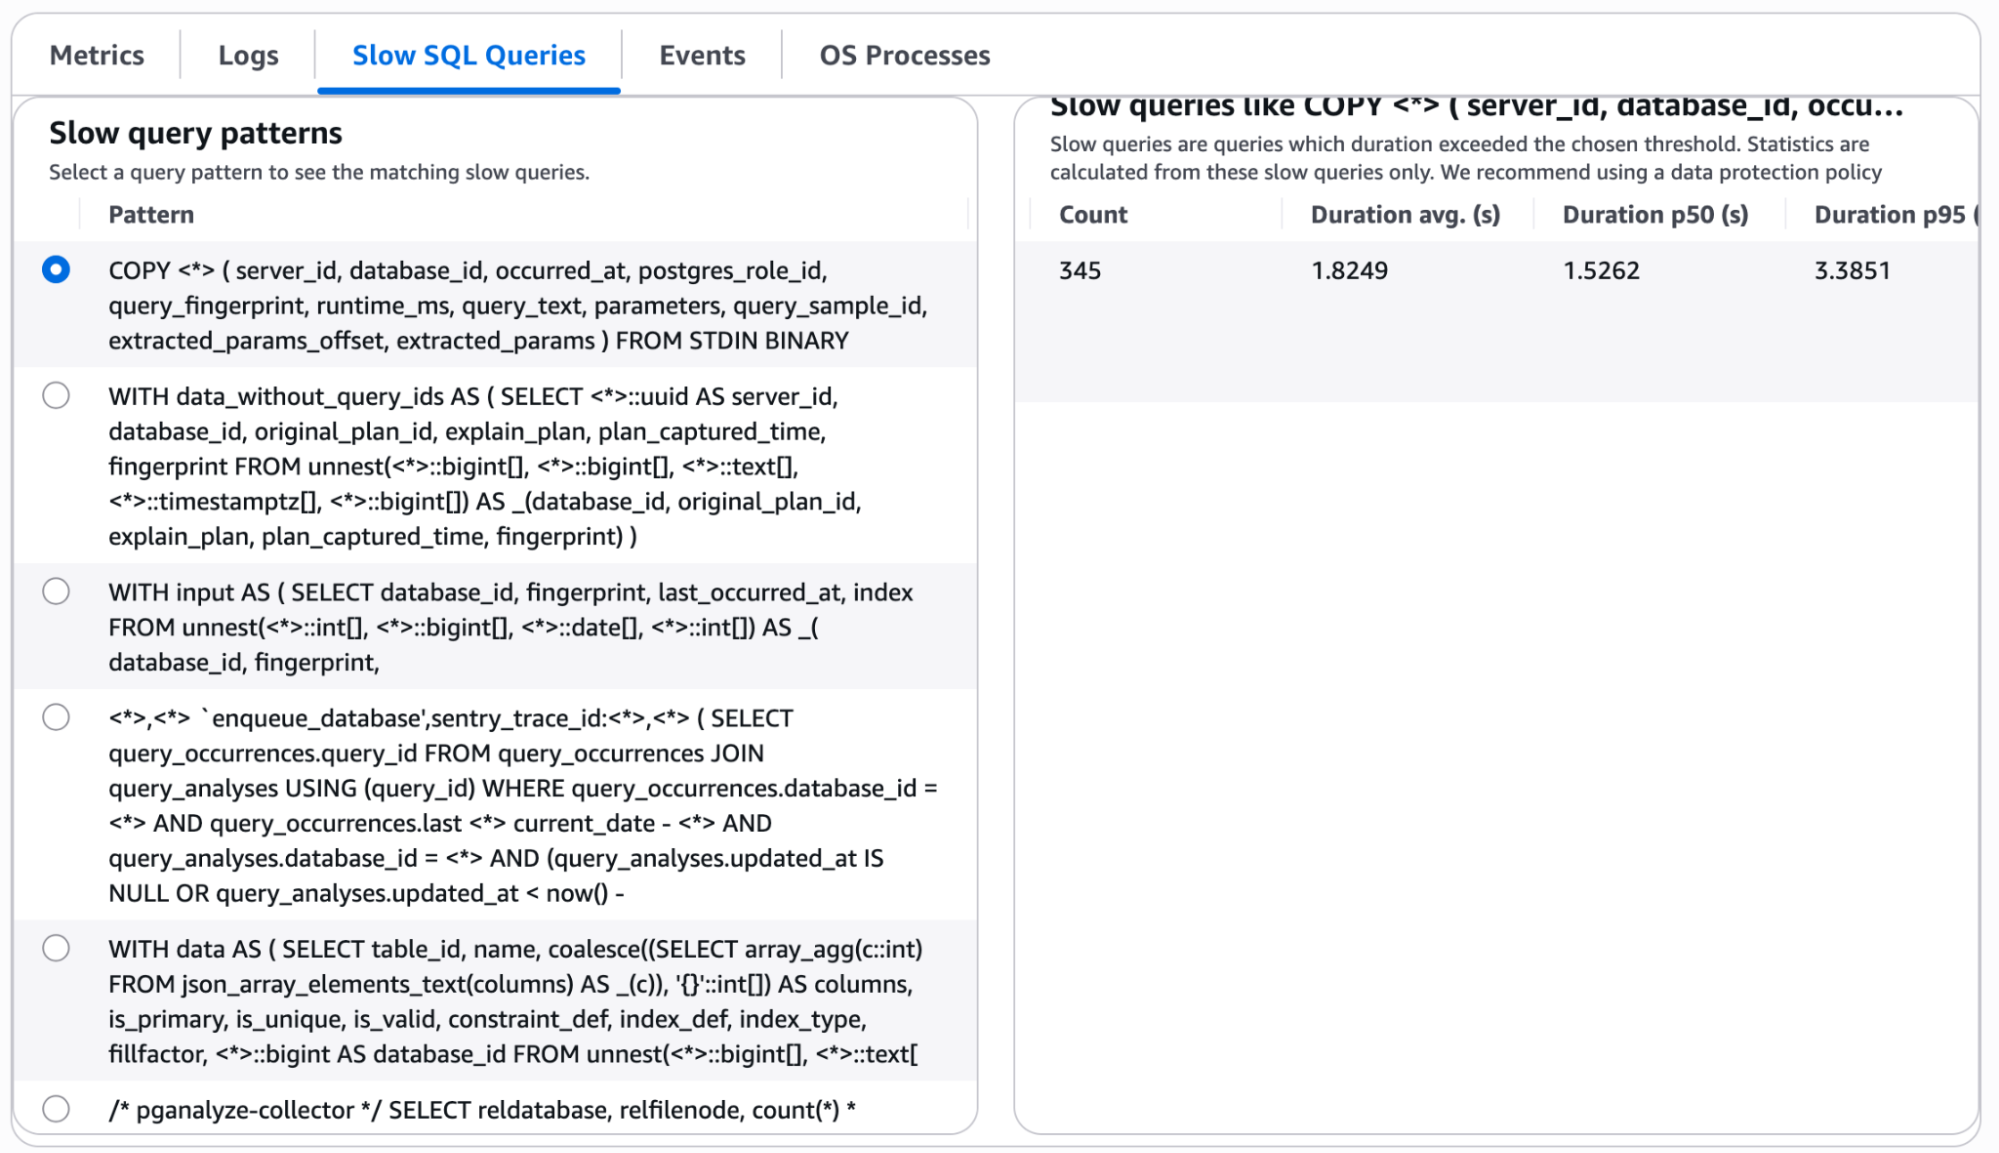
From our testing there was no way to access sample parameters in the slow query log, or see other log events like EXPLAIN plan samples extracted from auto_explain data.
Feature Comparison
| Performance Insights | Database Insights (Standard) | Database Insights (Advanced) | |
|---|---|---|---|
| Wait Event Analysis for Last 7 days | Yes | Yes | Yes |
| Retention Time | Customizable (up to 24 months) | 7 days (not customizable) | 15 months |
| Operating System Metrics (RDS Enhanced Monitoring) | Yes | No | Yes |
| Fleet Management View | No | No | Yes |
| Lock Analysis | No | No | Yes (Aurora Postgres only) |
| Query Plan Statistics | Yes (Aurora Postgres / Oracle / SQL Server) | No | Yes (Aurora Postgres / Oracle / SQL Server) |
| Per-Query Statistics | No | No | Yes |
| Slow Query Log | No | No | Yes (requires CloudWatch Log Export) |
| Performance Metrics Export to CloudWatch | Yes | No | Yes |
| Analysis of specific time periods | No | No | Yes |
Pricing differences
The most drastic change in CloudWatch Database Insights are the charges for using Advanced Mode. The fee for enabling Advanced Mode are based on the instance size (number of vCPUs), and scales up with more vCPUs, quickly going beyond $100/month/instance on large production databases, as shown here for us-east-1:
| Instance Size (vCPUs) | Monthly Charge for Database Insights (per instance) |
|---|---|
| 2 vCPU | $18.25 per month |
| 4 vCPU | $36.50 per month |
| 8 vCPU | $73.00 per month |
| 16 vCPU | $146.00 per month |
| 32 vCPU | $292.00 per month |
| 64 vCPU | $584.00 per month |
At pganalyze we use Amazon RDS as well, and have enabled Database Insights Advanced Mode for testing. But the pricing here surprised us:
For one of our main production databases (db.r7g.8xlarge), enabling Database Insights Advanced and CloudWatch Logs exports resulted in monthly charges of $490 per month, $292 for just for Database Insights itself for one instance. To contrast, getting similar functionality (and more) with pganalyze is $100/mo per instance, and pganalyze log analysis does not require CloudWatch Logs.
In conclusion
Whilst CloudWatch Database Insights does not offer the full functionality of dedicated database monitoring products, it’s encouraging to see AWS launch a database-specific monitoring tool and retain a (limited) free mode. In our testing we did not observe any noticeable changes in user experience, so for users coming from Performance Insights the new Database Insights views should function pretty much the same.
From conversations our team had over the last months with customers impacted by these changes, it remains to be seen whether the pricing model of the Advanced Mode is accepted by AWS customers.
If you’re interested in evaluating pganalyze, which is purpose-built for PostgreSQL monitoring and optimization, don’t hesitate to reach out - we’d be happy to give you a demo and help you assess the best path forward.
You can also view the pganalyze Product Tour on your own time.