


Building SVG Components in React
 By Maciek Sakrejda
React is well known as a great tool for building complex applications from HTML and CSS, but that same approach can also be used with SVG to build sophisticated custom UI elements.
In this article, we’ll give a brief overview of SVG, when to use it (and when not to), and how to use it effectively in a React application. We’ll also briefly touch on how to integrate with d3 (which comes in very useful when working with SVG).
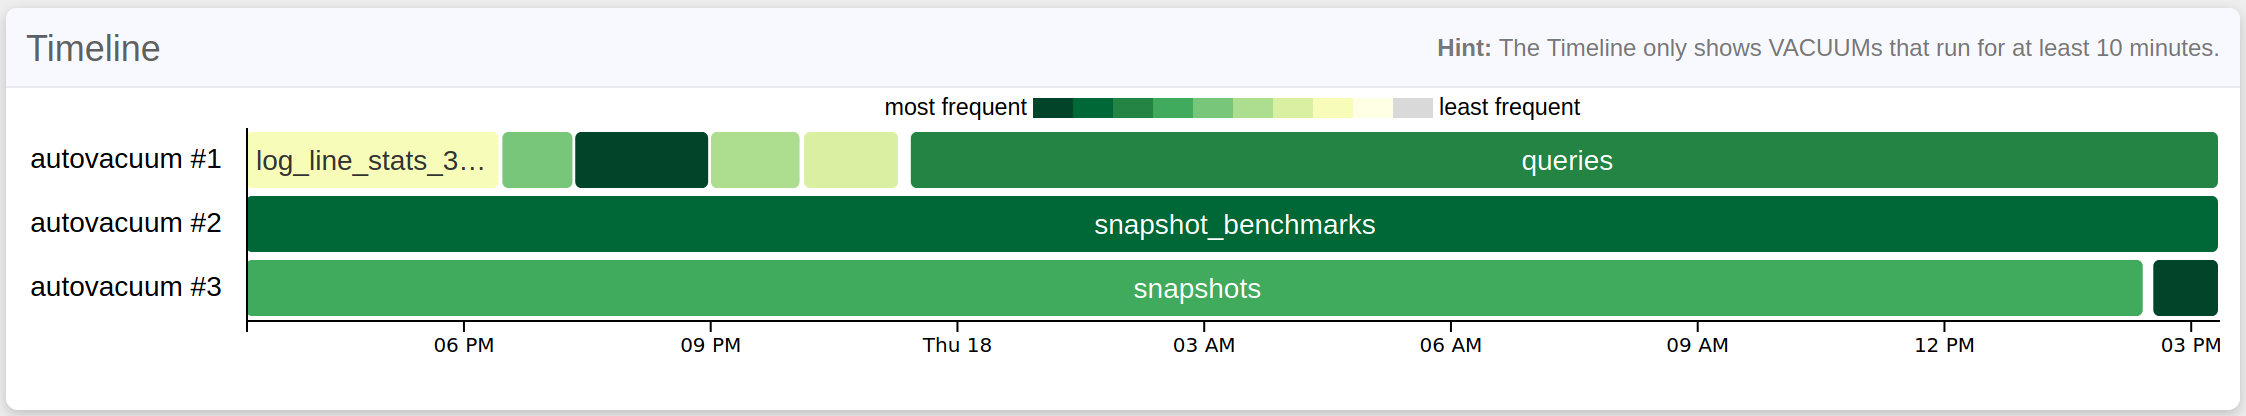
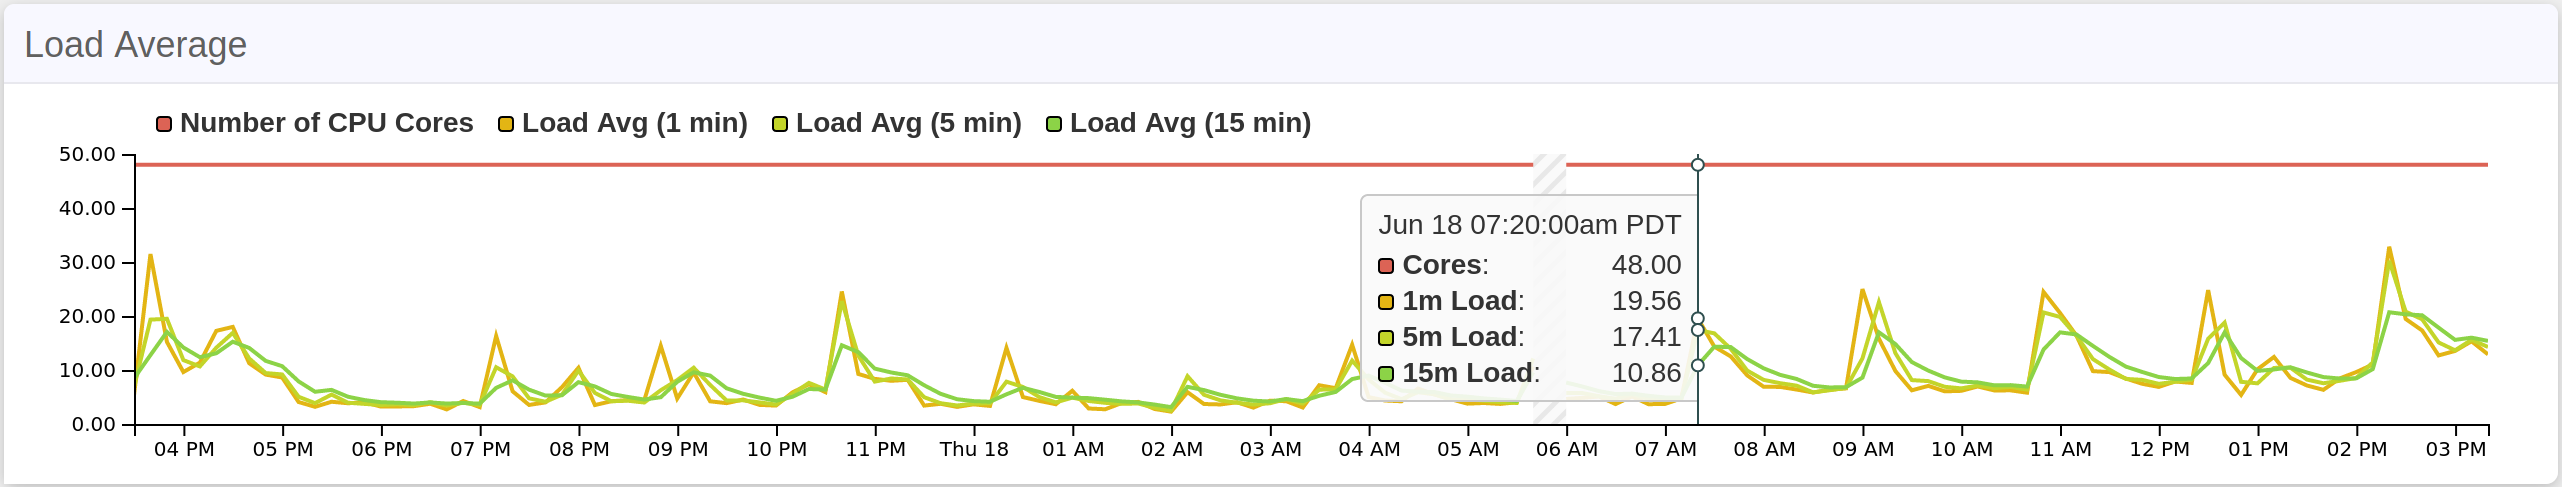
We relied heavily on SVG to build the charting updates we launched recently in pganalyze (check out my blog post about these if you missed it), and we would like to share how we work with SVG in React. At the end of the post, we link to a simple but functional charting example based on our new charting code. We stripped it down to make it easier to follow, and we think it’s a great introduction to building SVG components in React.
What is SVG?
SVG is an XML-based vector graphics format. It is commonly used for icons and illustrations, but the similarities to HTML make it a great fit to extend your UI. Like HTML, SVG consists of a DOM tree of elements which can be styled with CSS, can be scripted and animated, and can dispatch events on user interaction. SVG is well-supported in modern browsers, including Firefox, Safari, Chrome, and Edge. All of these support embedding SVG directly in HTML, and React supports using SVG elements to build your components.
A thorough overview of SVG is beyond the scope of this post, but let’s review the salient features in the context of building UI components. The actual elements available fall in a few different categories:
- simple lines and shapes, like
rect,circle, andline - more complex lines and shapes, like
polygonandpath(check out Joni Trythall’s post on everything you can do with the path data attribute!) - text, like the simple
text, the fancytextPath(essentiallytextalong an arbitrarypath), and the handytitle(for simple tooltips similar to HTML’stitleattribute) - special elements to combine and manipulate these, like
mask,clipPath, andpattern - other odds and ends, like the familiar anchor (
a) from HTML (with the neat feature that it can conform to whatever shape it is wrapping, and only that part is interactive).
Mozilla’s MDN has a good reference to all the element types available.
The event system is very similar to what you’re already used to in
HTML. Some events are different, but many familiar ones like onClick,
onMouseEnter, onFocus, and onKeyUp are there. Registering event
handlers is the same—svg elements expose onEvent attributes and you
can add your callback there. If you’re using TypeScript, note that
you’ll need to parameterize generic React synthetic event types with
SVGElement or just Element instead of HTMLElement. E.g.:
const handleClick = (e: React.MouseEvent<Element>): void => {
  console.log('clicked', e.currentTarget)
}
When to use SVG
If you think SVG might be a good fit for some section of your UI, there’s a good chance you’re right, but you should consider your options. There are always trade-offs. If you don’t go with SVG, your other likely options in a React app are going to be sticking with HTML, or using Canvas. You can do a lot with some plain divs and CSS, so HTML may be suitable for more than you think. That said, if you feel like your use case is pushing HTML to the breaking point (or at least into a cryptic forest of obscure tags and esoteric styling), maybe it’s not the right fit. Remember Kernighan’s Law:
Everyone knows that debugging is twice as hard as writing a program in the first place. So if you’re as clever as you can be when you write it, how will you ever debug it?”
On the other end of the spectrum there’s Canvas. Its immediate mode paradigm means it can perform much better with huge datasets, but that also makes it awkward to work with in React, and harder to script rich interactivity. SVG (and HTML) have a retained mode model that’s better suited to building UIs.
As a rule of thumb, if it’s reasonable to stick with HTML, stick with HTML. If not, and you expect to work with a modest number of data points (the threshold will vary based on your UX needs and your performance expectations), SVG is a good bet. It will allow you to build these components in a manner similar to building HTML components, and to maintain a consistent look and feel with the rest of your app. Otherwise, consider Canvas or even WebGL.
SVG in React
The mechanics of using SVG elements in React are straightforward: Just
write a standard component and return an SVG tag instead of an HTML
tag. You only need to ensure you’re nesting tags correctly and only
putting SVG elements inside an <svg> tag (just as you should ensure
you’re not putting block-level elements in a <p>). There’s no
special class to extend, no extra options to handle.
Here is a trivial SVG component:
const Greeting = ({name}) => {
  return <text>hello {name}</text>;
}
This uses the SVG <text> element instead of the <span> you might
expect in an HTML component, but as you can see, it’s otherwise
identical to an HTML component. To use this, just wrap it in an
<svg> element:
const Main = () => {
  return (
    <svg>
      <g transform="translate(20,20)">
        <Greeting name="Maciek" />
      </g>
    </svg>
  )
}
(Don’t worry about the <g> element for now; we’ll cover that next.)
Handling Layout in SVG
A big difference between HTML and SVG is layout: In HTML, the normal
layout flow positions elements on the page automatically according to
a set of simple rules. In SVG, it’s up to you to place each
individual element exactly where it’s supposed to go. There is no
built-in positioning mechanism at all, and the order of the tags
really only determines what gets drawn on top of what (like z-index in
HTML; SVG has no explicit z-index.)
The mechanism for this positioning is a coordinate system that’s
standard in computer graphics: The origin is in the upper-left corner,
and positive x and y values move elements to the right and down,
respectively. You can think of it like an HTML document where all
elements are position: absolute, and x and y are top and
left. Here’s an example:
As you can see, the x and y offsets mean slightly different things
for different types of elements. For rect, it’s the upper-left
corner. For circle and ellipse, it’s the center (in fact, circles
and ellipses use cx and cy attributes instead of x and y to
make this clearer). For text, it’s a reference point, and the text’s
placement relative to that point is configurable via attributes like
dominant-baseline
and
text-anchor
(by default, the text starts at the x position, with the baseline at
the y position.)
At first blush, this seems like it would make any non-trivial SVG component a nightmare to put together, but we can use some SVG features and some conventions to help us build complex modular components that work well together.
Let’s assume we’re working with a certain explicit width and
height for our component. This can get tricky if you need your
component to be responsive, but we’ll hand-wave around it for now; we
discuss that in more detail below.
In general, we’ve found a good approach for SVG components is to have
parents size and position their children by subdividing the parent’s
own width and height. Parents determine each child’s desired width
and height and pass those as props. We could also pass x and y
to have children position themselves, but SVG provides a handy element
that simplifies this: the group (<g>). As its name suggests, the
element is a way to apply a set of properties to a group of children.
Most relevant for us is the transform attribute, specifically its
translate
value. This lets us establish a new origin local to the group, offset
from the parent origin (which may be another <g>!) by the specified
x and y values. This is perfect for positioning children, since you
can easily do so in the parent. The children themselves can pretend
they’re positioned at the origin, so they only have to worry about
their width and height, and what to render within that space. In fact,
this pattern is so useful, we have a helper component to do this:
const Translate = ({x=0,y=0,children}) => {
  if (!x && !y) return children;
  return <g transform={`translate(${x},${y})`}>{children}</g>;
}
Even though subdividing space like this in SVG component hierarchies
is a good rule of thumb, sometimes it may not be a good fit for some
part of your UI. Since <g> is not a bounded container like a
sized <div> with overflow: hidden, the width and height
pattern is just metadata for children to follow as a guideline. If
that pattern gets in the way, you can break the rules and have
children draw outside these bounds (though the result may be harder to
reason about).
Another useful pattern is to have components specify all the sizing and positioning metadata in constants at the top of the component:
export const Chart = ({ data }) => {
  const viewBoxWidth = 800;
  const viewBoxHeight = 400;
  const paddingX = 6;
  const paddingY = 4;
  const bottomAxisHeight = 30;
  const leftAxisWidth = 50;
  const bodyHeight = viewBoxHeight - bottomAxisHeight - 2 * paddingY;
  const bodyWidth = viewBoxWidth - leftAxisWidth - 2 * paddingX;
  const leftAxis = {
    pos: {
      x: paddingX,
      y: paddingY,
    },
    size: {
      width: leftAxisWidth,
      height: bodyHeight,
    },
  };
  const bottomAxis = {
    pos: {
      x: paddingX + leftAxisWidth,
      y: paddingY + bodyHeight,
    },
    size: {
      width: bodyWidth,
      height: bottomAxisHeight,
    },
  };
  const body = {
    pos: {
      x: leftAxis.pos.x + leftAxisWidth,
      y: paddingY,
    },
    size: {
      width: bodyWidth,
      height: bodyHeight,
    },
  };
  // chart logic code omitted
  return (
    <svg width="100%" height="400" viewBox={`0 0 ${viewBoxWidth} ${viewBoxHeight}`}>
      <Translate {...body.pos}>
        {/* chart body omitted */}
      </Translate>
      <Translate {...leftAxis.pos}>
        <LeftAxis {...leftAxis.size} /* other props omitted */ />
      </Translate>
      <Translate {...bottomAxis.pos}>
        <BottomAxis {...bottomAxis.size} /* other props omitted */ />
      </Translate>
    </svg>
  );
};
This may look tedious and verbose at first, but having the layout defined in one place, where it can be tweaked centrally and cross-referenced across child components, will make your life much easier as you inevitably adjust these. Plus, grouping related properties and using destructuring to apply them to children simplifies things a bit. It’s worth the extra verbosity to avoid having to hunt for magic constants across a complex component, and updating all the different occurrences (while making sure you avoid updating constants for unrelated properties that may have the same value).
Sizing in SVG
In the layout discussion above, we assumed that an explicit width and height are provided to our SVG element. This is reasonable if you have a fixed-size element, but that means your element is not responsive or even resizable. Fortunately, there are two approaches we can take to work around this.
The first is that the coordinate system discussed above is a
simplification. The actual mechanism is more complex (you can read a
great overview from Sara Soueidan
here),
but the most relevant part for us is the viewBox attribute of the
svg element. This defines the actual coordinate system to be used
for layout inside the SVG element in terms of arbitrary units (if
unset, this defaults to the actual width and height of the element).
It also supports an x and y offset for the coordinate system (relative
to the upper left of the element), but you can likely leave these as
zero. The full syntax is
viewBox="<xOffset> <yOffset> <width> <height>"
This lets us size our SVG component however we like (e.g.,
width="100%"), but still work in terms of subdividing a specific
width and height inside the component. One thing to note is that font
size will be relative to this viewBox coordinate system (that is, the
size of the font will vary based on the ratio of viewBox coordinate
system width to actual width). Another caveat is that if the aspect
ratio of your viewBox width and height does not match the actual
aspect ratio of the component, you’ll probably want to tweak the
preserveAspectRatio
property. If set to “none”, the coordinate system (and content) will
stretch to fit the dimensions of the actual component. This will
distort proportional width and height (so that, e.g., squares will no
longer be square), but if that’s not a concern in your component, this
may be the simplest way to go.
Another approach is to measure your component before you draw anything, e.g., using a hook like useMeasure. This is more complicated (it requires pulling in a dependency or writing your own hook like this) and it delays rendering until the component is sized, but it allows you to work in the actual dimensions, ensuring no aspect ratio distortion.

SVG and d3
Whenever visualizing data in JavaScript, d3 is a great tool to consider. However, since both d3 and React have strong opinions about how to handle the DOM, getting them to play together nicely can be tricky. A good rule of thumb is to use d3 for layout and React for rendering.
In our pganalyze charts, we use d3 for scales, helpers for stacking
area series data, bisectors for finding data points near the cursor,
and for generating path data (the d attribute) for line and area
charts. Almost everything else is plain React and SVG. Amelia
Wattenberger’s blog, linked above, has a separate post that’s a great
overview of the different d3
modules. Many of these are still
useful when working with React, but the rendering-oriented ones may be
more trouble than they’re worth.
The one exception is that we do use d3 selection to take advantage of
d3’s axis convenience functions. They are isolated in their own Axis
components, and we found it’s okay to let d3 handle rendering as long
as it’s not competing with React. Since our Axis components have a
simple interface and are rarely updated once a chart is mounted, we
use the useLayoutEffect hook to have d3 render the axis via the
helper function (and remove a previous render if there was one).
Here’s the code:
const BottomAxis = ({ scale, width }) => {
  const ref = useRef(null);
  useLayoutEffect(() => {
    const host = select(ref.current);
    host.select("g").remove();
    const axisGenerator = axisBottom(scale);
    const [start, end] = extent(scale.range());
    if (start == null || end == null) {
      return;
    }
    const pxPerTick = 80;
    const tickCount = Math.ceil((end - start) / pxPerTick);
    axisGenerator.ticks(tickCount);

    const group = host.append("g");
    group.call(axisGenerator);
  }, [scale, width]);

  return <g ref={ref} />;
};
We use useLayoutEffect instead of plain useEffect since we want to
update the DOM with the new configuration before the browser
“paints” the DOM updates. For more details on the differences, check
out this
overview
from Kent Dodds.
Another tricky aspect of working with d3 in React is plugins. There are a number of great d3 plugins, but many of them don’t really fit into “d3 for layout, React for rendering” paradigm, because they’re designed around d3, not React. We used a couple of plugins in our old code, but we found they didn’t fit our new approach, so we decided to remove them and reimplement their functionality in our own components. Having more control over these features was worth having to write some extra code. If you’re considering using d3 plugins, think about how they will integrate with the rest of your code.
Interactivity
A killer feature of SVG is the similarity of the event model to plain HTML, making it easy to build complex interactive interfaces. However, when combined with React’s component architecture, it’s easy to cause unnecessary re-renders of SVG components. Unnecessary re-renders can be a much bigger problem than slow renders, because the former can happen much more often. If you’re re-rendering a significant part of your component on mouse move events, for example, it will be hard to get that to perform well, no matter how fast the individual pieces render.
Fortunately, SVG has a great way to avoid unnecessary renders: you can separate rendering and interactivity concerns into two different layers. Because both layers are defined by the same data, it’s fairly easy to keep them in sync. Think of it as two mirror universes. In one, the data and props determine what’s drawn on screen, but nothing is interactive. In the other, no data is rendered, but mouse events (or touch or keyboard events) are captured and mapped back to data (d3’s scale.invert is great here), which can then be used to display tooltips or respond to click events. In the UI, this feels like a single set of interactive elements, and it can avoid a lot of re-renders (especially for any hover behavior) and keep the UI snappy. We have a full example below, but think of it like this:
Note that the static data rendering only needs to happen once per new set of data—if you have a lot of data points, this can make a big difference. (Depending on how you design your component, you may need to use React.memo to avoid extra renders.)
Another pattern we adopted to improve both performance and UI is to map mouse events back to the data, and only respond if the mapped data changes. That is, let’s say your cursor is at (20,10) and this maps to data point X. If you move to (21,10) but the closest data point is still X, the UI does not react (other than the mouse pointer itself moving, obviously). We don’t move the tooltip (it’s snapped to the nearest data point, not to the cursor, and is always at a fixed height) and there’s no other UI changes. We found this less distracting in the UI (why move things around if nothing meaningful happened?), and it helps avoid tooltip re-renders.
An important part of interactivity is avoiding interactions with
unwanted elements. For elements like tooltips and anything else that
pops up near the cursor, setting the pointerEvents attribute to
none will ensure these are not photobombing your pointer events. If
you don’t do this, and these elements show up under the cursor, they
may force mouseLeave events on the component where you were
previously tracking the mouse, forcing that element to hide them as
soon as they show up. You should generally consider adding that
attribute to anything non-interactive. It can be set on the <g>
element as well.
Here is our Mouse component which tracks which data point we’re
hovering over (if any) and re-renders its children whenever that
changes. It also takes a click callback to handle clicks on data
points. Note that for flexibility, mapping from screen coordinates to
data points happens with another callback provided as a prop:
export const Mouse = ({ width, height, onClick, children, toDataPoint }) => {
  const [hoverPt, setHoverPt] = useState(undefined);
  const handleMouseMove = (e) => {
    const mouse = getMouse(e, width, height);
    const newPt = toDataPoint(mouse);

    if (!pointsEqual(hoverPt, newPt)) {
      setHoverPt(newPt);
    }
  };
  const handleMouseLeave = () => {
    setHoverPt(undefined);
  };
  const handleMouseUp = () => {
    onClick && hoverPt && onClick(hoverPt);
  };

  return (
    <>
      <rect
        width={width}
        height={height}
        pointerEvents="all"
        fill="none"
        stroke="none"
        onMouseMove={handleMouseMove}
        onMouseLeave={handleMouseLeave}
        onMouseUp={handleMouseUp}
      />
      {children && children(hoverPt)}
    </>
  );
};

const getMouse = (e, width, height) => {
  const dims = e.currentTarget.getBoundingClientRect();
  const rawX = e.clientX - dims.left;
  const rawY = e.clientY - dims.top;
  const x = (rawX / dims.width) * width;
  const y = (rawY / dims.height) * height;
  return { x, y };
};

const pointsEqual = (p1, p2) => {
  return (!p1 && !p2) || (p1 && p2 && p1.x === p2.x && p1.y === p2.y);
};
You can then render anything that does depend on mouse position (like the tooltip) through the render prop pattern:
<Mouse {...body.size} onClick={handleClick} toDataPoint={mapToDataPoint}>
  {(pt) => {
    // N.B.: Tooltip just returns `null` if pt is `undefined`
    return <Tooltip point={pt} xScale={xScale} yScale={yScale} {...body.size} />;
  }}
</Mouse>
Styling SVG
SVG can be styled with CSS just like HTML, but note that many of the
actual styles themselves are different: fill instead of
background-color (and instead of color for text, somewhat
confusingly), stroke-width instead of border-width, etc. Aside
from that, familiar rules and selectors apply. Many styles can also be
specified via element attributes, and that may be preferable if you
need prop-level control over things like color or stroke width.
Embedding HTML in SVG
One of the lesser-known features of SVG is that you can embed HTML inside an SVG document with the foreignObject tag. This is very useful for elements like legends or tooltips that benefit from the more user-friendly text layout capabilities of HTML. You can use standard HTML CSS in these components, and even use React elements.
One tricky aspect of this is that foreignObject is a standard SVG
element, so it needs to be sized explicitly (like any other element).
This makes it hard to size things like tooltips: you may not know how
much space the label or value to display may need. But let’s revisit
the concept of overlays we discussed earlier. The HTML component does
not need to just be the visible tooltip: a div is transparent out of
the box, so we can stack a transparent wrapper div in front of our
other content, and lay the tooltip out within it. The tooltip can then
size itself to fit the items contained therein. If you adjust tip
positioning based on the position along the x axis, you have almost
half the width of the graph to play with (if that’s not enough, you
should probably rethink your tooltips).
One other issue we found is that some browsers (most notably, Safari)
run into rendering issues with foreignObject in some cases. This
bug details the
problem. The bug is eleven years old and has several duplicates, so
it’s probably not getting fixed soon, but we found that setting
position: fixed on the top-most element in foreignObject worked
around these issues (and has no other layout impact, since in this
case, fixed will function just like the default static).
Here is our Tooltip component:
const Tooltip = ({ point, xScale, yScale, width, height }) => {
  if (!point) {
    return null;
  }
  const tipY = 50;

  const screenX = xScale(point.x);
  const screenY = yScale(point.y);
  const time = new Date(point.x).toLocaleString();
  const value = point.y.toFixed(3);
  const tipContent = (
    <>
      <div>
        <span className={styles.tooltipLabel}>Time</span>: {time}
      </div>
      <div>
        <span className={styles.tooltipLabel}>Value</span>: {value}
      </div>
    </>
  );

  const placeRight = screenX < width / 2;
  const tipOverlay: Layout = {
    size: {
      width: placeRight ? width - screenX : screenX,
      height,
    },
    pos: {
      x: placeRight ? screenX : 0,
      y: tipY,
    },
  };
  const tipStyles = [styles.tooltip, placeRight ? styles.tooltipRight : styles.tooltipLeft].join(" ");
  return (
    <g pointerEvents="none">
      <circle cx={screenX} cy={screenY} r={3} fill="none" stroke="blue" strokeWidth={3} />
      <Translate {...tipOverlay.pos}>
        <foreignObject {...tipOverlay.size}>
          <div className={styles.tooltipContainer}>
            <div className={tipStyles}>
              {tipContent}
            </div>
          </div>
        </foreignObject>
      </Translate>
      {/* line indicating hover point */}
      <line x1={screenX} y1={0} x2={screenX} y2={height} stroke="darkslategray" strokeWidth={1} />
    </g>
  );
};
And yes, you can embed SVG inside this embedded HTML, and then embed HTML again, ad infinitum, just for kicks.
Full Example
Here is a full working example pulling together many of the concepts discussed above:
You can check out the source here, though we reviewed most of it piece by piece in the various sections above.
Conclusion
SVG can be a great way to extend your app’s UI, and works well out-of-the-box in React. We’ve found it invaluable in rebuilding the charting components in pganalyze, and we’ll reach for it again whenever it seems like a good fit. If you’d like to see all we’ve discussed in action, applied to real world use cases, you can check out the charts in the pganalyze app.