


Lock monitoring in Postgres: Find blocking queries in a lock tree with pganalyze
 By Keiko Oda
Postgres databases power many mission critical applications, and applications expect consistent query performance. If even a single query takes longer than expected, it can lead to unhappy users, or delayed background processes. We can use EXPLAIN to debug a slow query, but there is one Postgres problem it won’t tell us about: Blocked queries. You may also know this as “blocked sessions” from other database systems. This is when one query holds a lock on a table and the other is waiting for those locks to be released.
Historically, the solution for Postgres lock monitoring was to run a set of queries provided by the community to debug the issue. These queries either look at the pg_locks view in Postgres, or use the newer pg_blocking_pids() function to walk the lock tree in Postgres. But this involves a lot of manual work, as well as being present when the problem occurs. If a problem happened earlier in the day and resolved itself, the lock information is already gone.
Today, we’re excited to announce a better method for Postgres lock monitoring and alerting. The new pganalyze Lock Monitoring feature automatically detects locking/blocking queries as they happen, can alert you of production incidents in near-real time, and keeps a history of past locking incidents to help you understand an earlier locking problem.
Introducing the new pganalyze Lock Monitoring feature
Demonstration of how an idle connection progresses and blocks DELETE FROM and ALTER TABLE queries which in turn block 3 other SELECT queries
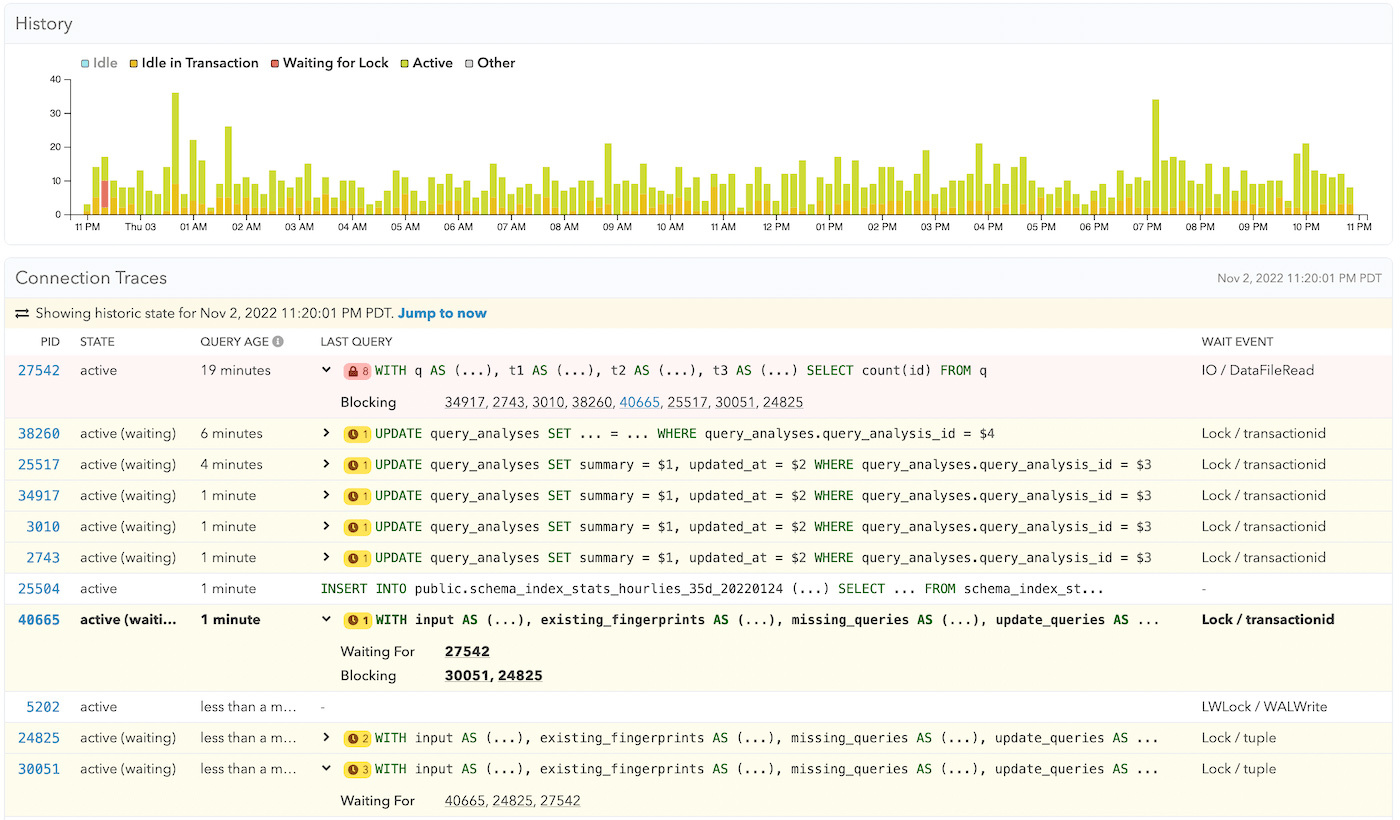
Previously, pganalyze already collected wait events. These events tell you what Postgres connections are waiting on, and the Wait Event History makes it easy to find outliers over time. With the new extended Connections page, you can now easily discover which connection is blocking other queries right inside the Connections page, and quickly jump to historic locking problems and see indirect relationships.
For example, when you have many “Waiting for Lock” connections, the database is likely having some trouble. It can be challenging to identify why a query is blocked. The new pganalyze Lock Monitoring feature lets you follow the whole story, from queries that are waiting to the connection that is causing the lock waits in the firsts place, and helps you prioritize the issues you should resolve first.
Next, let’s look at two typical examples of blocked queries that you would encounter with a production application:
Identifying Postgres connections that block queries, and lead to cascading lock waits
Long-running query with lots of operations on multiple tables holding locks longer than usual
This first example is from a production situation we encountered on the pganalyze application database itself. The bottom two queries (PID: 24825 and 30051) were waiting for tuples—row versions—that the bolded query (PID: 48665) was also going to lock—and it had priority in the lock tree. That query itself was waiting for a deletion from the long-running query above (PID: 27542).
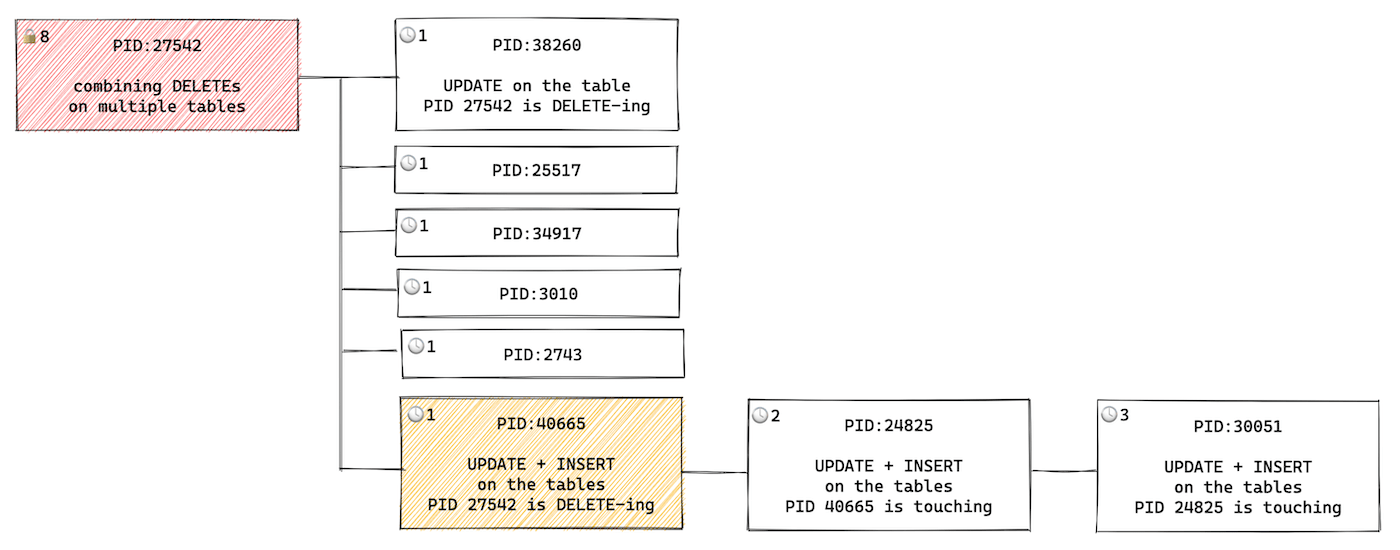
Here, we had one recurring long-running query that was combining DELETEs on multiple tables, and holding locks longer than usual. Therefore it was not a situation of “somebody ran a bad query by accident” or “somebody wrote a migration that takes an exclusive lock on the table for a long time”, but rather that we needed to re-think how to avoid this query in the first place.
Specifically, in this application we saw two possible solutions here:
- Split up the query into multiple smaller queries, and potentially only delete a subset of rows at a time
- Use table partitioning to avoid a pattern where a daily
DELETEis necessary
Let’s take a look at another common locking situation: Schema migrations with slow DDL statements.
Long running migrations that hold exclusive locks for too long
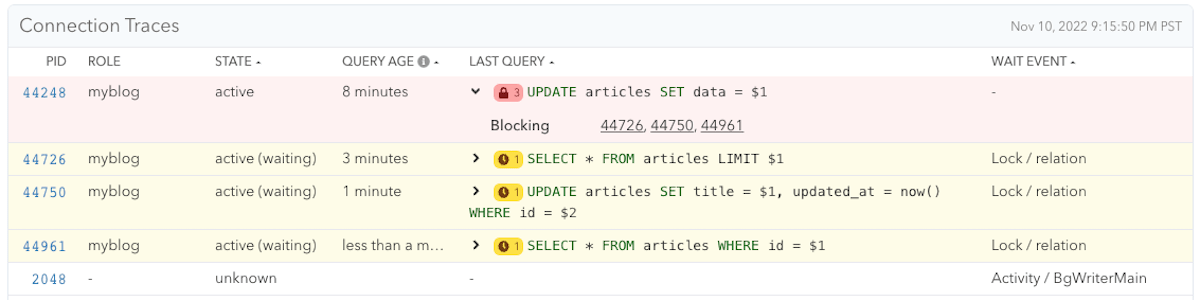
Connection holding an AccessExclusive lock on the articles table, taken by an earlier DDL statement in the same transaction, blocking other queries on the table
The second example is a common locking situation: long running migrations. There are several types of migrations that can lock the table and block other queries.
Let’s look at the following scenario: a new column called data is introduced to the table articles, and that column needs to be backfilled. A migration script in Rails could look like this:
class AddDataToArticles < ActiveRecord::Migration[7.0]
  def change
    add_column :articles, :data, :text
    Article.update_all data: "backfilling_value"
  end
end
Another way of looking at this Rails migration is:
- Start transaction (happens automatically in Rails migrations)
- Add column to the table (this is very fast, but takes an exclusive lock)
- Run the backfill query (this is slow)
- Commit the transaction and release the locks
Since this migration will happen in one transaction, that Article.update_all data: "backfilling_value" would happen inside of the transaction (PID: 44248), with the query being UPDATE articles SET data = $1 like you can see in the screenshot. That transaction would hold the exclusive lock on the articles table from the add_column :articles, :data, :text part.
Now, what effect would this have on this database? With this example, backfilling 70M rows took almost 10 minutes. During this time, any queries that include the articles table (even a simple SELECT) had to wait for the migration to be done. If this was a web application, this migration would have taken the application down for 10 minutes!
It is very important that we don’t write the migration like this to begin with. However, in case we do run such a migration, it is helpful to quickly know the lock information, so we can take the appropriate action, like canceling a query/migration. As a side note, you can find great examples of “bad migrations” in the strong migrations project.
Get alerted of blocking/locking query problems in near-real time
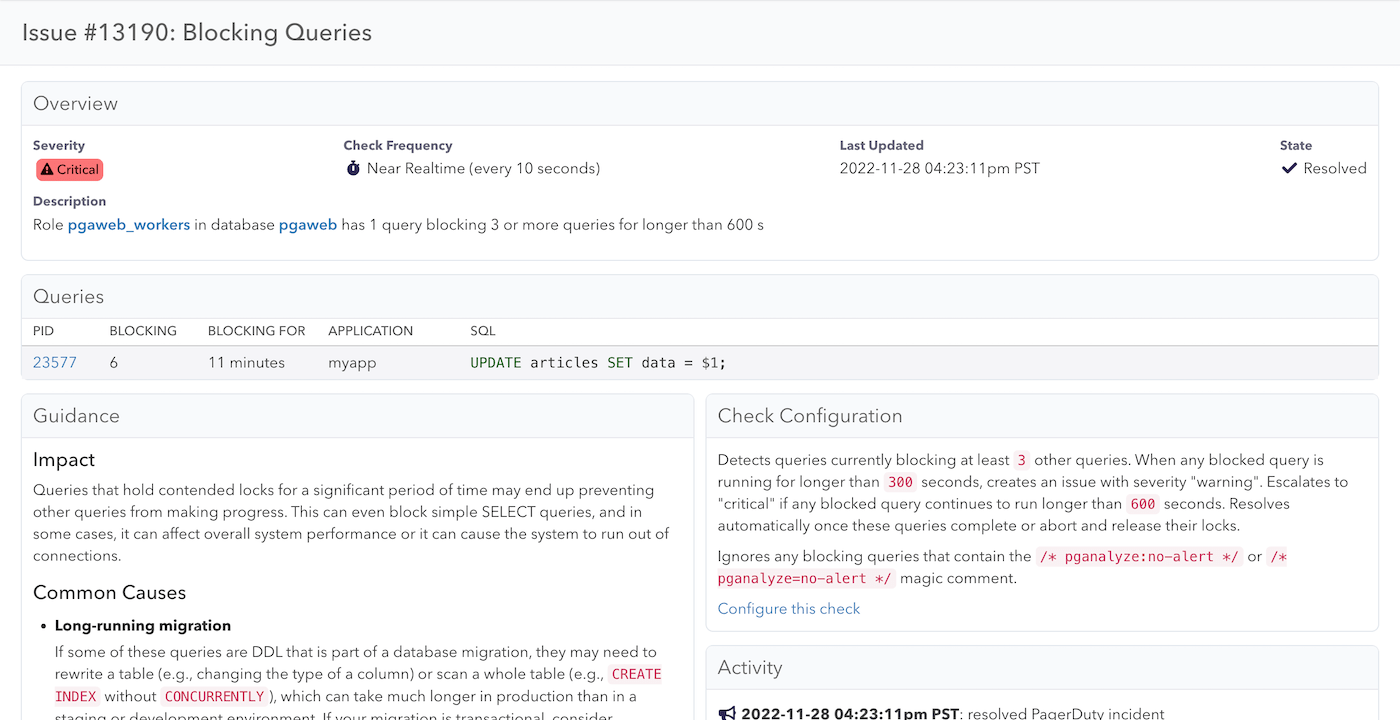
The new pganalyze Lock Monitoring feature includes a new “Blocking Queries” alert that will notify you when a query is blocking other queries for more than a specified time threshold. By default, the alert will trigger only when the query is blocking 3 or more other queries for more than 5 minutes, and consider it critical after 10 minutes. You can configure this based on your operational standards to something as low as 1 query being blocked for 10 seconds, if you would like to get notified for any query being blocked right away (we don’t recommend actually setting it this low for most environments).
By default, these new alerts will show up in the pganalyze UI. Based on your preferences you can enable notifications to be sent by email, Slack or PagerDuty. You can learn more about our alerts and checkups here.
Behind the scenes: pg_blocking_pids()
To obtain the lock information, the pganalyze collector uses the pg_blocking_pids() function. This function returns the list of PIDs a particular query is waiting for (is blocked by):
test_db=# SELECT pid, pg_blocking_pids(pid) FROM pg_stat_activity WHERE wait_event_type = 'Lock';
  pid  | pg_blocking_pids
-------+------------------
 81175 | {33219}
 81189 | {33219,81175}
 85112 | {81189}
 85128 | {81189}
 85146 | {81189}
(5 rows)
Calling this function uses the Postgres lock manager, which can be a heavily utilized component on busy Postgres systems. To keep overhead at a minimum, the collector only calls this function when a query is already in the “Waiting for Lock” state, and we know that there is a reason to get additional information. In our benchmarks as well as tests on production systems, we have observed no negative performance impact from tracking this additional data. You can disable this feature by passing the --no-postgres-locks option to the pganalyze collector, if needed.
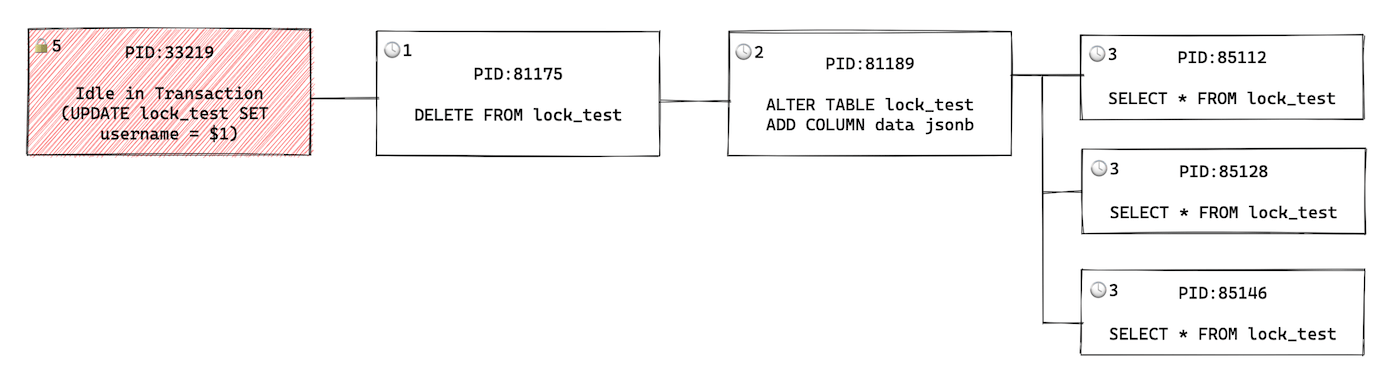
In case you are calling the pg_blocking_pids() function manually, be careful to look at the lock tree (as shown in the diagram) to detect other connections that have priority for acquiring the lock. If you are using pganalyze Lock Monitoring feature, this is done automatically for you.
Try the new pganalyze Lock Monitoring features now
If you are an existing pganalyze customer on the current Scale or Enterprise Cloud plans, you can start using the new pganalyze Lock Monitoring features today, or if you are not yet using pganalyze you can sign up for a free 14-day trial.
To collect the necessary locking/blocking information, make sure to upgrade to the pganalyze collector version v0.46.0 or newer. A new Enterprise Server release including this will be released soon.
We also want to extend our thanks to our early access group that reached out in response to the pganalyze newsletter. We’ve already incorporated feedback, and are looking to add more improvements, such as identifying which individual object a lock is being held on—the whole table, a particular row, or a virtual transaction ID. We are planning to keep iterating on this new set of features and would love to hear your feedback.