
Extended 100 day retention in pganalyze, and the new storage format that made it work


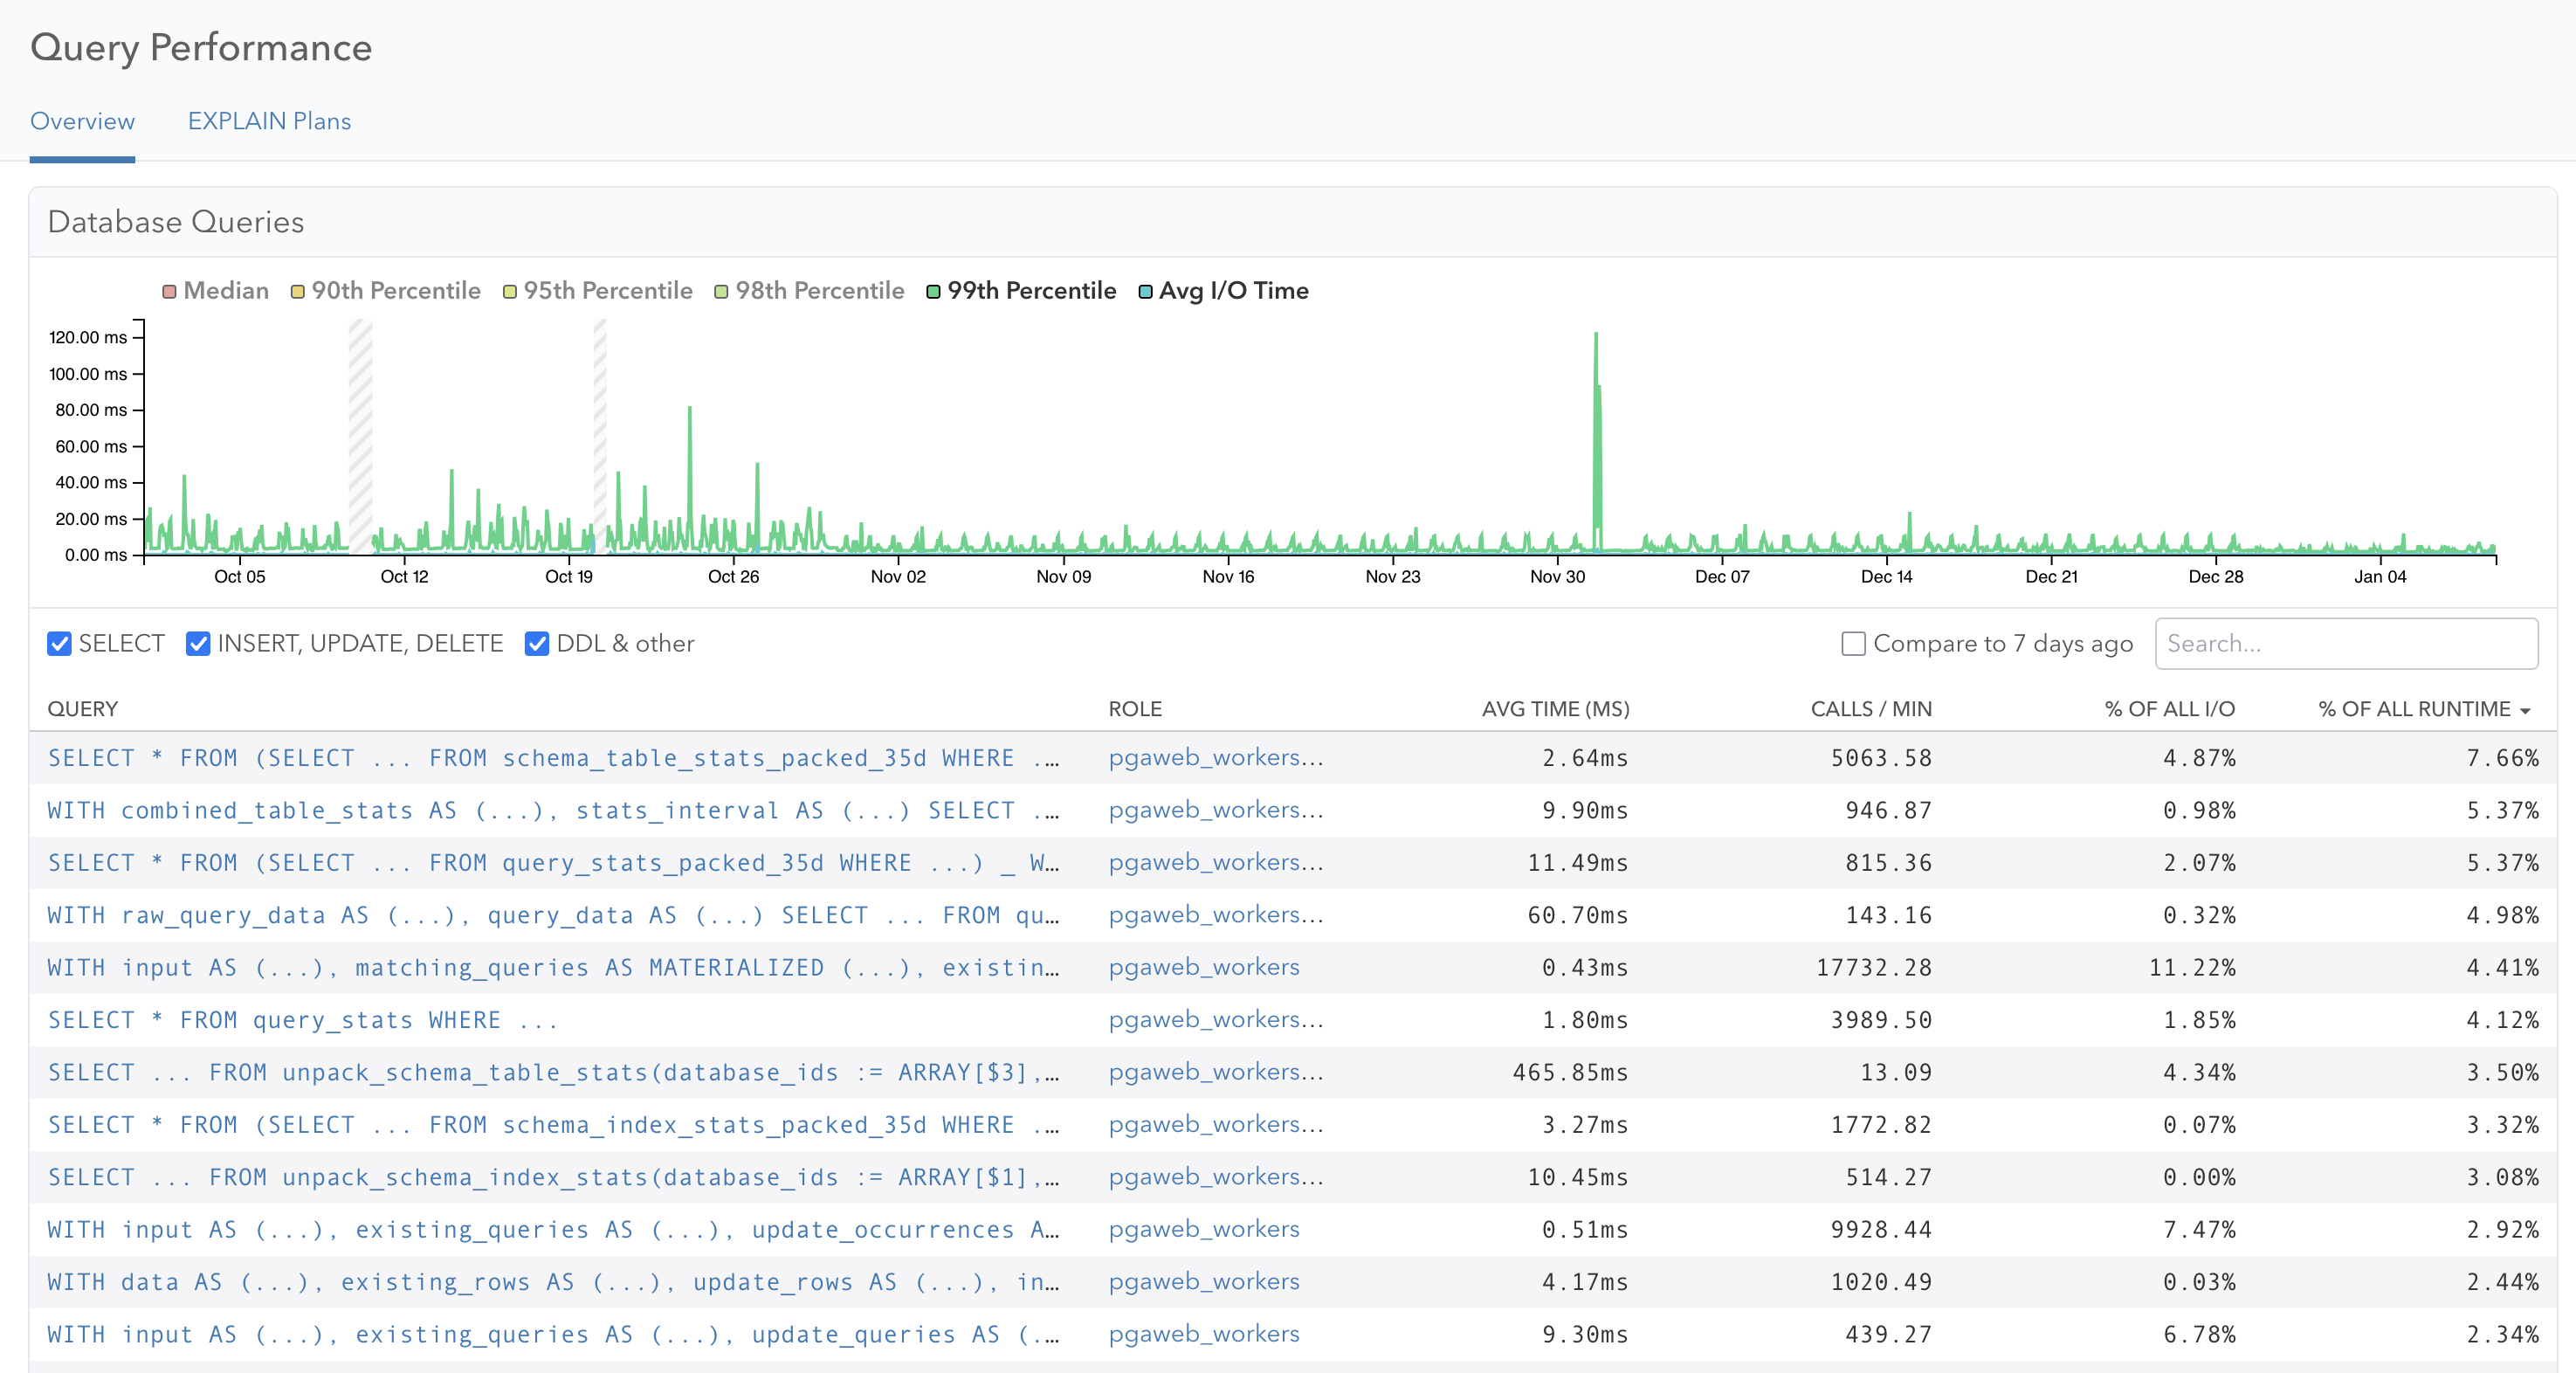
When it comes to monitoring your database, historic context matters. When we have an incident with a slow query, we want to know: Was this query always slow, or did it regress with a recent code change?
At pganalyze, we have developed a purpose-built product for optimizing Postgres. And we love to use Postgres ourself, so our internal timeseries storage is also based on Postgres. But storing timeseries data in Postgres can be challenging: Once you get to a lot of rows (some of our customers have millions of unique queries on a single database server), or keeping data for a longer timeframe, the simple approach of storing data in Postgres doesn’t work. And even using table partitioning still causes challenges with the amount of rows.
Today, we’re excited to announce extended 100 day retention time for query, table and index statistics in pganalyze. In this post you’ll get a quick overview on the new feature, and some details on how we made it work behind the scenes, and how our timeseries storage format has evolved over time, and is now utilizing the pco compression library.
100 day retention now available
First of all, if you log in to pganalyze today on our cloud services, you are already utilizing the new storage format. We rolled the change out for query statistics in October last year, followed by table and index statistics in December. The newly released Enterprise Server v2026.01.0 release brings this to all customers running pganalyze on-premise or behind their own firewall.
We have now enabled the system to store additional retention times as an option. And if you are on an Enterprise plan, you also have been automatically upgraded to have 100 days retention time going forward.
As part of this change, we also sat down and improved our date picker. It now allows easy selection of multi-month time ranges:
The challenge of storing timeseries data in Postgres
As mentioned earlier, we care about building a pganalyze in a way that solely relies on Postgres as the internal data store. It makes development and debugging easier (as compared to a special purpose timeseries database), and simplifies deployment for our Enterprise Server self-hosted deployment option.
Additionally, while there are extensions like TimescaleDB for Postgres that work with timeseries data, we can’t rely on them because Enterprise Server deployments could be using a Postgres cloud provider that doesn’t support that extension.
Many years ago, the way we stored query statistics in pganalyze looked like this:
CREATE TABLE public.query_stats_35d (
    database_id integer NOT NULL,
    fingerprint bytea NOT NULL,
    postgres_role_id uuid NOT NULL,
    collected_at timestamp without time zone NOT NULL,
    calls bigint,
    total_time double precision
)
PARTITION BY RANGE (collected_at);
That format worked, but was very inefficient: every row required a 23-byte row header and multiple index entries to support the query workload. And with multiple servers writing to the table at once it’s quite likely that read queries will have to load entire 8kb pages for just a single row, multiplying the read IO necessary.
In the next iteration we used a “packed” / columnar format, which used Postgres array types to write multiple query stats in a columnar layout to a single Postgres row, allowing the data to be compressed and pushed out to TOAST:
CREATE TABLE query_stats_packed_35d (
    database_id bigint NOT NULL,
    min_collected_at timestamp without time zone NOT NULL,
    fingerprint bigint[] NOT NULL,
    postgres_role_id uuid[] NOT NULL,
    collected_at timestamp without time zone[] NOT NULL,
    calls bigint[] NOT NULL,
    total_time double precision[] NOT NULL
 )
PARTITION BY RANGE (min_collected_at);
That reduced the table size by 11x! But it also caused Postgres to think that a single row will be returned in read queries, leading to a lot of slow nested loops. We worked around that by defining a SQL function with the ROWS 10000 hint:
CREATE FUNCTION unpack_query_stats(
  database_ids bigint[],
  start_ts timestamp,
  end_ts timestamp = now()
)
  RETURNS TABLE (...)
  LANGUAGE SQL ROWS 10000 PARALLEL SAFE
AS $$
  SELECT * FROM (
    SELECT database_id,
      unnest(collected_at) AS collected_at,
      int8send(unnest(fingerprint)) AS fingerprint,
      unnest(postgres_role_id) AS postgres_role_id,
      unnest(collected_interval_secs) AS collected_interval_secs,
      unnest(calls) AS calls,
      unnest(total_time) AS total_time
    FROM query_stats_packed_35d
    WHERE database_id = ANY(database_ids)
      AND min_collected_at >= start_ts - interval '10 minutes'
      AND min_collected_at <= end_ts + interval '10 minutes'
  ) _
  WHERE collected_at >= start_ts AND collected_at <= end_ts
$$;
This was overall a significant improvement, reducing the table size and by extension reducing read IO, but unnest functions don’t seem to be optimized for such large datasets so they became a new bottleneck slowing down queries.
Numeric compression
Binary compression can only do so much to compress numbers: it can remove duplicates, but it can’t compress e.g. a series of numbers which are all unique but are in a small min/max range. Enter Pcodec, aka “pco”, a purpose built compression algorithm for numeric data, that uses the mathematical relationship between numbers to achieve even better compression ratios.
We’ll share more details in a future blog post, but adopting pco further reduced the size by 5x, in total 55x smaller than the traditional table layout! This in addition to faster query runtime makes it possible for us to offer longer data retention in pganalyze.
Looking ahead
Our work on extending retention times isn’t finished yet. Some data in pganalyze is considered separate from the main timeseries data, and has short retention times, like the Connections view, Log Insights or EXPLAIN Plan Samples. Our goal is to offer a consistent experience, and eventually raise retention times across the board.
The new storage format also unlocks new possibilities in how we can analyze timeseries data efficiently. Expect more news later this year on improved query alerting, better ways to search the query data in pganalyze, and improved trend analysis.
If you are an Enterprise Cloud customer, you have access to 100 day retention today. For Scale plan cloud customers, we have raised the included retention to 35 days. For Enterprise Server customers, you can upgrade to v2026.01.0 to benefit from the increased retention time.
Not using pganalyze yet? Try out our 14 day free trial, which now also features faster statistics loading, thanks to the new pco-based storage format.