
Introducing pganalyze VACUUM Advisor: Workload-aware autovacuum tuning for Postgres


VACUUM in Postgres is a fact of life - every Postgres installation out there today, including those on AWS Aurora and Google AlloyDB, has to run autovacuum on each table at least every 2 billion transactions to perform freezing. And if you’d like to keep the active portion of your tables in memory, a frequent vacuuming cycle ensures tables stay small, and queries remain fast, with minimal bloat. Oftentimes, when your database is still small, you don’t have to think about VACUUM and autovacuum. However as your database grows, the system defaults for your workload’s Postgres autovacuum configuration are no longer adequate. Additionally, over time you may run into particular workload characteristics that require per-table tuning and a raised awareness of problems such as lock conflicts.
Today, we are excited to announce a better way to help you tune Postgres autovacuum settings, and discover problems that block VACUUM right away: The pganalyze VACUUM Advisor. With the pganalyze VACUUM Advisor, tuning Postgres to match the needs of your workloads is fast, predictable and easy.
To learn more, continue reading, or sign up for our webinar tomorrow July 26th at 9:30am Pacific.
- Three ways to think about VACUUM - Bloat, Freezing and Performance
- Introducing pganalyze VACUUM Advisor
- Common Postgres VACUUM problems that pganalyze VACUUM Advisor helps solve
- Identifying table bloat and preventing it by tuning per-table autovacuum thresholds
- Unblock VACUUMs that are not able to do cleanups due to the “xmin horizon”
- Tracking freezing operations and keeping an eye on Transaction ID and Multixact ID wraparound
- Making VACUUM fast: How to prevent multiple index phases and more
- Try out pganalyze VACUUM Advisor today
- What’s next?
Three ways to think about VACUUM - Bloat, Freezing and Performance
If one looks to the Postgres documentation, the aim of VACUUM is defined as:
- To recover or reuse disk space occupied by updated or deleted rows.
- To update data statistics used by the PostgreSQL query planner.
- To update the visibility map, which speeds up index-only scans.
- To protect against loss of very old data due to transaction ID wraparound or multixact ID wraparound.
Or put differently: VACUUM and autovacuum are crucial features in Postgres that optimize and maintain database performance by removing dead rows and preventing database bloat. Regularly running VACUUM operations also ensures long-term stability, and updates important statistics used during query planning and execution.
At pganalyze, we’ve found it useful to think about VACUUM the following way:
- Avoid Bloat, by vacuuming dead rows early, and preventing blocked VACUUMs due to the xmin
- Understand Freezing, and how Postgres avoids Transaction ID and Multixact wraparound
- Optimize Performance, by giving autovacuum enough resources, and avoiding conflicting locks
To achieve these goals effectively, vacuuming must run at the right time, with the right frequency. Workloads with high write activities in particular benefit from table specific settings. Some examples of these are large tables with small updated portions, small tables with constant INSERTs and DELETEs, and rows that are frequently updated. These can all benefit from optimized autovacuum settings.
Tuning autovacuum for the whole database, and for each table, improves query performance, reduces database bloat, and helps deliver consistent database performance and availability.
Introducing pganalyze VACUUM Advisor
What if there was a way to establish a well-designed VACUUM strategy? To ensure that your database is optimized for your specific workloads and data usage patterns, and that you’re getting the most out of your resources?
Based on a combination of workload data collected from Postgres statistics tables (pg_stat_user_tables, pg_stat_progress_vacuum and pg_stat_activity), as well as autovacuum log output (log_autovacuum_min_duration), we’ve built a better experience to help you find the right VACUUM strategy for your database, and immediately notice any blockers that prevent vacuuming.
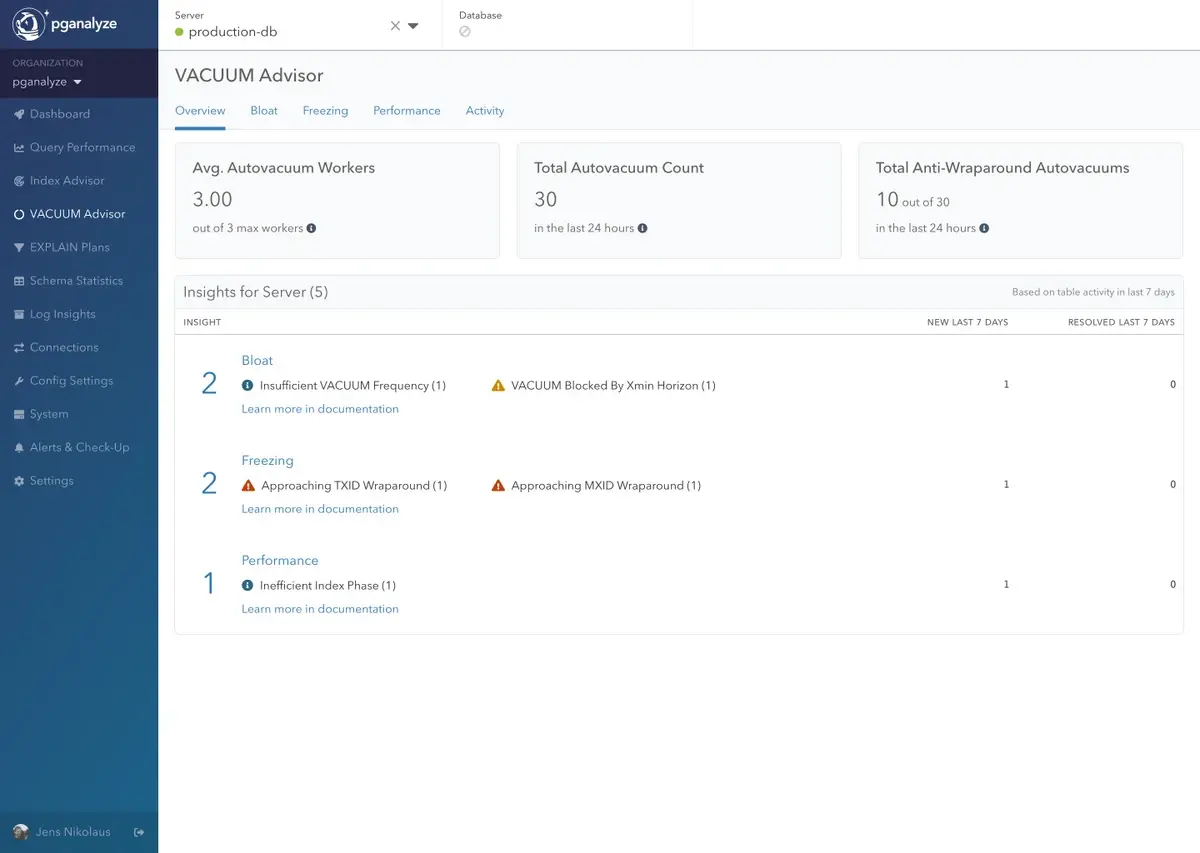
At a high-level, the new pganalyze VACUUM Advisor helps you to:
- Automatically scan your VACUUM statistics for inefficiencies, and provide insights for how to optimize your Postgres configuration.
- Find detailed insights to optimize Bloat, Freezing, and Performance issues.
- Review a prioritized list of insights (similar to pganalyze Index Advisor), so you can quickly work through them, and understand when pganalyze has confirmed there is no action needed.
- Understand how pganalyze arrives at each insight, so you can make the final decision if and how you want to apply it.
- Share in-depth autovacuum data with the whole team, and give the data platform team, infrastructure engineers, and DBAs quick access to detailed information.
- See statistics about VACUUM activity and individual table vacuum activities over time (note we’ve rolled the existing “VACUUM Activity” functionality into VACUUM Advisor).
Let’s take a look at some specific VACUUM problems, how pganalyze VACUUM Advisor helps track relevant metrics, and how you can get notified for tuning recommendations and operational alerts.
Common Postgres VACUUM problems that pganalyze VACUUM Advisor helps solve
Identifying table bloat and preventing it by tuning per-table autovacuum thresholds
The most common reason why your team might investigate autovacuum settings is related to bloat. We had often received requests from customers for including table bloat estimates in pganalyze, but the challenge here has always been how to measure bloat. Whilst there is an exact method to measure table bloat using pgstattuple (and pgstattuple_approx), that method unfortunately carries too much overhead to run continuously.
However, thanks to the recent addition of tracking column statistics in pganalyze (as part of pganalyze Index Advisor), we now have a straightforward way to add bloat estimation in pganalyze based on the comparison between the ideal table size (derived from the average row width multiplied by the rows in the table), and the actual table size. You may be familiar with this method from popular bloat estimation queries, such as the one released by PGX. This kind of method is fast, but it’s an estimate, which means it can be wrong at times. If in doubt, we recommend using pgstattuple to confirm bloat estimates, and decide whether to run a VACUUM FULL, or pg_repack.
You can find these new bloat estimates in the “Bloat” tab of pganalyze VACUUM Advisor, as well as on each table’s “VACUUM/ANALYZE Activity”:
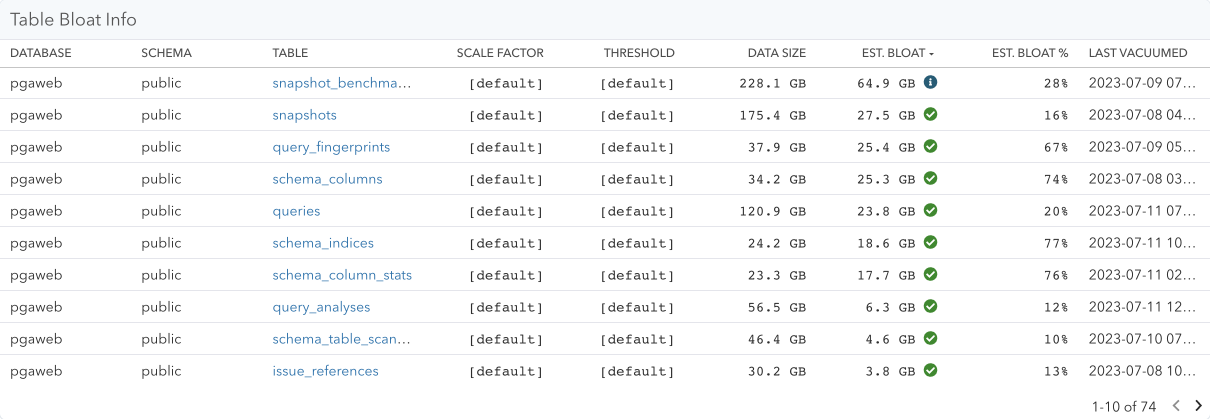
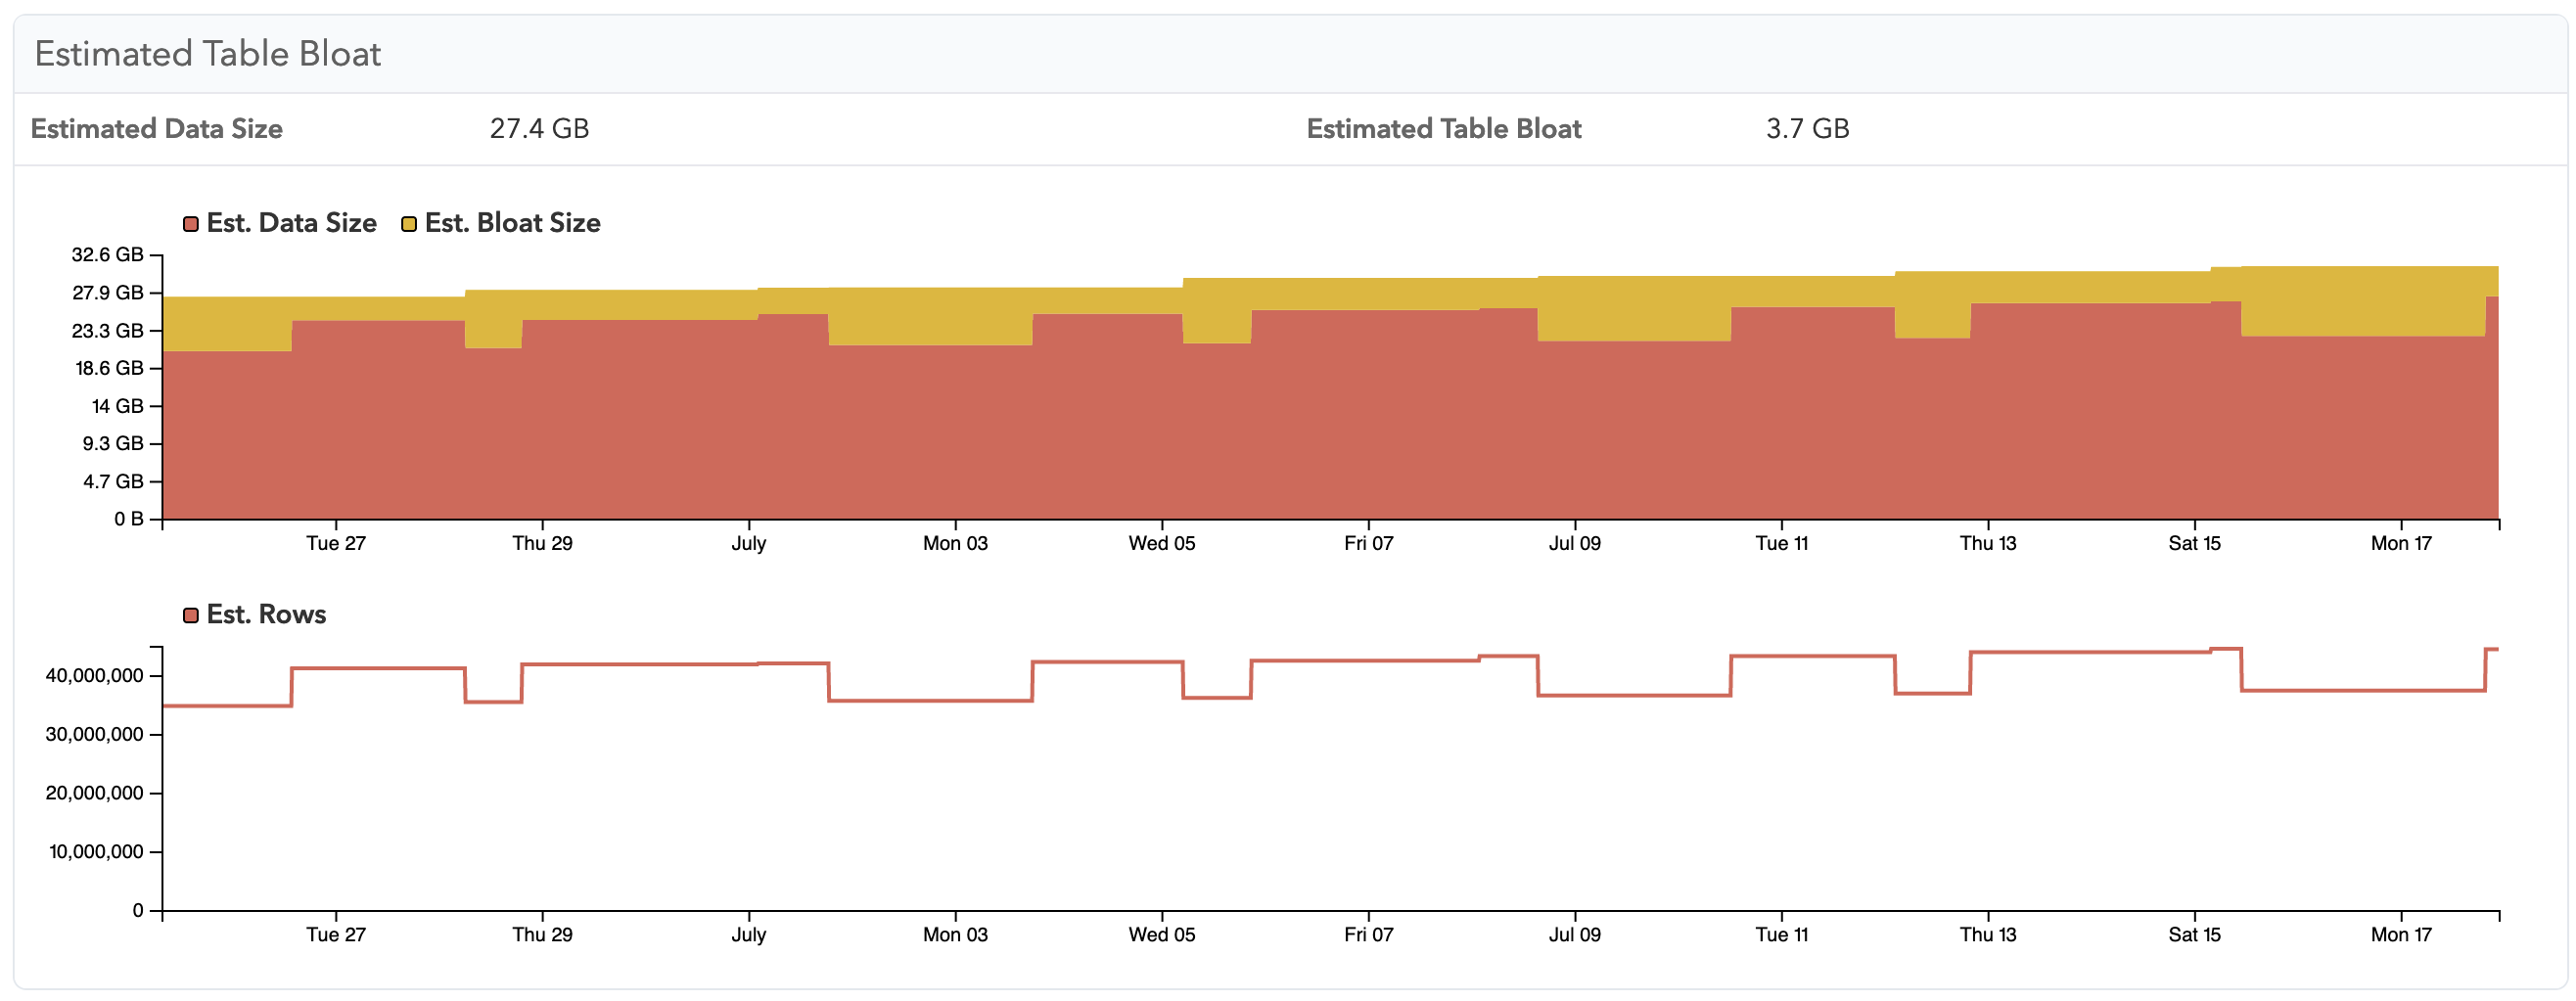
You might be surprised by the up-and-down pattern of this graph. The bloat estimates are based on the reltuples number stored for each table in Postgres - which itself is an estimate. This estimate is updated by both ANALYZE and VACUUM, but they can often differ, since VACUUM will be biased towards recent rows in the table. If in doubt, it’s better to look at the bloat estimate after a recent ANALYZE run.
But how do we prevent bloat from occurring? The root cause of bloat is dead rows (created by UPDATE and DELETE) that are not yet marked as free space, and thus cannot be re-used yet by subsequent INSERTs and UPDATEs.
To help you diagnose how dead rows impact autovacuum scheduling, we’ve been tracking dead rows in pganalyze for a while. We’ve now increased the retention time of individual VACUUM tracking to 35 days, and also allow you to see dead row cleanup in summary for each VACUUM run:
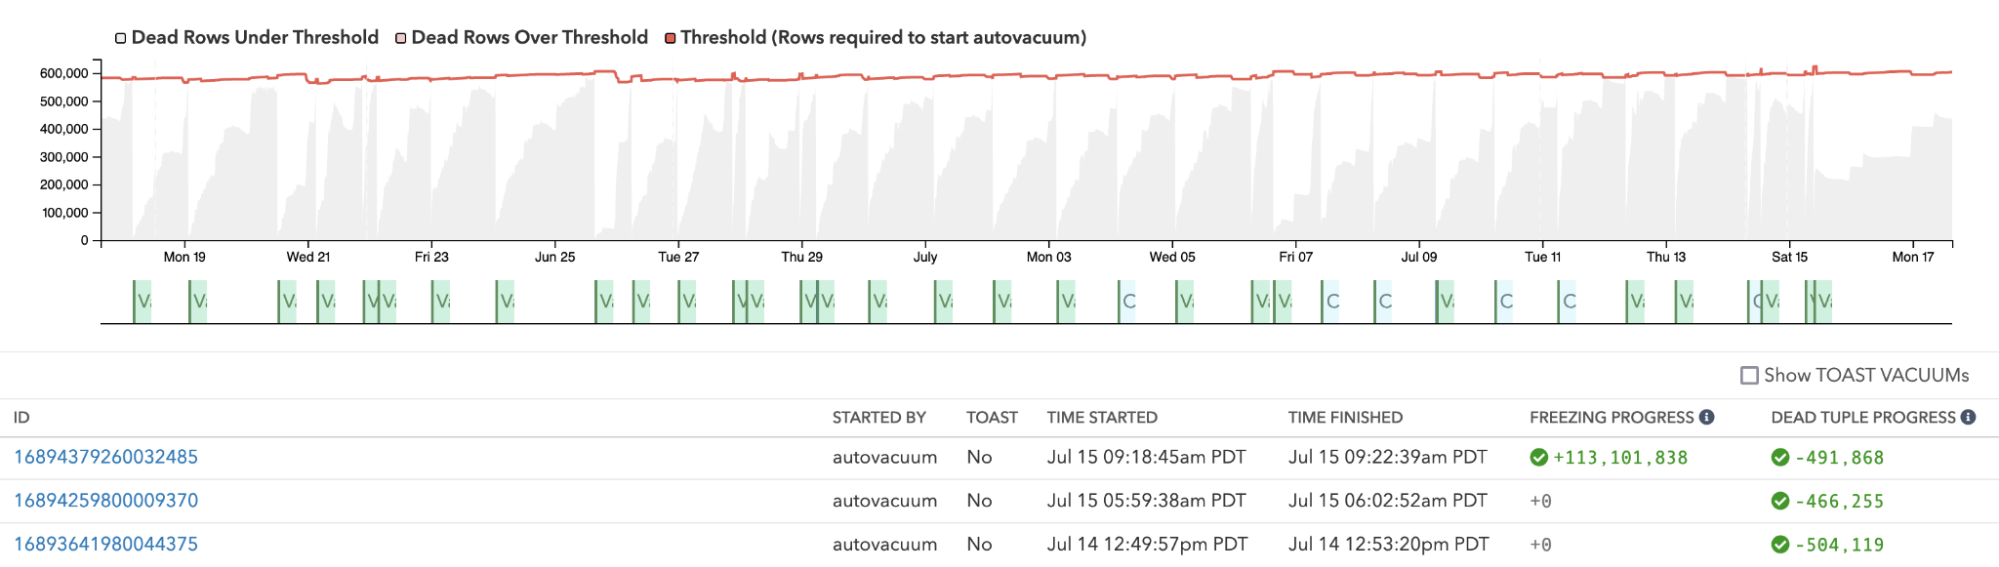
In order to prevent bloat, you would often want the threshold (shown in red in the graph) to be lower, so that VACUUM will run more frequently. This will turn the dead rows into free space earlier, which in turn allows new data to re-use the space - thus, avoiding bloat.
To help you identify when to change the threshold, we are introducing the new Bloat - Insufficient VACUUM Frequency insights in the pganalyze VACUUM Advisor. These new insights can also be sent to your team via Slack notifications.
To start with, we’ve set the conditions for this insight rather narrow: pganalyze observes the dead rows as well as insert/update behavior on a table over 7 days and calculates the amount of space that could have been saved if VACUUM had been performed more frequently.
pganalyze then recommends to lower the autovacuum_vacuum_scale_factor setting (up to 1% of the table), or for very large tables to set the scale factor to 0, and use the autovacuum_vacuum_threshold setting to tune for a specific row count (e.g. 1 million dead rows to trigger a VACUUM).

Note that this will not alert you on tables that have reached a steady but significant amount of bloat. In such cases we first recommend running pg_repack (or similar tools), and then using the new insight to help you tune autovacuum settings to avoid bloat from recurring.
Unblock VACUUMs that are not able to do cleanups due to the “xmin horizon”
One of the most puzzling situations can occur when you see a table being vacuumed via autovacuum, but instead of the operation being completed successfully and other tables being vacuumed next, the same table gets vacuumed again and again.
This can be especially frustrating when you see bloat problems on the table, and it’s not clear why VACUUM isn’t doing its job cleaning up dead rows. When you enable autovacuum logging with log_min_duration_statement = 0 (or a low threshold), this can be clearly seen with the value of “dead tuples not yet removable”:
LOG: automatic vacuum of table “mydb.myschema.mytable”: index scans: 0
pages: 0 removed, 14761 remain, 0 skipped due to pins, 12461 skipped frozen
tuples: 0 removed, 122038 remain, 14433 are dead but not yet removable, oldest xmin: 538040633
index scan bypassed: 255 pages from table (1.73% of total) have 661 dead item identifiers
I/O timings: read: 0.000 ms, write: 0.000 ms
avg read rate: 0.000 MB/s, avg write rate: 0.000 MB/s
buffer usage: 4420 hits, 0 misses, 0 dirtied
WAL usage: 1 records, 0 full page images, 245 bytes
system usage: CPU: user: 0.00 s, system: 0.00 s, elapsed: 0.01 s
As described in detail in research notes by one of our team members, there are several processes in Postgres that can cause the “xmin” value that’s effective for a particular VACUUM to be far behind:
- Long running transactions (involving any table, not just the one being vacuumed)
- Lagging or stale physical/logical replication slots
- Abandoned prepared transactions
- Long running queries on standbys (with hot_standby_feedback = on)
Any of these situations can cause your VACUUM to not do any meaningful work until the process has finished, or caught up with the current transaction ID, in the case of replication lag.
Traditionally monitoring for this problem was done by utilizing the “age(..)” function on the xmin value of certain statistics stables (e.g. pg_stat_activity.backend_xmin), which gives the distance from the current Transaction ID, in the number of transactions.
But the challenge with this approach is that it’s hard to say how many transactions are too much. Should I be alerting when the xmin horizon is 20k transactions, 200k or 2 million transactions in the past?
In order to introduce a more intuitive metric we instead took an extra step, by tracking the assignment time of individual Transaction ID values. That is, the timestamp on which Postgres incremented the Transaction ID counter in order to start a new transaction or perform a write.
With this mapping we are able to look at the xmin horizon in terms of calendar time, so we can say “Is there any transaction (or other database process) that has been holding back the xmin horizon for more than 24 hours?”.
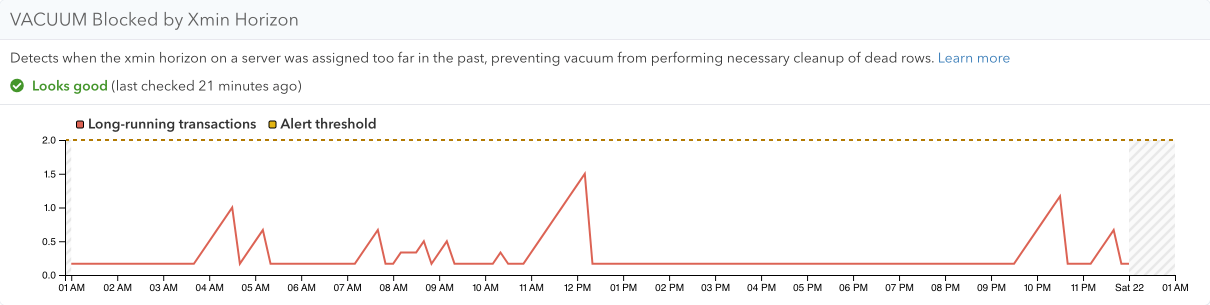
Effectively such a situation means that any VACUUM that were to run right now could not clean up data deleted in the last 24 hours, since the xmin horizon prevents it. And for most databases, this is the kind of situation that you’d want to be alerted to. With pganalyze VACUUM Advisor this alert is built in: VACUUM: Bloat - VACUUM Blocked by Xmin Horizon
You can rest assured that if this situation were to happen, you will know right away and can take action (for example by terminating a problematic process).
Tracking freezing operations and keeping an eye on Transaction ID and Multixact ID wraparound
Generally speaking, Postgres works with a finite number of transaction IDs that can be in use at any one time. And unfortunately, due to historic reasons, the transaction ID counters in Postgres are 32-bit numbers, split in a past and a future portion, meaning an effective 2 billion transaction IDs that can be in use at any one time. On busy systems, those 2 billion transaction IDs can be consumed within less than a day - making re-use critical, through a process called “freezing”.
As part of performing the freeze operation during vacuuming, Postgres will mark some pages as “all-frozen”. Once a page is frozen, each row on the page will be considered infinitely in the past, and Postgres will ignore the actual assigned Transaction ID numbers going forward (since they are frozen).
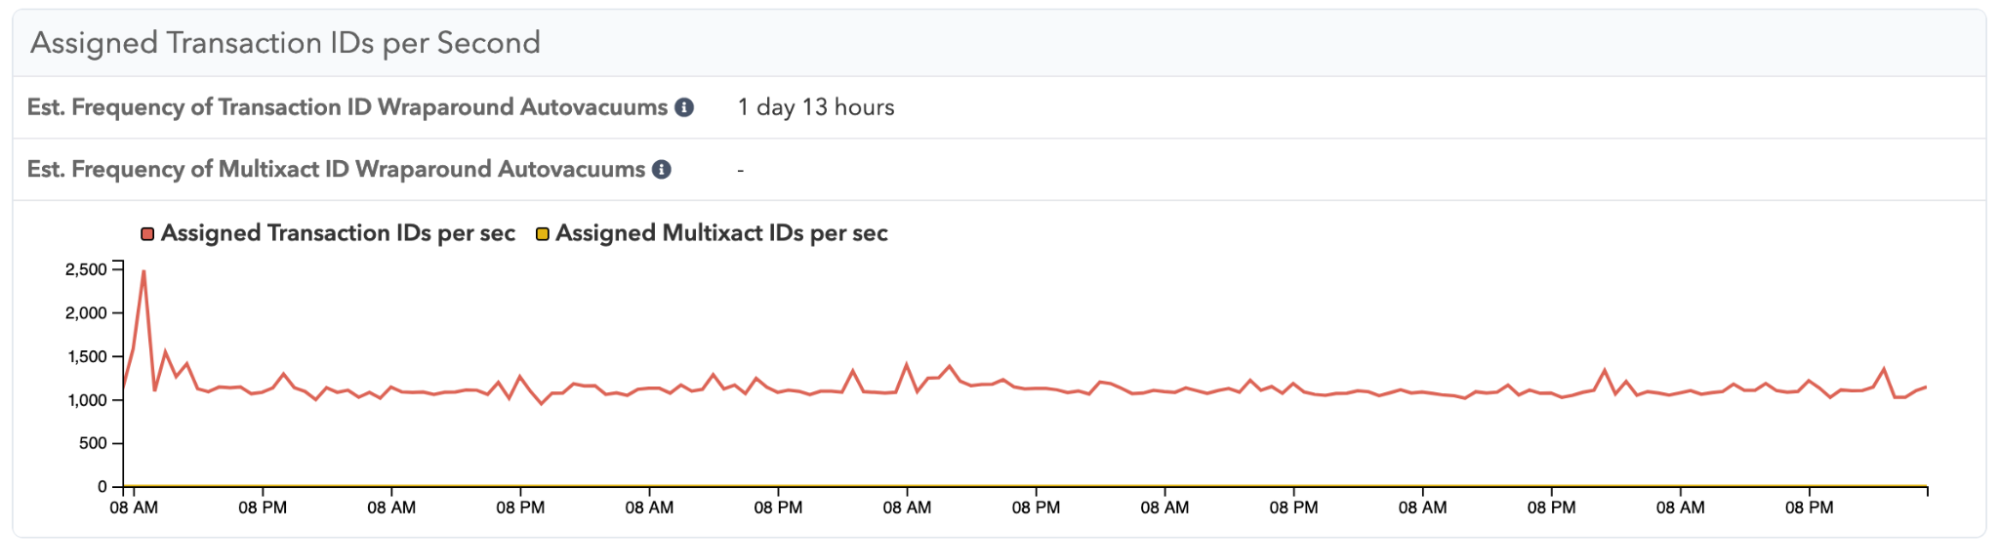
Not sure how many transaction IDs you’re consuming per day? In pganalyze VACUUM Advisor we now both show the transaction IDs consumed, as well as how long it takes to consume enough transaction IDs to trigger an anti-wraparound VACUUM on each table:
A few Postgres releases ago, a common failure mode for Postgres at scale (as seen at Mailchimp in 2019 and Sentry in 2015) was the shutdown that Postgres forces when it gets within 4 million transaction IDs that can still be assigned, before the available ID space gets exhausted. This failure was generally due to a lack of freezing, because insufficient vacuuming was performed. Whilst recent improvements have made this much less likely (especially with Postgres 14’s addition of the autovacuum “failsafe” mode), freezing is still a critical operation that can cause availability issues.
In pganalyze VACUUM Advisor we’re bringing you a lot more detail to this freezing operation that occurs behind the scenes, so you can understand exactly what is going on, and make workload-specific adjustments.
For example, a common practice is to raise the autovacuum_max_freeze_age limit in order to decrease the frequency of unnecessary anti-wraparound VACUUMs, as by default they run at a conservative 10% of the overall limit. It’s best practice to raise this limit on busy systems, to allow for more partial cleanups by “normal” VACUUMs over time, and reduce unnecessary I/O load. For example, on our own database that hosts the cloud-based deployment of pganalyze, we have raised this to 400 million (20%).
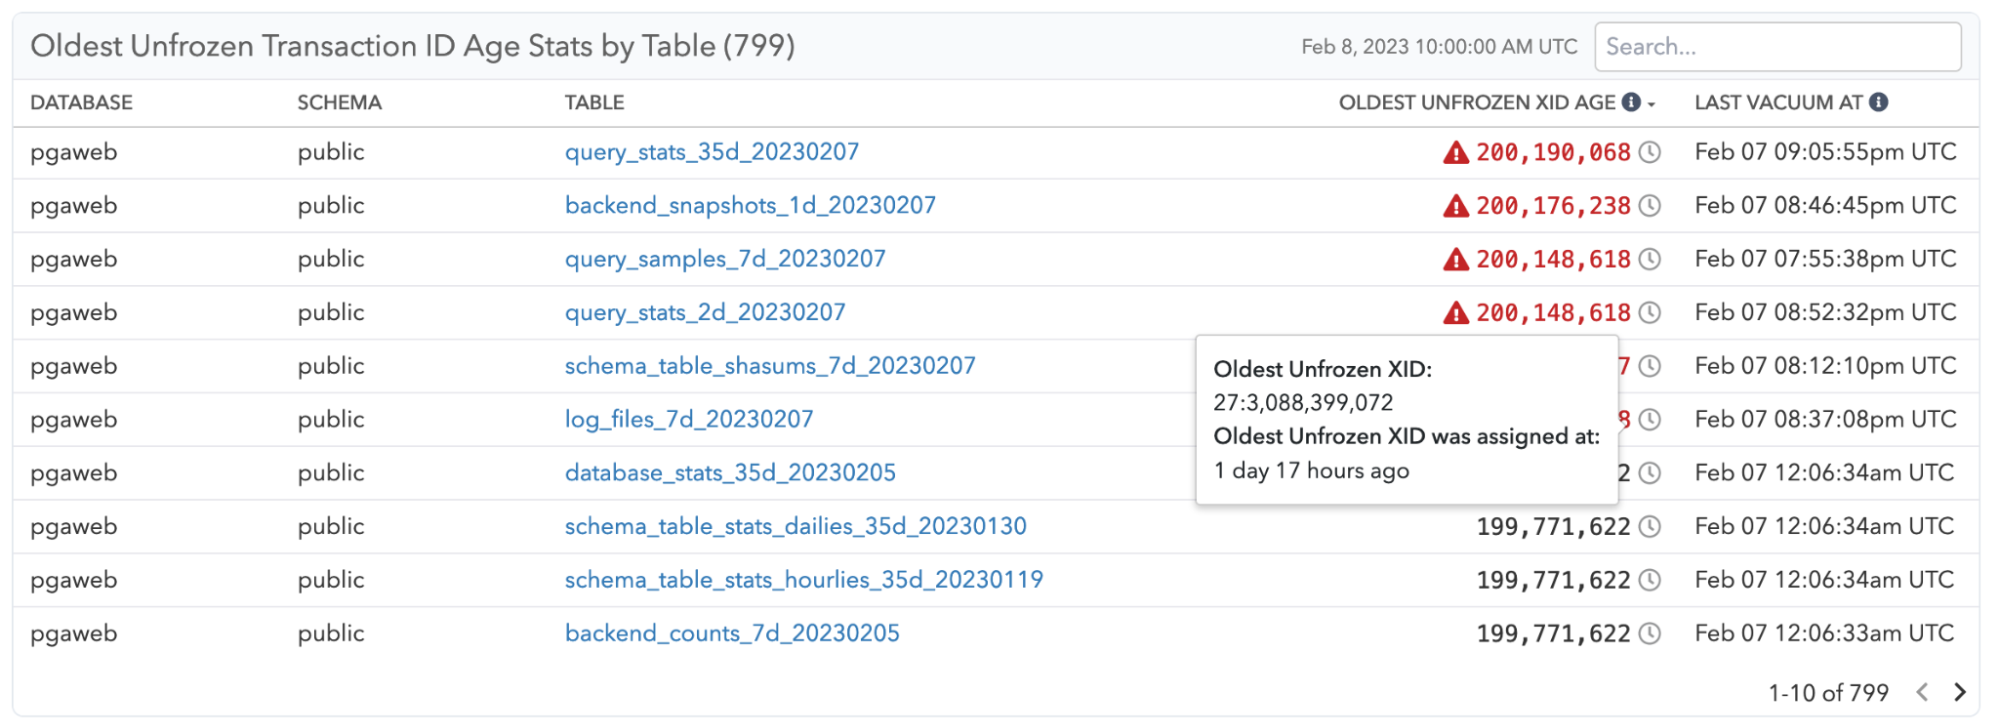
To help you tune this setting, and understand when you’re getting close to having to worry about exhausting Transaction IDs, you can now see a clear per-table breakdown of the freezing process, and also understand which table will receive an anti-wraparound VACUUM next, or are overdue:
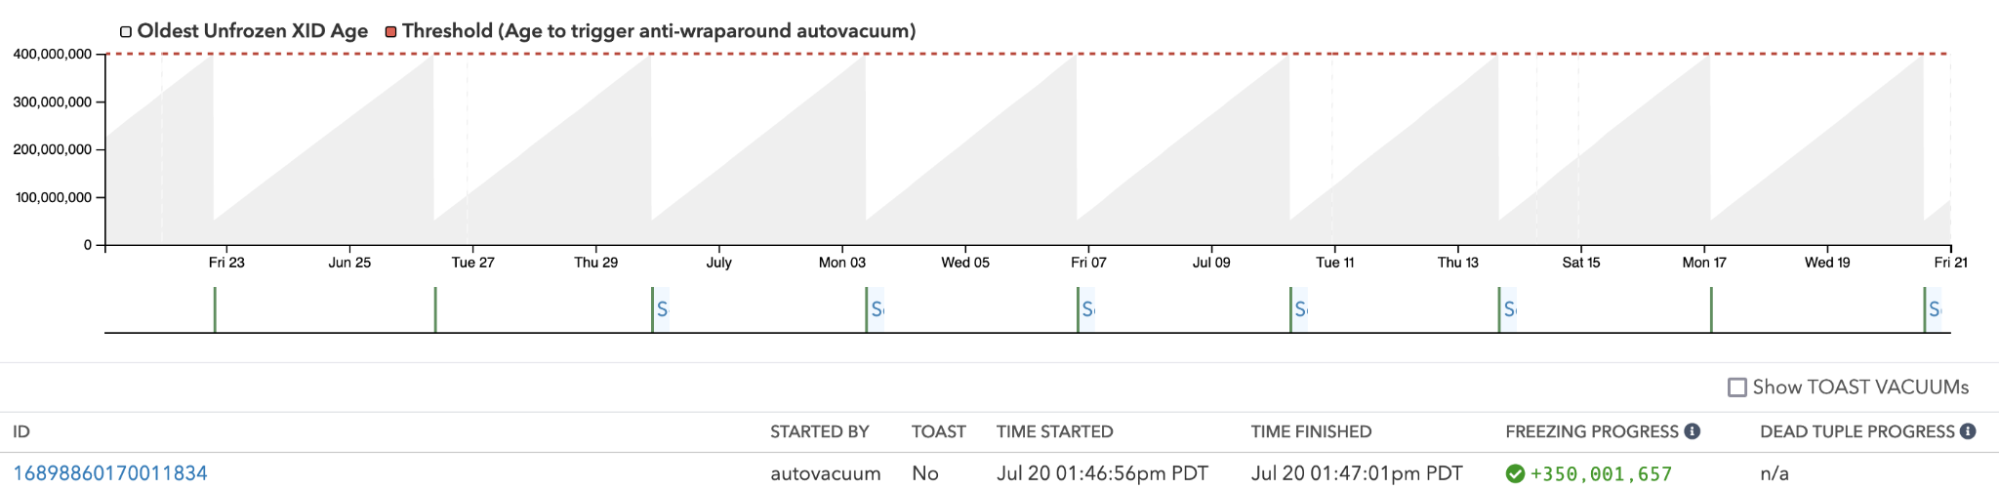
In addition, you can also see the freezing progress on each table individually over time. Just because an anti-wraparound VACUUM was started, doesn’t mean that it can succeed at freezing. This level of details can help a lot when you’re trying to understand why a particular table gets vacuumed again and again, and why you’re getting closer to a problematic threshold:
And to help you rest assured that you got everything covered, we now also have a built-in alert for both approaching Transaction ID wraparound, as well as Multixact ID wraparound (i.e., a problem on databases that make heavy use of row-level locks).
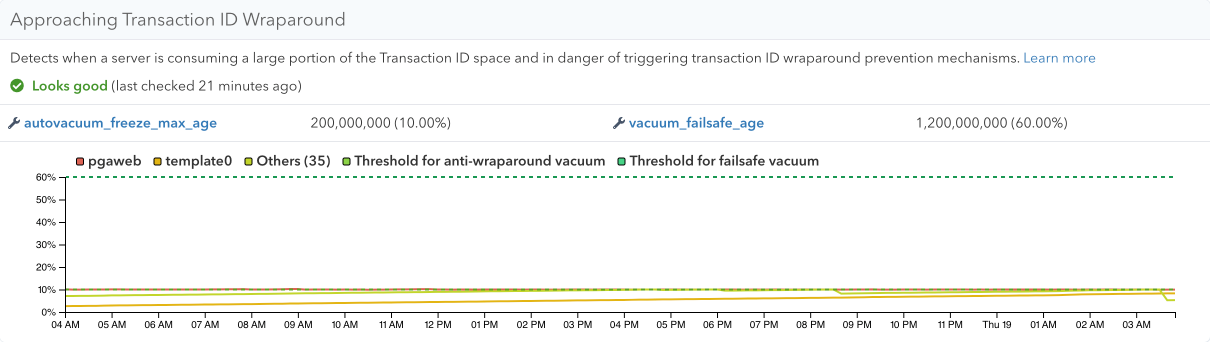
The thresholds for the alert are customizable, and start with what we’ve found most useful: 50% consumption issues a warning, 80% consumption will issue a critical alert, that you can also receive in other systems, for example through our PagerDuty integration.
Making VACUUM fast: How to prevent multiple index phases and more
Given the importance of VACUUM, it’s important not just to keep a close eye on the outcomes for bloat prevention and freezing, but also to make sure that VACUUM itself runs as efficiently as it can.
There are a couple of pathological situations that can cause trouble with autovacuum - and with pganalyze VACUUM Advisor we pull up these critical metrics for easy review.
Let’s start with a common problem: Having a too low autovacuum_work_mem, in combination with a large table. When a table is vacuumed, we often have to visit the indexes as well to remove any pointers from the index to the main table that are no longer needed. In order to know which index entries can be removed, Postgres needs to remember the dead rows that were identified in the initial heap scan phase.
This working memory is limited by the autovacuum_work_mem setting, and defaults to 64 MB on standard Postgres (and is already increased by some cloud provider configurations). If this setting is too low, Postgres will have to do multiple passes over the indexes, which can be very expensive in terms of I/O. For most systems it is best to only have a single index phase (by raising autovacuum_work_mem to a sufficient amount), to avoid this problem.
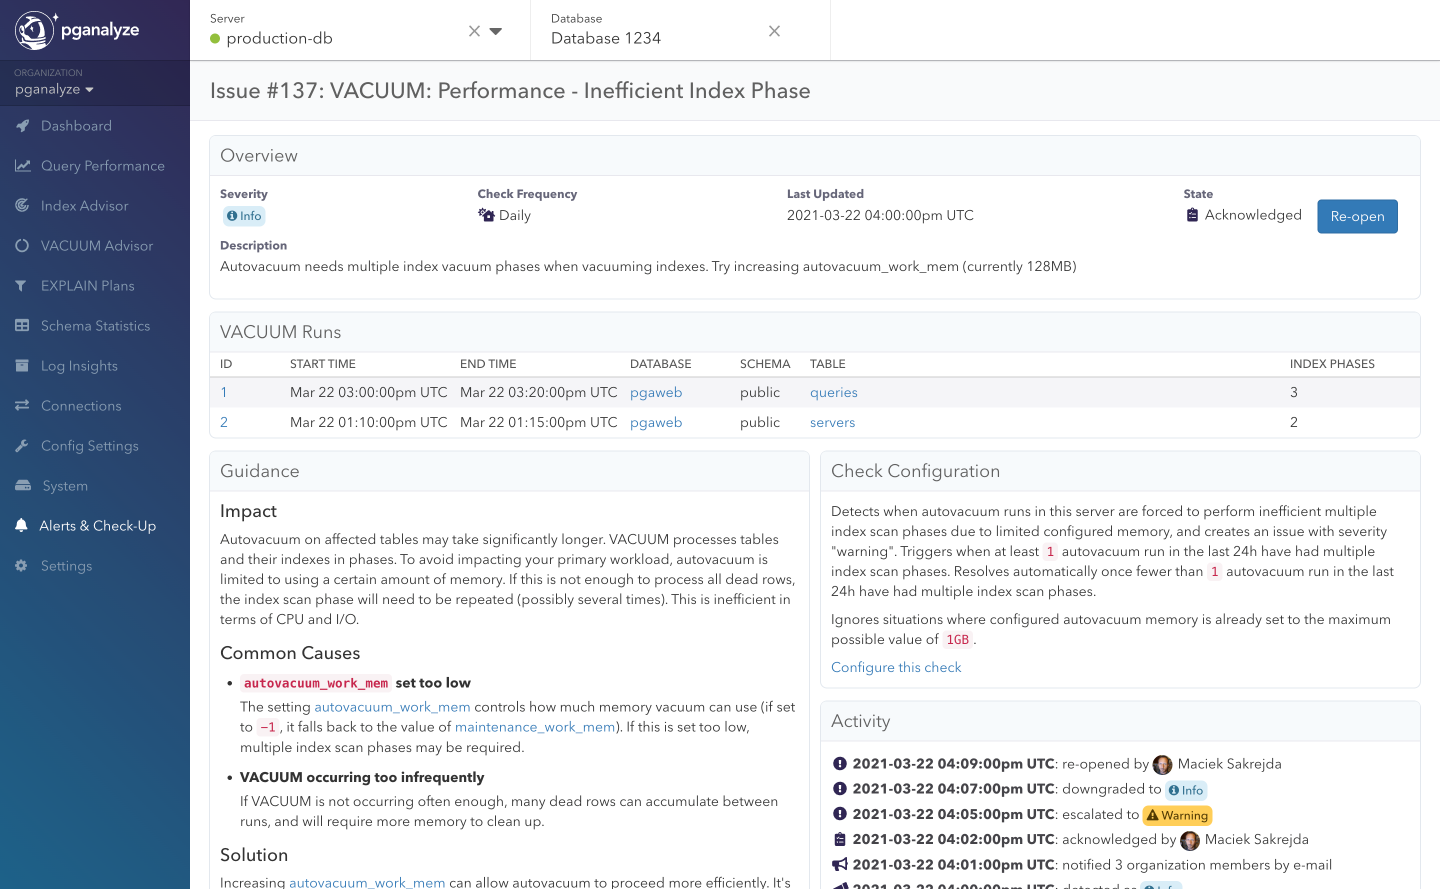
If pganalyze VACUUM Advisor detects one or more vacuums that required multiple index phases, and notifies you with a recommendation for an increased autovacuum_work_mem setting: VACUUM: Performance - Inefficient Index Phase
There are many more ways to make sure VACUUM performs well. pganalyze VACUUM Advisor also shows you the following metrics under the Performance tab to help you understand your VACUUM performance:
- How many autovacuums were skipped due to conflicting locks
- Your autovacuum worker utilization, so you know when to increase
autovacuum_max_workers - The number of VACUUMs on each table in a 24 hour period, so you can identify potentially problematic tables
Try out pganalyze VACUUM Advisor today
You can start using pganalyze VACUUM Advisor today with our Scale and Enterprise plans. If you are new to pganalyze, you can try out the full feature set, including pganalyze VACUUM Advisor, for 14 days free of charge.
We’d also like to thank all customers that have participated in early access in the last couple of months! We are excited to learn what you think about the new pganalyze VACUUM Advisor. If you’re interested to learn more, you can watch a recording of webinar we did on July 26th about it:

If you’re considering whether to become a new pganalyze customer, be aware that we will be adjusting our prices for new subscribers from September 1, 2023 going forward to support our continued product improvements. We will also be introducing a new reduced pricing for replicas. If you subscribe to pganalyze before then, you will lock in the current Scale plan pricing and feature set, including VACUUM Advisor, for at least one year.
What’s next?
With today’s launch we’re excited to have introduced another building block in what we believe the future of running Postgres databases looks like - read more on our thoughts in our April 2023 newsletter.
For pganalyze VACUUM Advisor we have a few things in the pipeline:
- A VACUUM Simulator to test out different scale factor/threshold settings
- Tracking of index bloat over time, to notify you when REINDEX is necessary
- Analysis of long running VACUUMs and cost limit/delay recommendations
- Recommendations for eager freezing to reduce I/O impact of autovacuum
- Detection of VACUUM backlogs due to insufficient worker capacity
More on that later this year!
Let us know your feedback about the new pganalyze VACUUM Advisor by emailing team@pganalyze.com.