
New in pganalyze: Server Groups and Cluster-Wide Query Performance
 Bison HubertEngineering
You have a Postgres primary and three read replicas. Two of the replicas are serving slow queries. Where do you start?
Until now, pganalyze would have shown you four separate views, one per server. Aggregating the numbers would be a manual process as you flip between tabs, having to remember which queries ran where.
When we introduced cluster-aware Index Advisor, we started fixing this fragmented experience. Considering the entire workload before creating index recommendations for a cluster was essential. In that post, we hinted at a broader idea we’re calling Server Groups. Today, this idea ships as a first-class concept.
Server groups are automatically defined for Postgres clusters. That is, a set of servers sharing a schema, with members made up of one primary and one or more replicas. Clusters now have their own dashboard, acting as the source of truth to review and assess issues across your fleet.
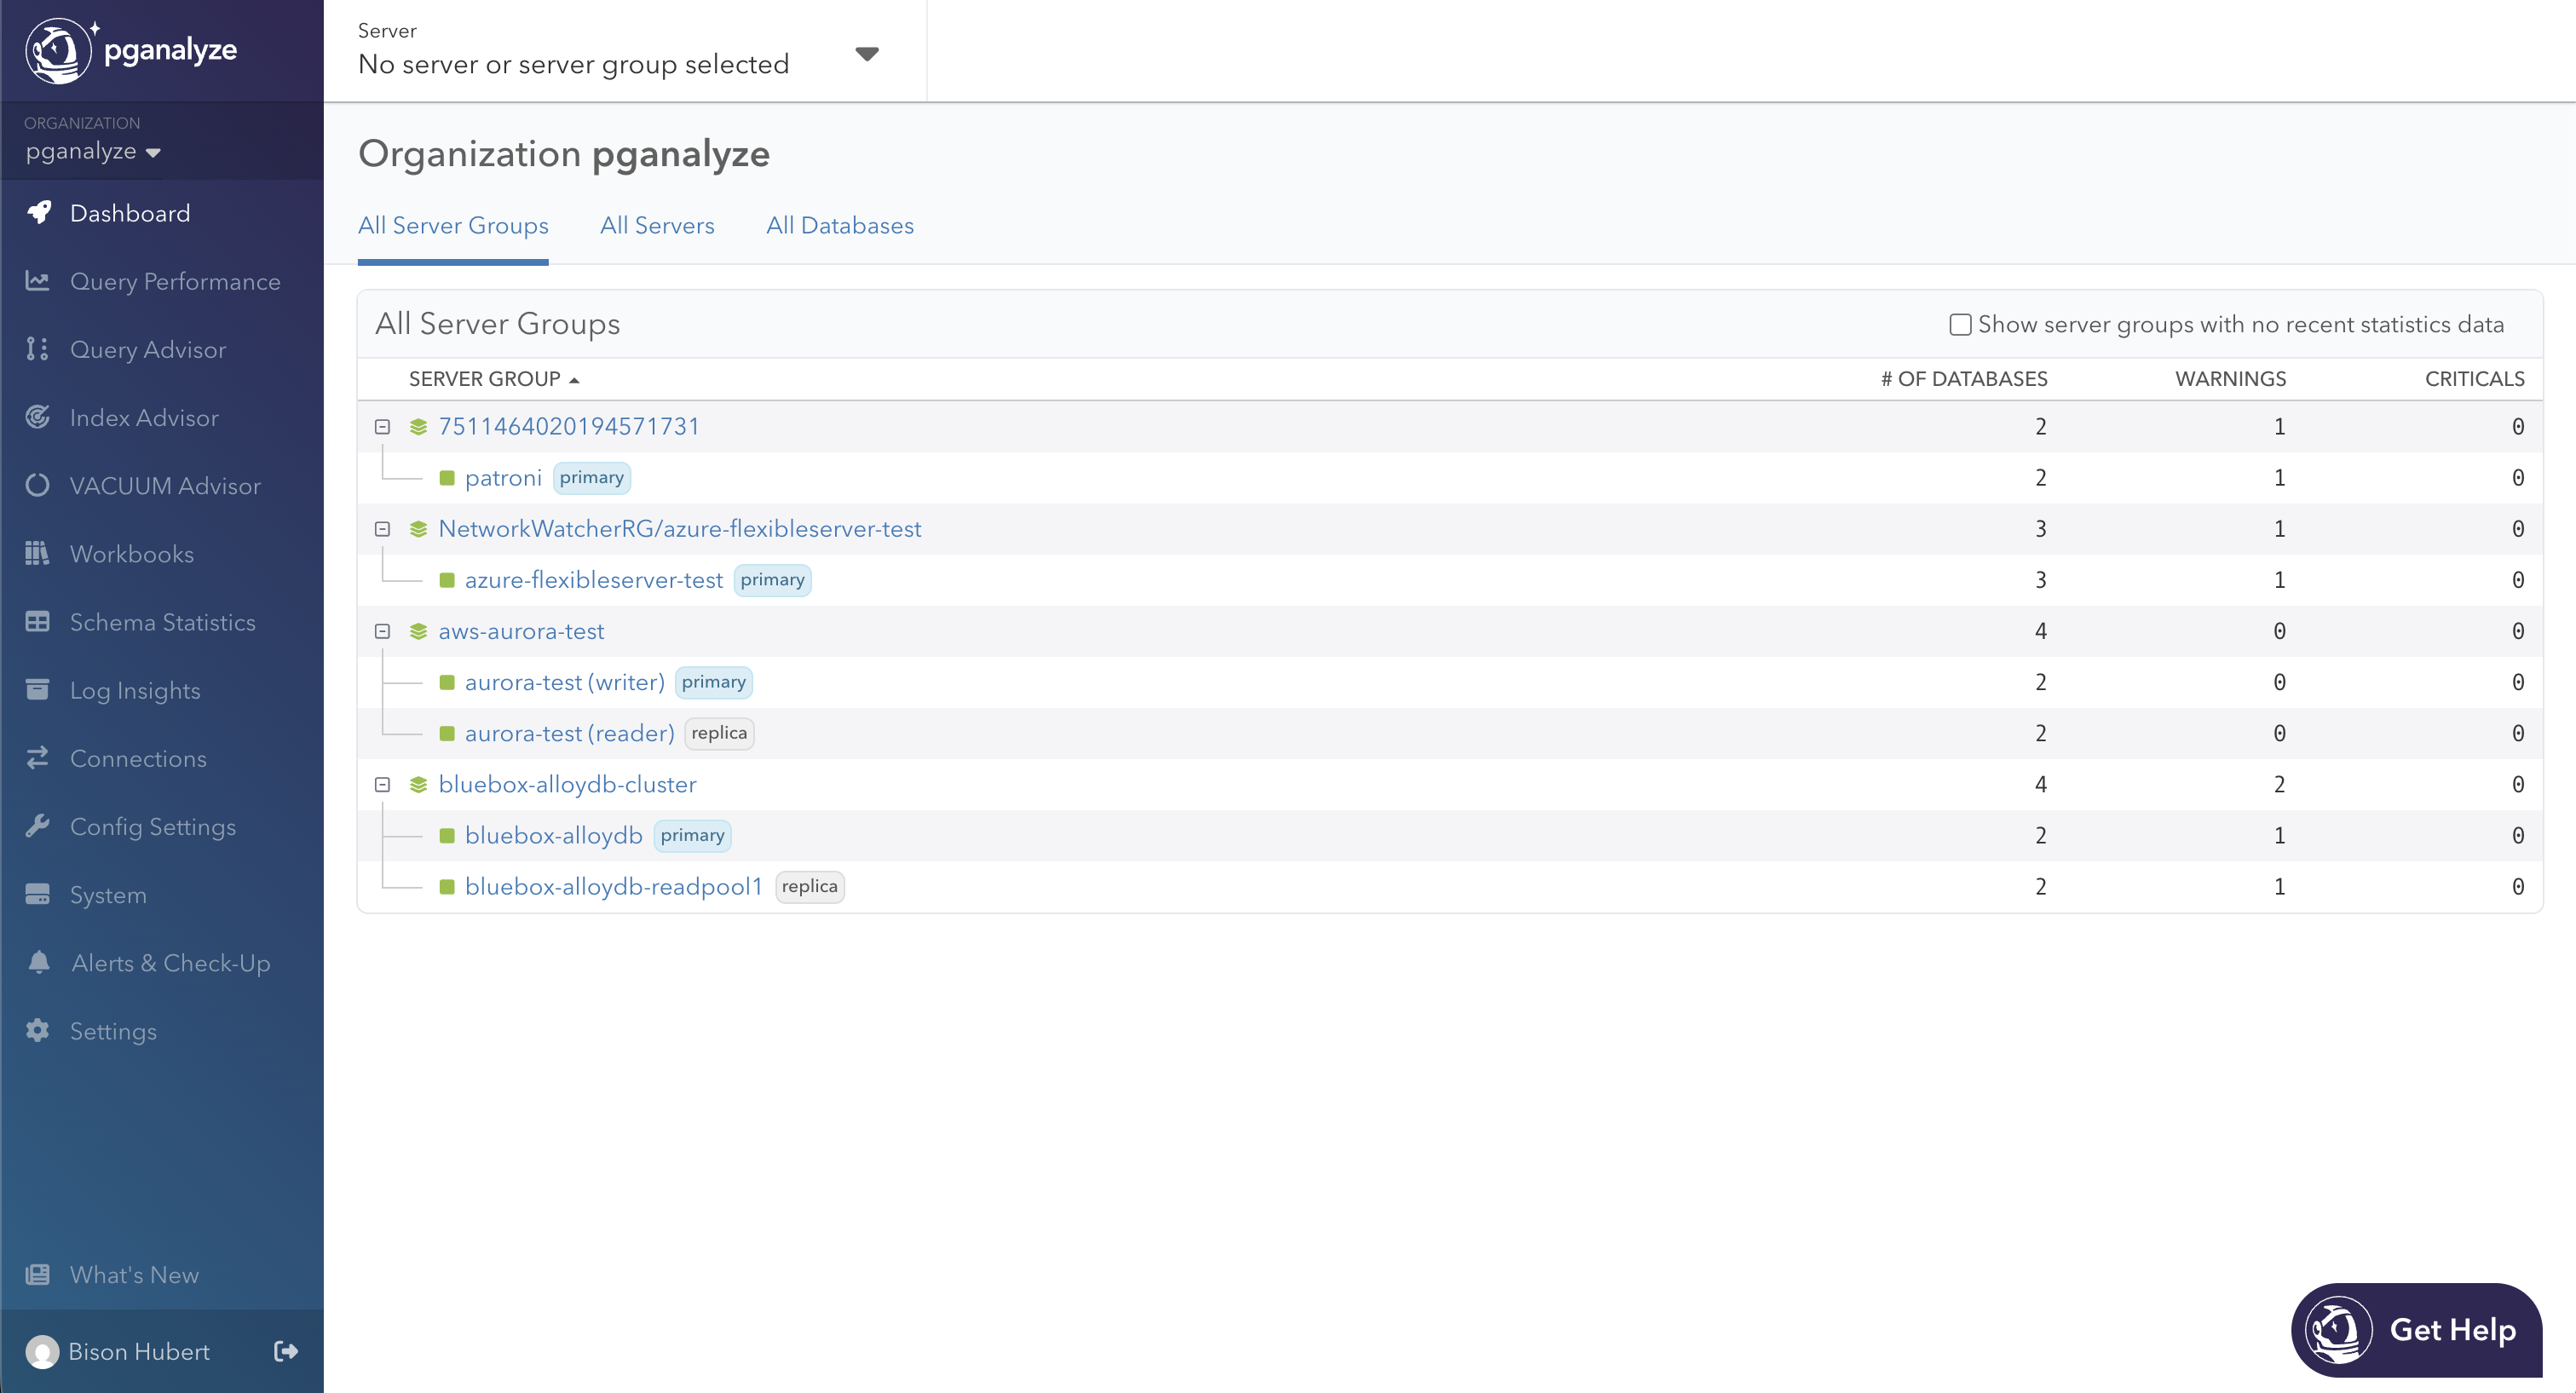
In this dashboard, the top-level rows are clusters. Expanded by default, they show the relationship between the cluster and its members as children, with badges to indicate if it’s a primary or a replica. Both levels share the same columns like database count and how many warning and critical issues are currently open. This lets you compare, at a glance, cluster totals against the stats of each instance. Sort by criticals to surface the worst-affected cluster first, then drill-down to get more details about a specific server.
Cluster-Wide Query Performance
Analyzing a workload per server across a cluster used to be a fragmented experience. If 3 read replicas serving a read-heavy app are inspected individually, you’re only getting a slice of the larger whole, having to manually flip between tabs and compute aggregate sums. In situations where a failover promotes a new primary, you’ll also have broken links in your bookmarks. These wrinkles are ironed out with the new cluster-wide Query Performance.
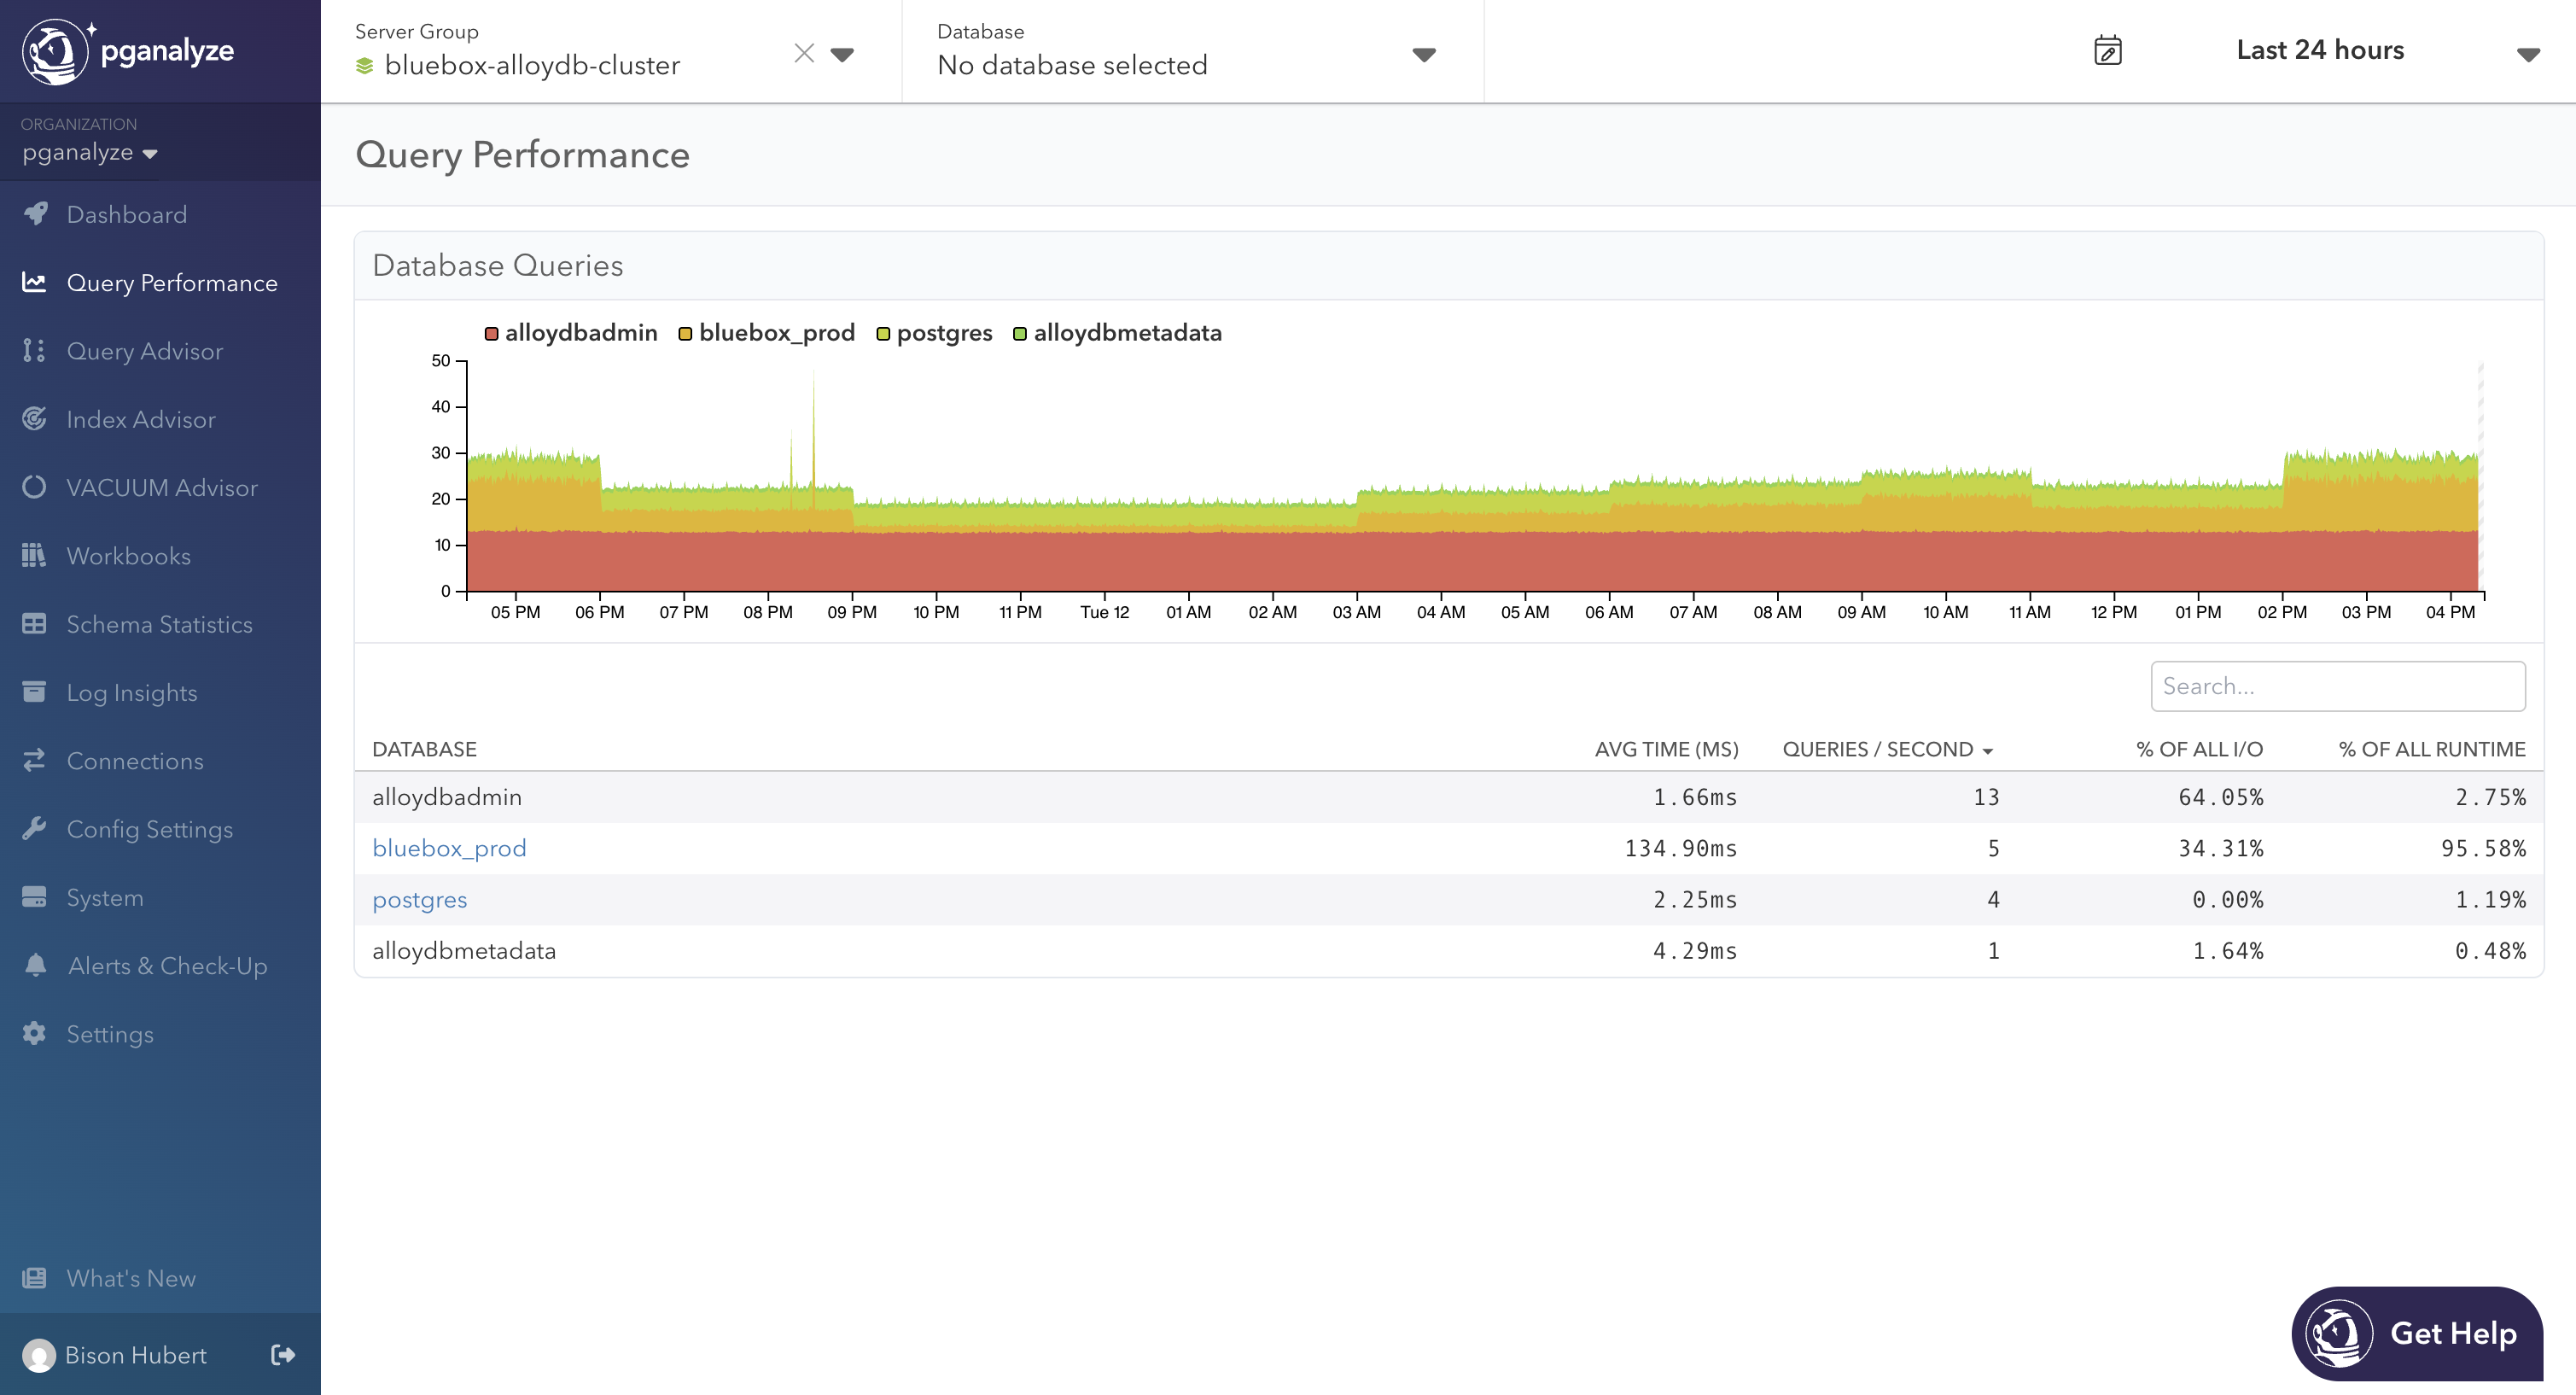
The top-level page lists every database group in the cluster. A database group is the set of databases with the same name across cluster members, combining bluebox_prod on the primary and every replica. For each group we show average query time, queries per second, % of total I/O, and % of total runtime aggregated across every member, with the option to exclude individual databases in the chart or selecting specific time ranges along the x-axis.
Clicking into a database group takes you to a familiar Query Performance view, with queries collected across each member of that group. From here you can further drill-down to a specific query running in a single instance, or switch between databases in the Database dropdown. The goal is to triage at the cluster level first by figuring out slow queries on the whole workload, scoping down to a specific server when needed.
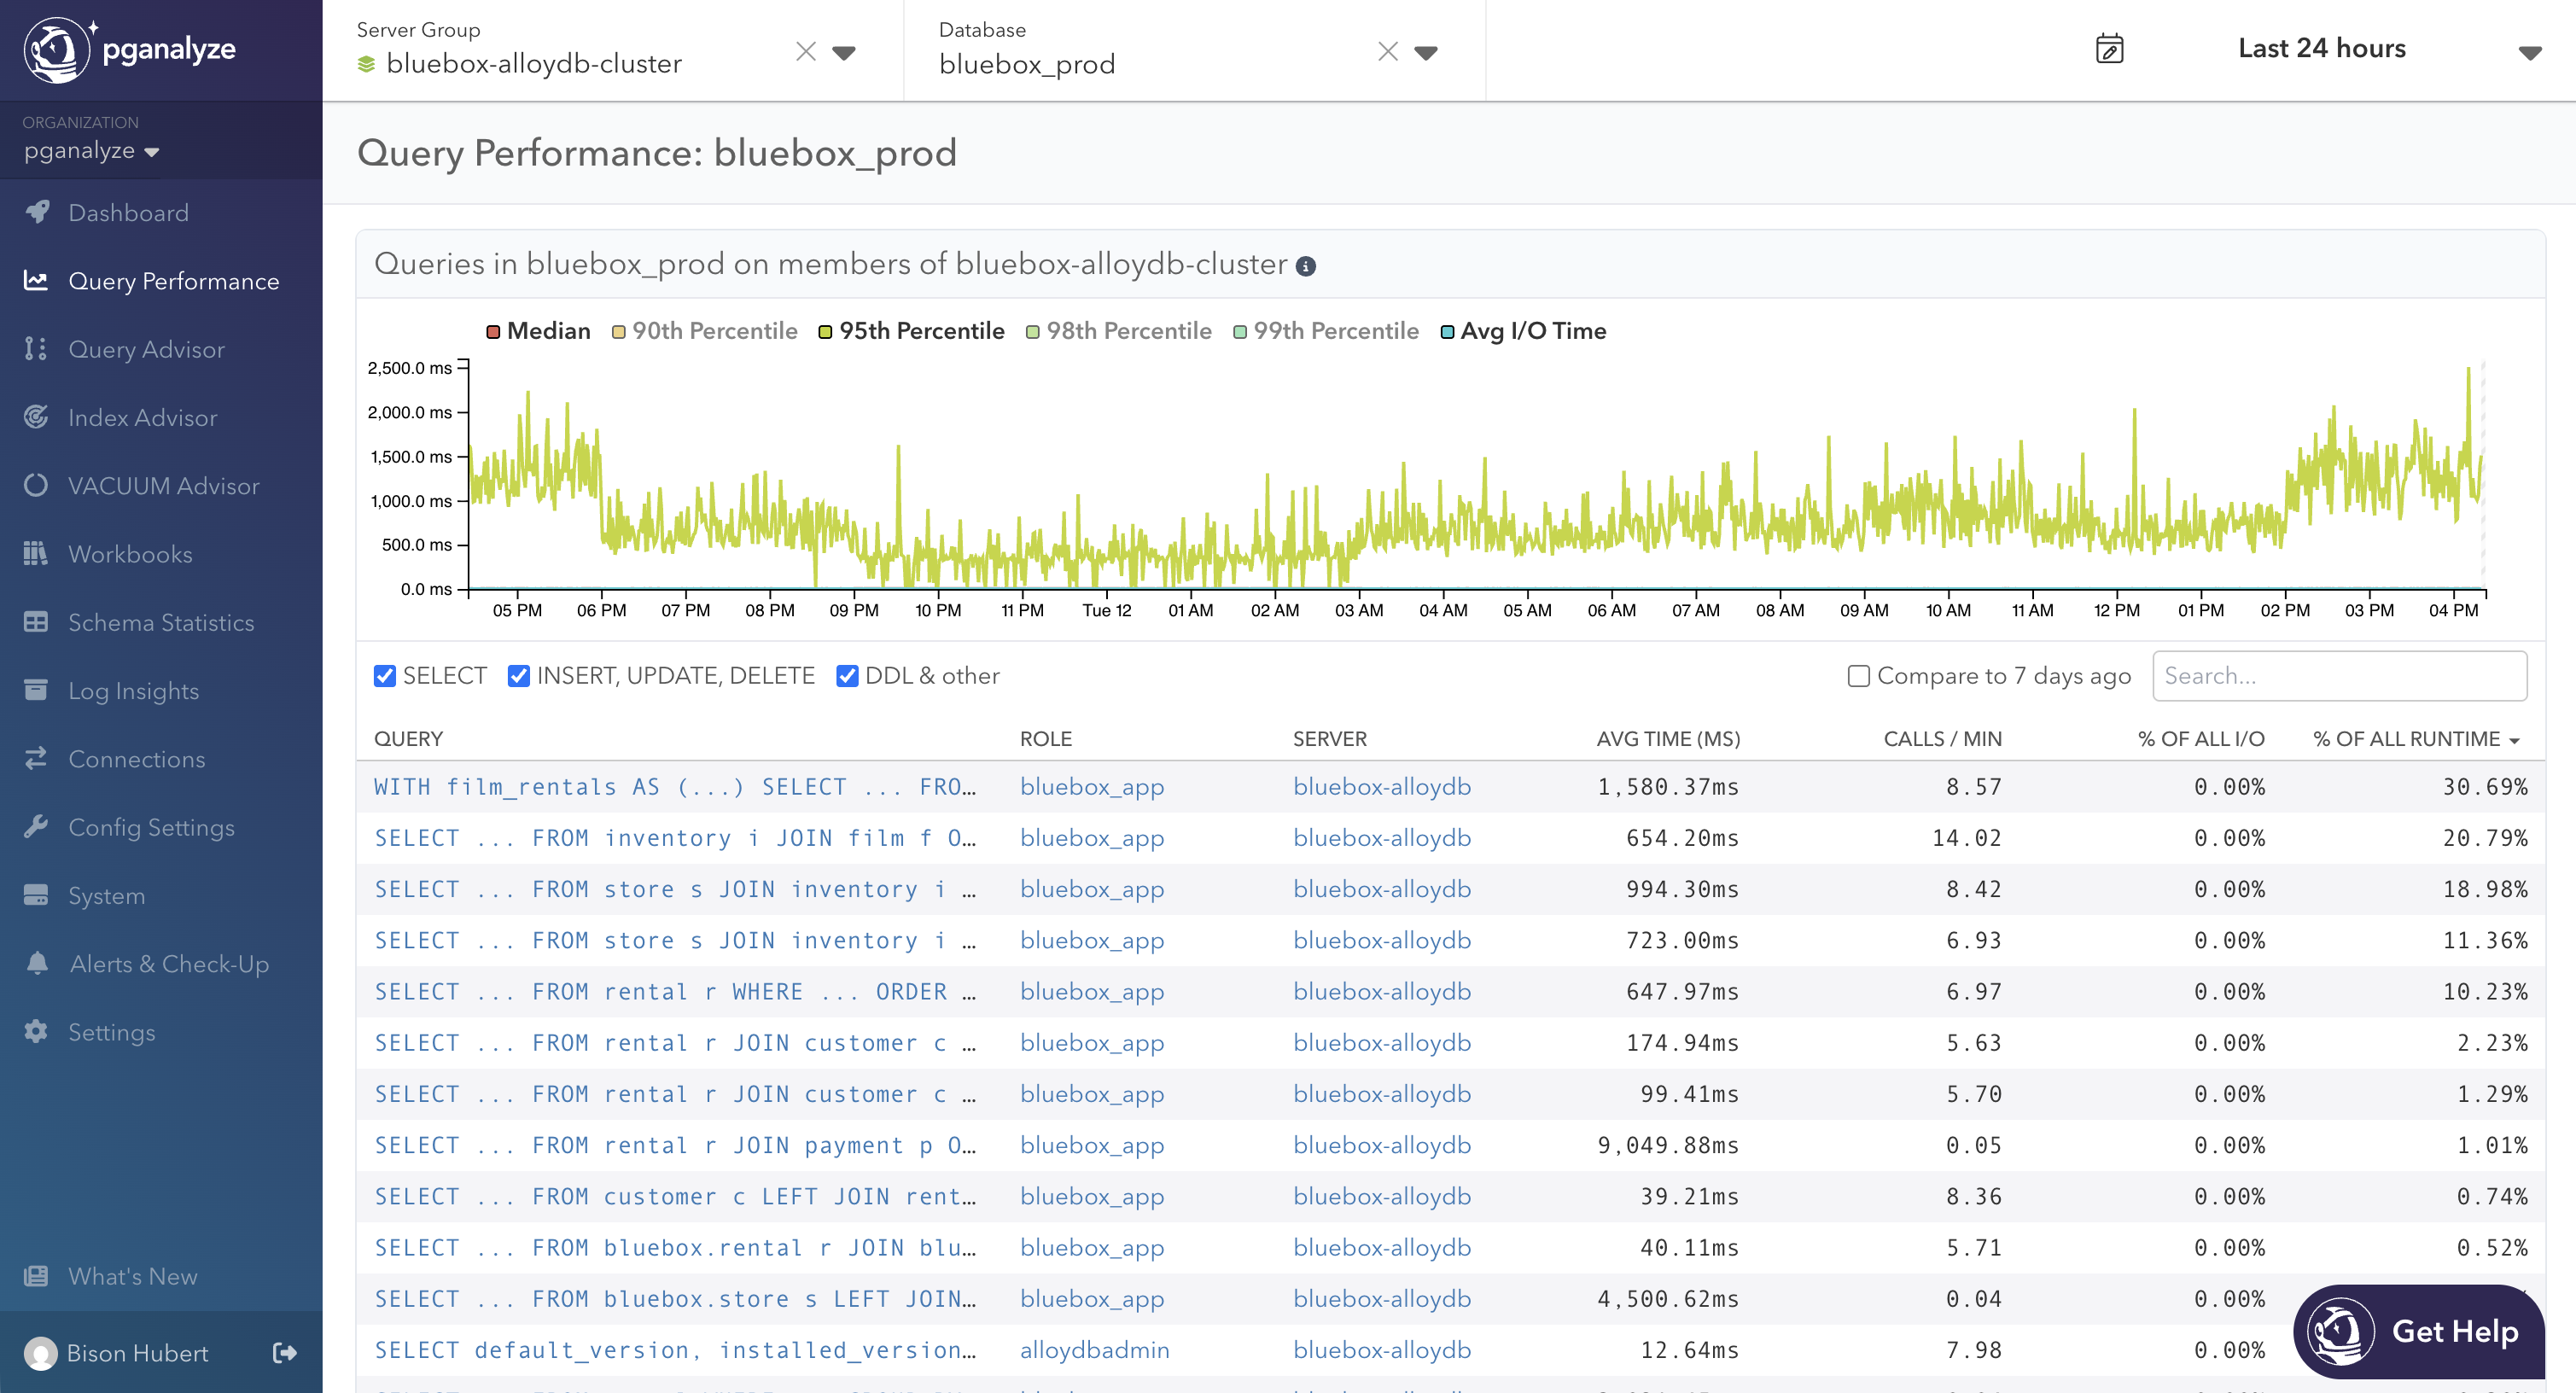
In this release, queries running on multiple servers will show up multiple times in the table. Merging these into a unified view is on the roadmap. Until then, treat the cluster view as a starting point, scoping down to a single server for more precise per-query stats.
Detecting Clusters
In many cases, detecting clusters is automatic, requiring zero config. The collector picks up cluster identifiers from the provider API. If you are running Amazon Aurora, RDS with clusters, Google AlloyDB, or Crunchy Bridge, clusters will be detected out-of-the-box.
For self-managed Postgres, the collector reads the Database system identifier from pg_controldata, which is identical on a primary and any replica created from it.
# pg_controldata /my/data-directory
pg_control version number:            1700
Catalog version number:               202406281
Database system identifier:           7583772938257241537
...
For Azure, RDS without defined clusters, or another environment where the provider doesn’t expose a cluster ID, you can manually configure api_cluster_id in the collector config to group servers:
[server1]
db_host = my-db-primary.postgres.database.azure.com
...
api_cluster_id = my-db

[server2]
db_host = my-db-replica.postgres.database.azure.com
...
api_cluster_id = my-db
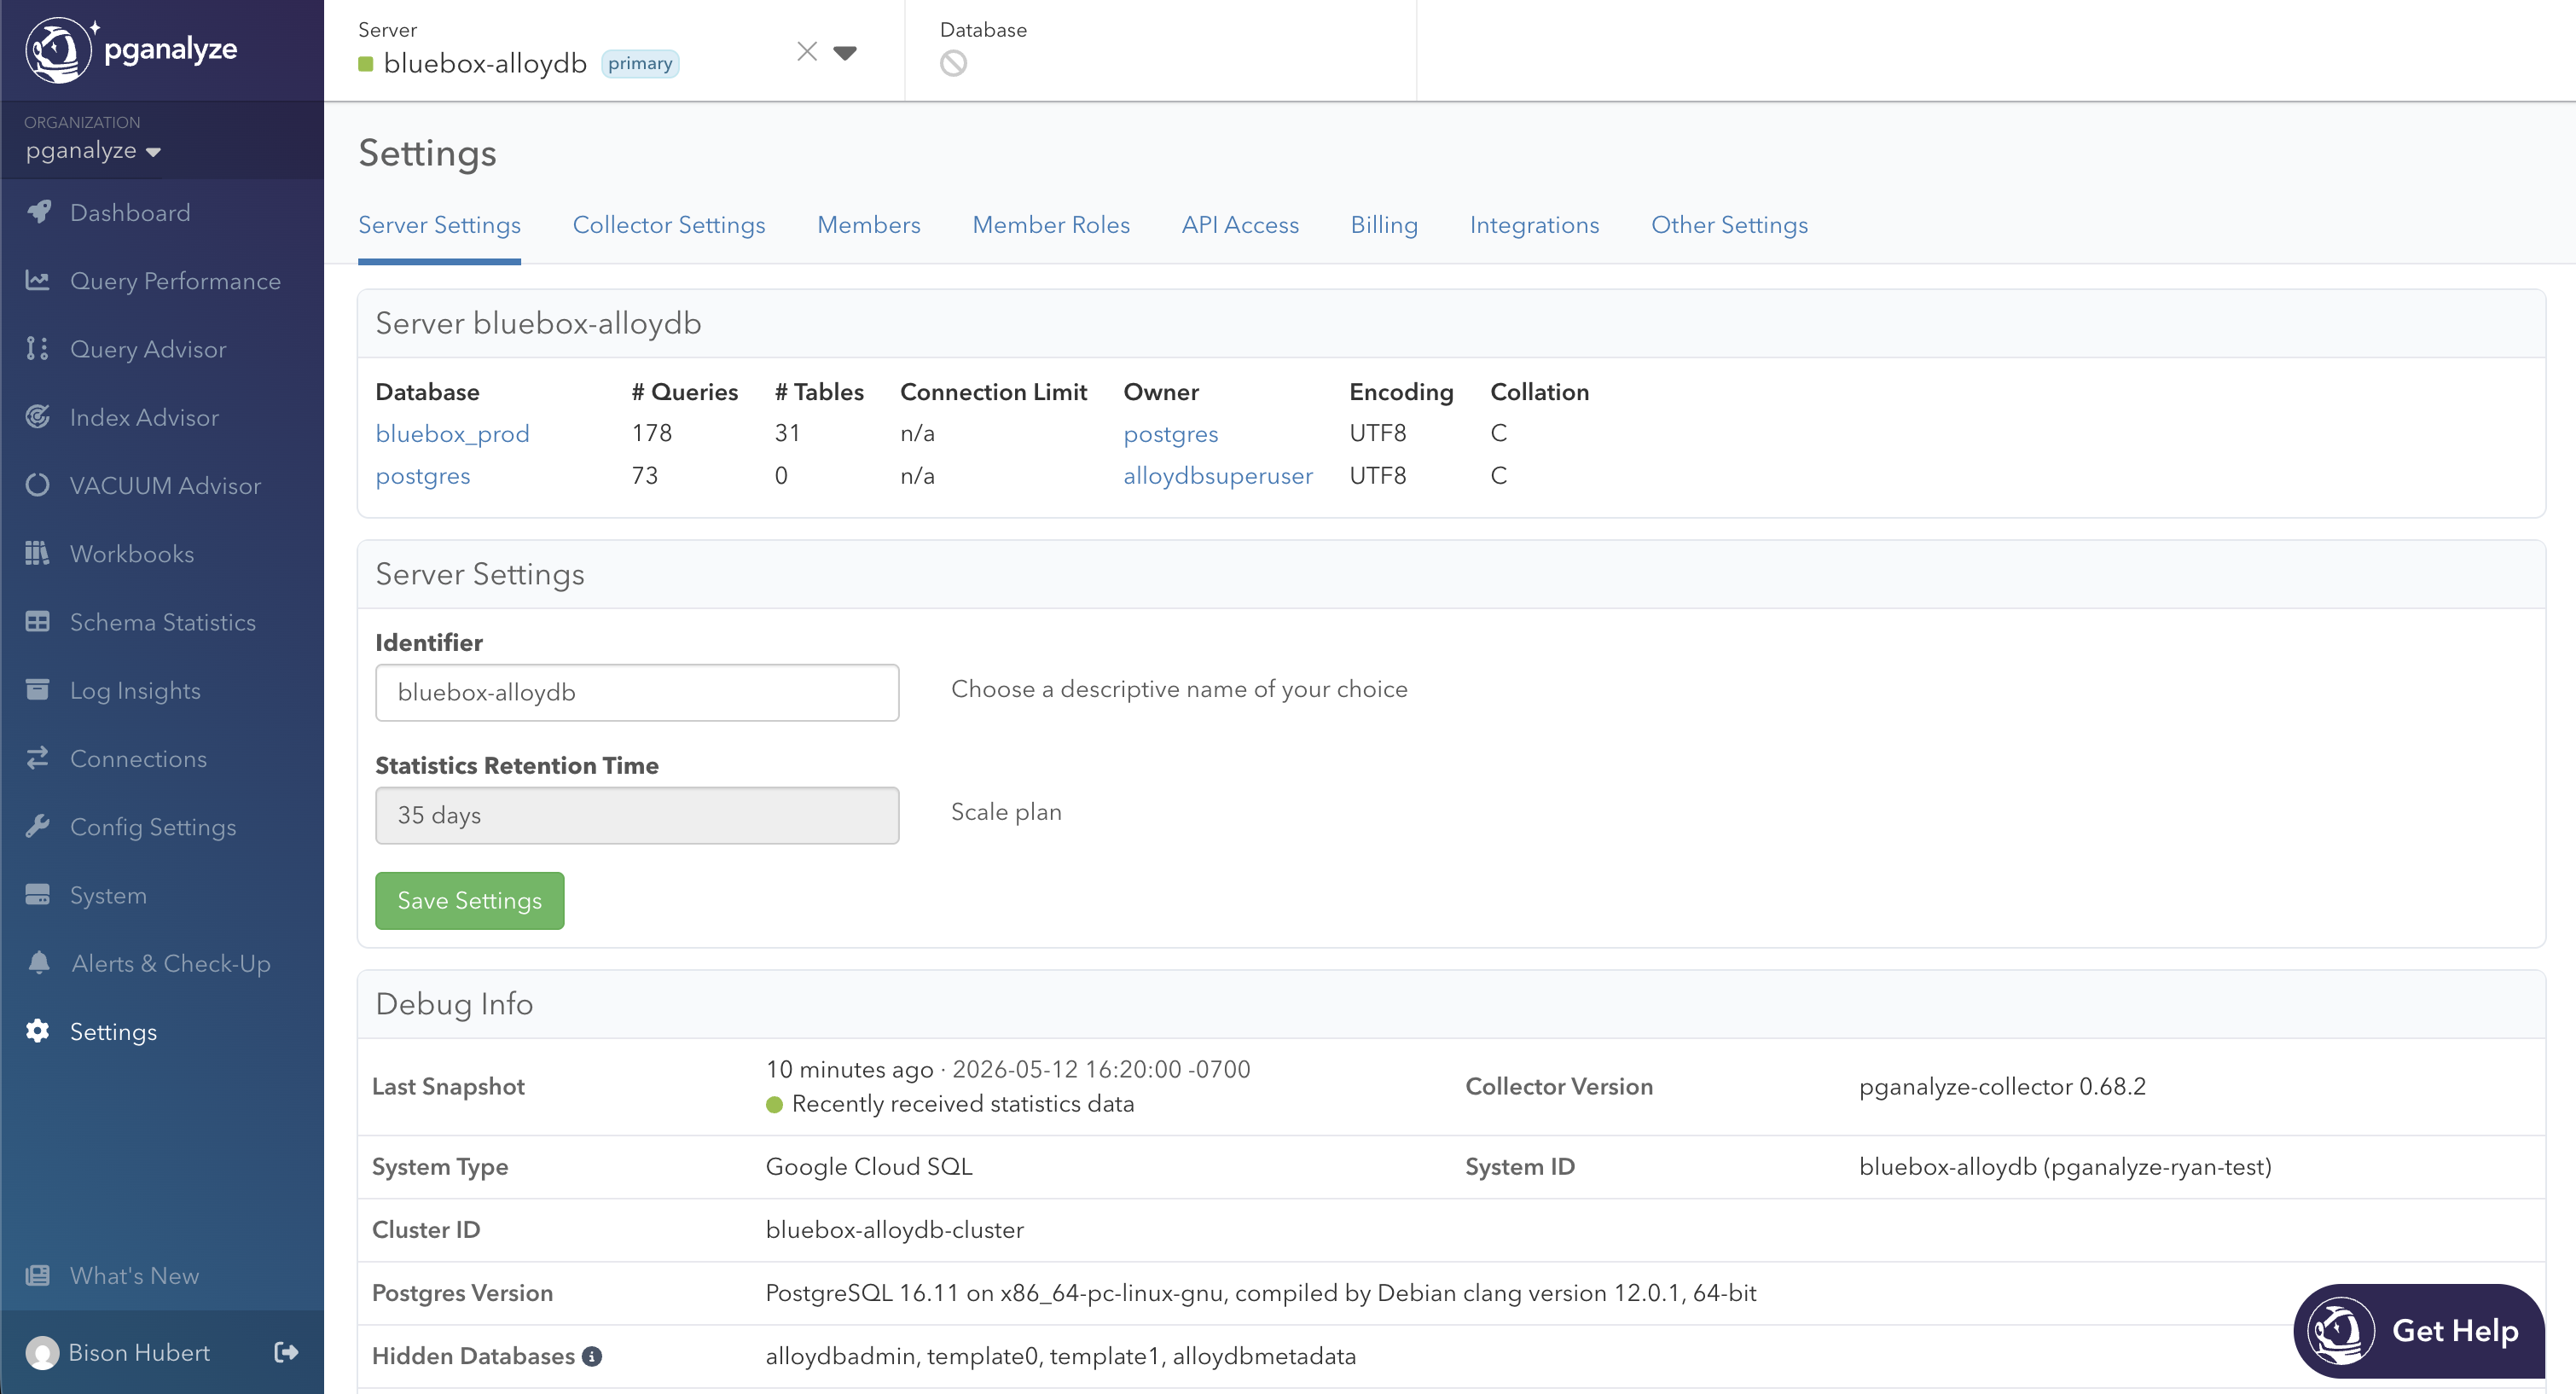
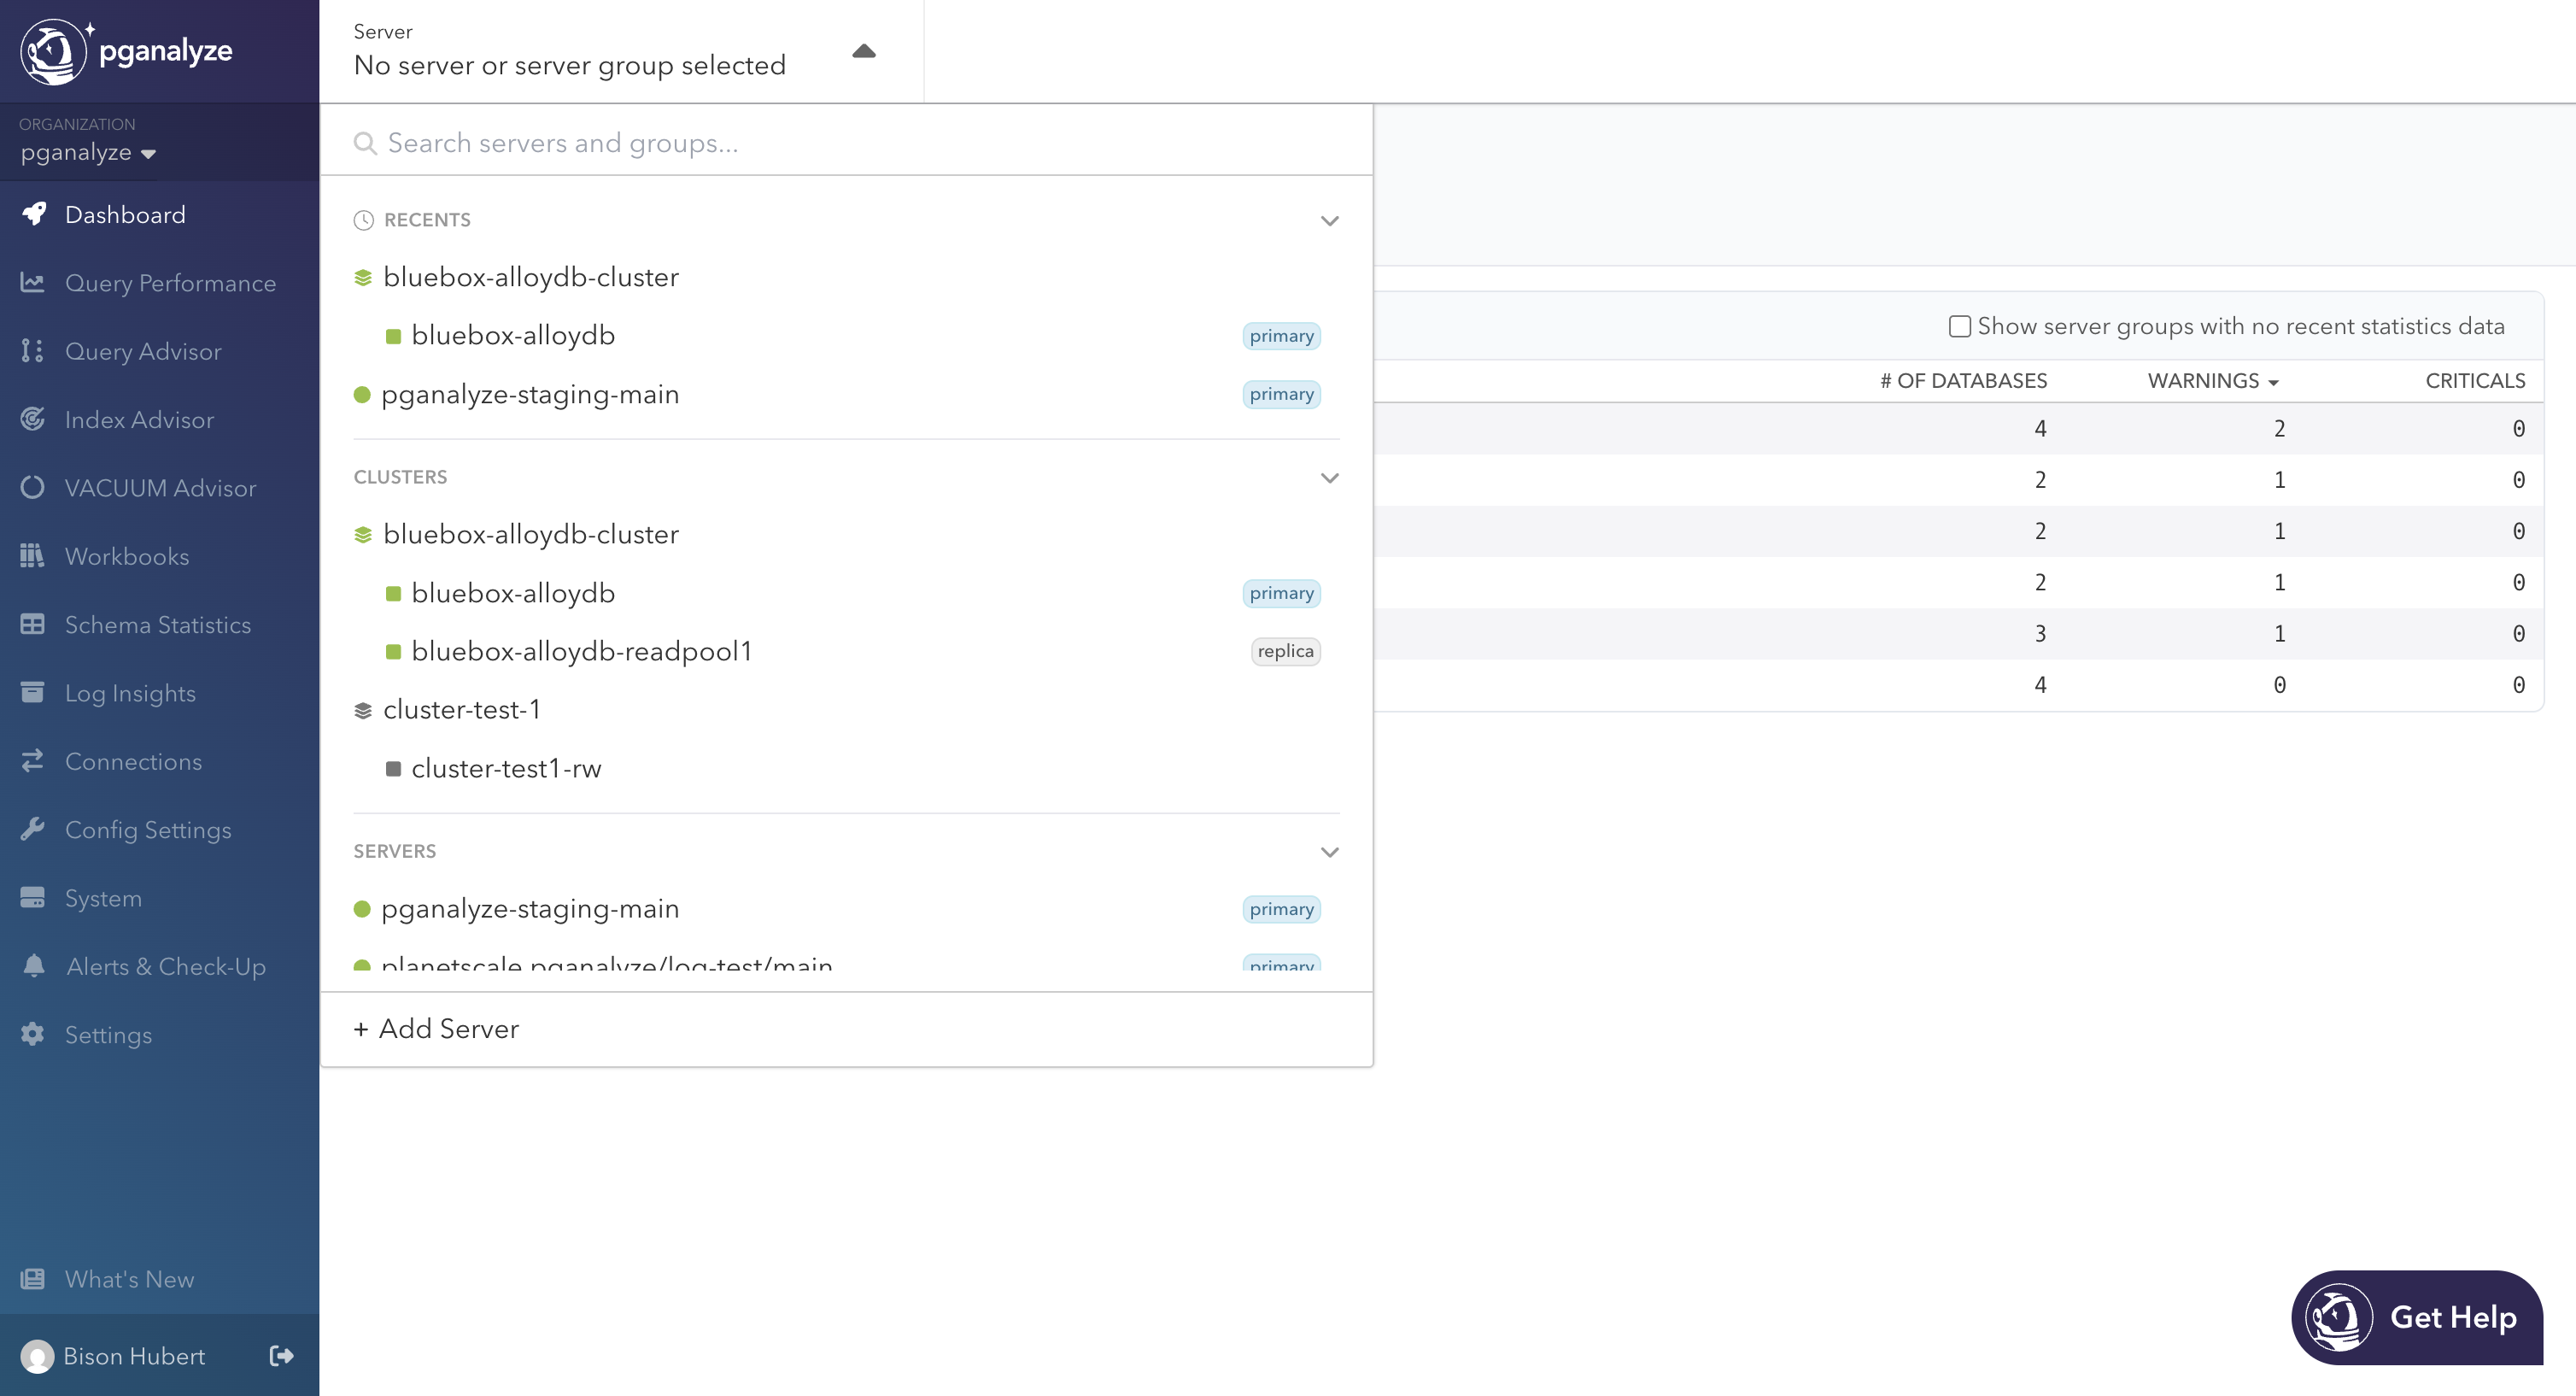
If you’re unsure which cluster a server belongs to, or you just want to run a sanity check, the Debug Info panel in Settings > Server Settings now surfaces the Cluster ID when available. This way you can verify that your replicas are grouped as expected.
Additionally, the server dropdown in the header is a one-stop-shop to see all of this. Below recents, you’ll find a new Clusters section with primaries and their replicas, along with status icons that bubble up from members to the cluster. With a cluster selected, you can view the Dashboard or Query Performance pages. Navigating away from either will move you onto the cluster primary by default.
Scoping Access by Cluster
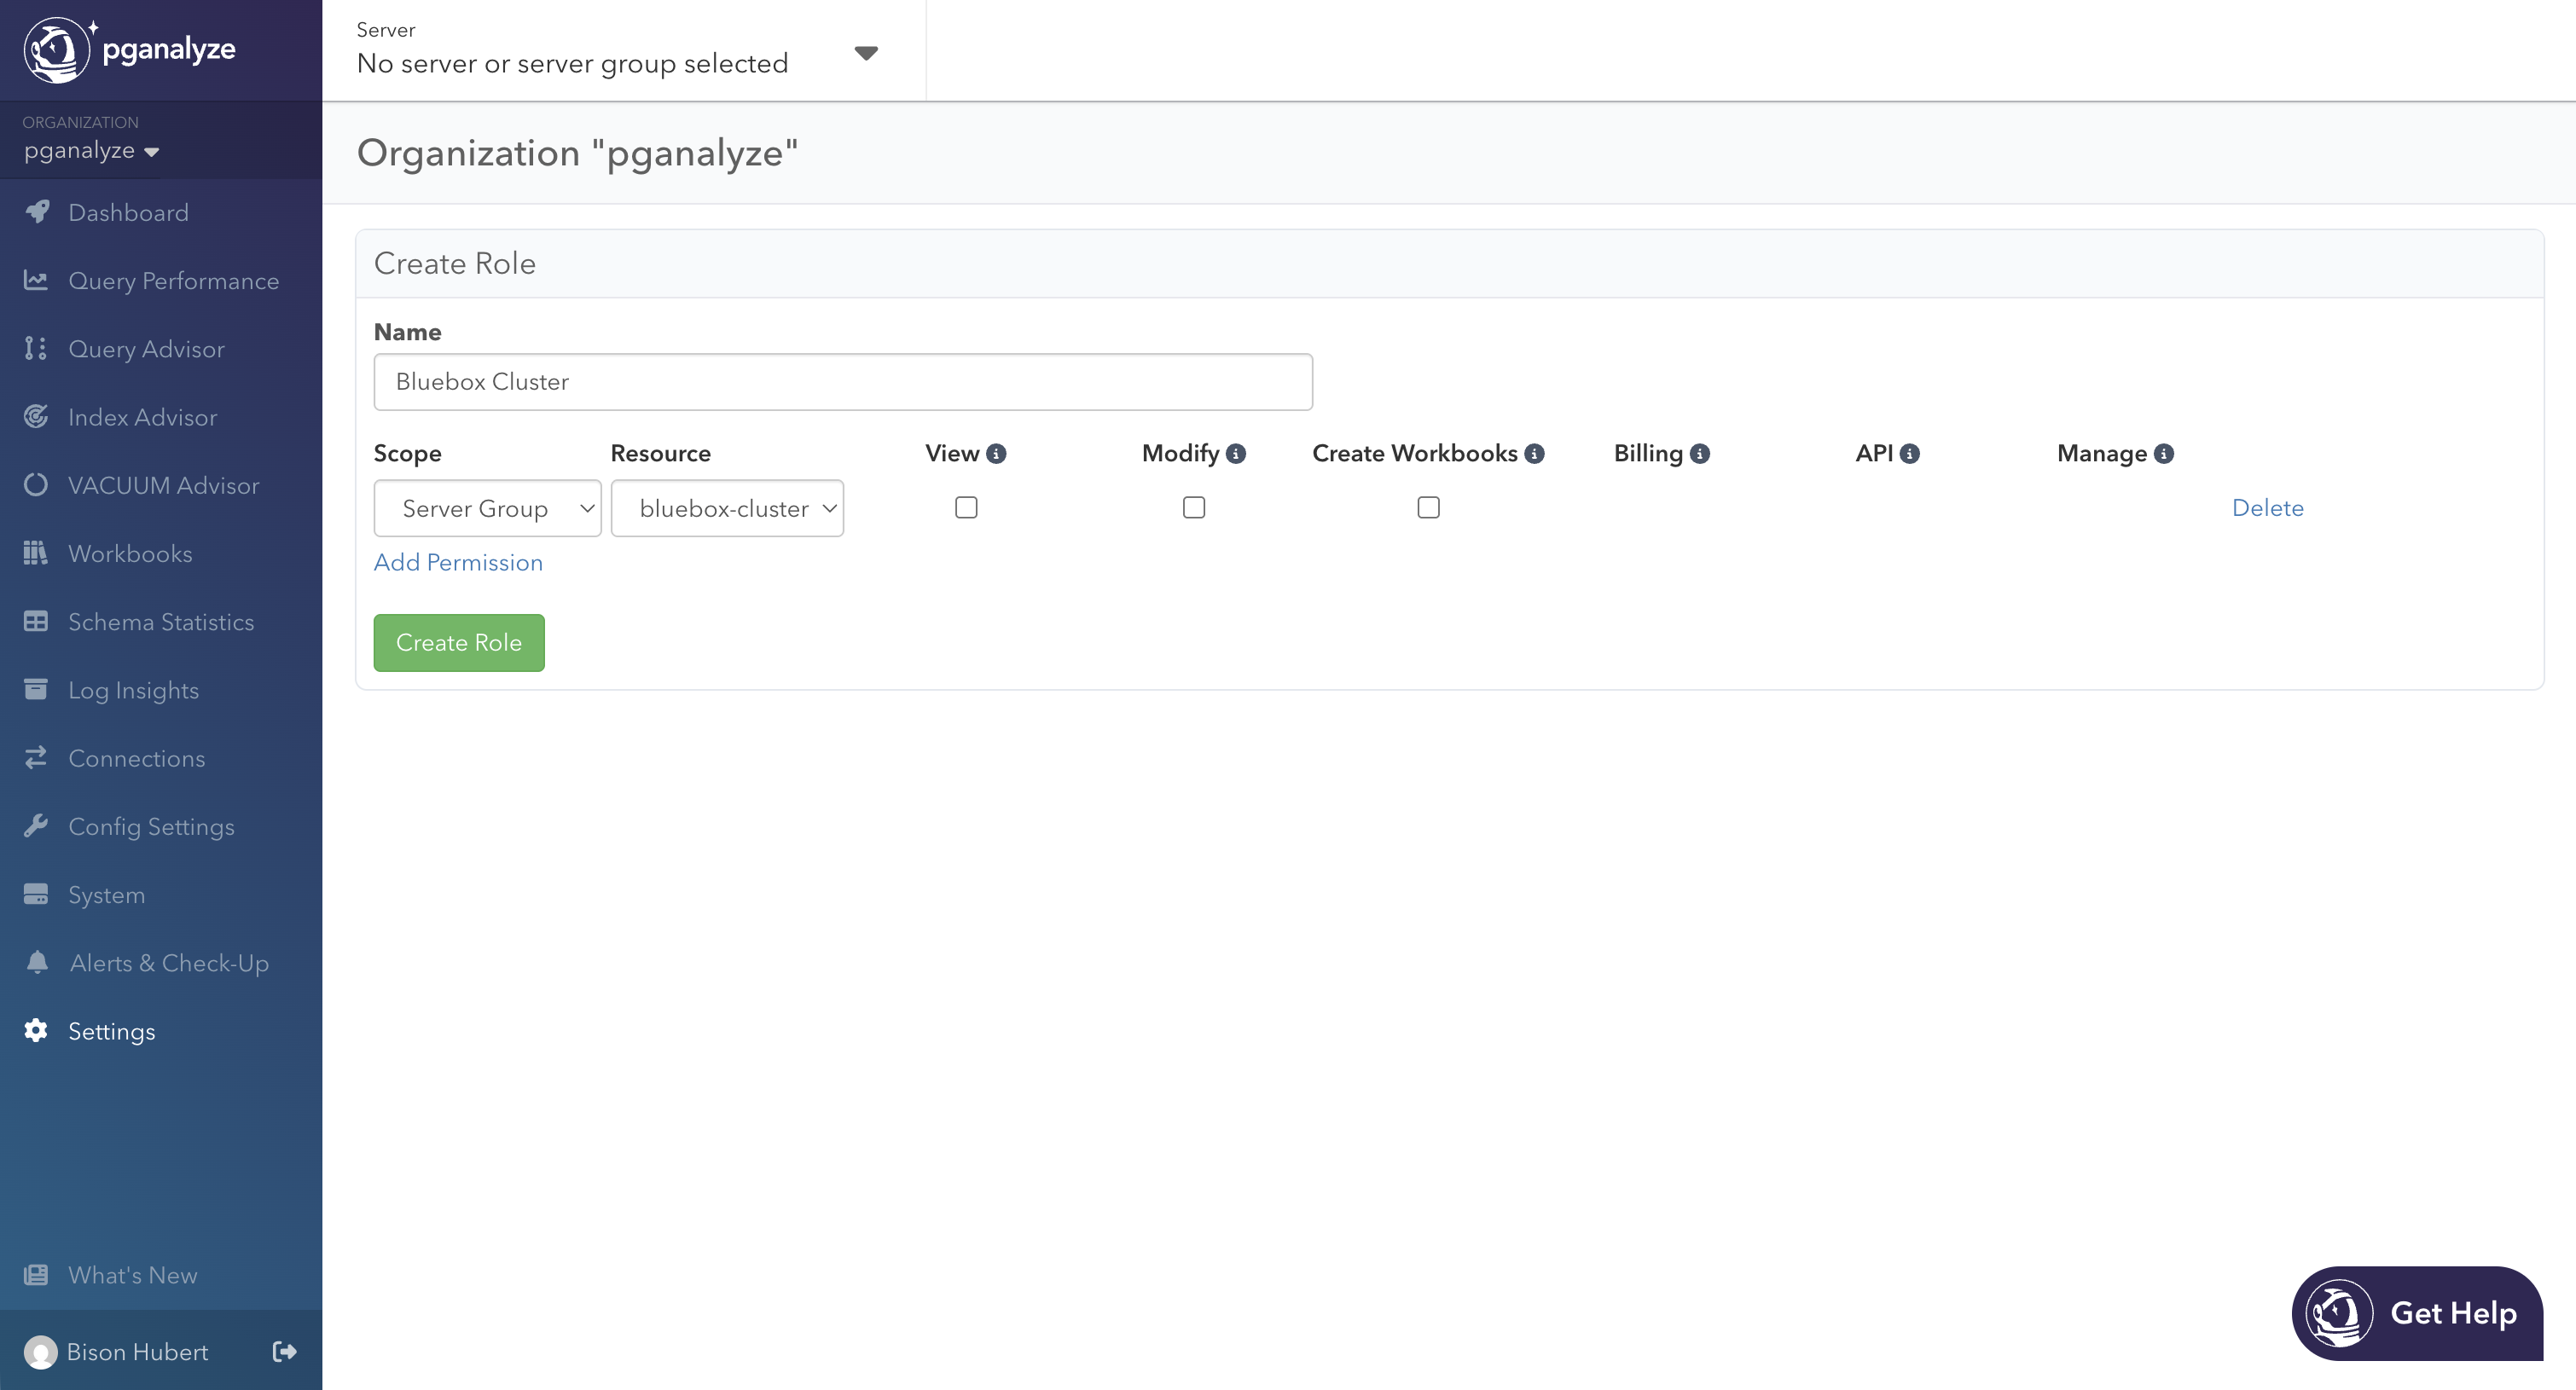
Server Groups also become a unit of access control. When you create or edit a role in Settings > Member Roles, the scope dropdown has a Server Group option. A role scoped to a server group can only see and act on the cluster’s members and their databases. This becomes useful when a team owns one cluster in a larger org, or when you want a read-only role locked to a specific environment. Additionally, members scoped to a server or a database in a cluster will be able to see that cluster through the header navigation and the Server Groups dashboard. Other servers in the cluster will remain inaccessible.
On the Roadmap
The release of cluster-based server groups is only the beginning. We are actively working on the next round of features. Here’s a summary of what to expect later this year:
- Server Groups beyond Postgres clusters. Instead of being bound to a shared schema, you can group servers by team, environment, or region, and use the same dashboard and Query Performance views to analyze across them
- Member access scoped to custom groups. Today you can scope a role to a cluster. Once custom server groups ship, this mechanism will support both. Assign a “QA” group to your QA team and they’ll see only those servers in the dashboard, dropdowns, and Query Performance pages
- pganalyze MCP Server integration for server groups, so you can ask the pganalyze MCP server about a cluster the same way you’d ask about a single server
- More cluster and server group scope for the rest of pganalyze, including a unified Query Performance view that merges queries appearing on multiple members
Try it Now
Cluster-based server groups are available now for all pganalyze cloud customers, providing enhanced navigation, a fleet-level triage dashboard, and cluster-wide Query Performance that lets you drill-down to a single query on a single server. Enterprise Server customers can upgrade to v2026.05.0 to get this functionality.