
Comparing EXPLAIN Plans is hard (and how pganalyze does it)
 By Maciek Sakrejda
The Postgres EXPLAIN command is invaluable when trying to understand query performance. SQL is a declarative language, and the Postgres query planner will decide the most efficient way to execute a query. However, plan selection is based on statistics, configuration settings, and heuristics—not a crystal ball. Sometimes there’s a substantial gap between what the planner thinks is most efficient and reality. In those situations, EXPLAIN can help Postgres users understand the planner’s “reasoning” in selecting a particular plan.
In this post, we’ll walk through EXPLAIN plan fundamentals, why it’s helpful to compare EXPLAIN plans and the challenges presented by existing tools. We’ll also discuss how that that influenced our product roadmap at pganalyze to create a text-based diff interface, which we first rolled out as part of the beta release of Query Tuning Workbooks earlier this year. Now, we’re expanding that same functionality to the EXPLAIN plan list under query details and adding a new comparison metric, buffers.
Existing plan comparisons
Sometimes, a single query can end up being executed with several different plans (e.g., due to statistics that vary with query parameters), and understanding a suboptimal plan is often easier when contrasted with a “good” plan. One can figure out the differences and what’s causing them, and rewrite the query to pick a more optimal plan.
Unfortunately, Postgres plans are not easy to understand, let alone to compare. We wanted to provide an easier way to review the differences between plans. The EXPLAIN command goes back all the way to Postgres95, the first community open-source, SQL-based release. But comparing EXPLAIN output still seems to be a fairly ad-hoc process now, thirty years later.
Take a simple query like
SELECT * FROM pg_class WHERE relname = 'pg_class'
By default, you will likely get a regular index scan:
                                                          	QUERY PLAN
---------------------------------------------------------------------------------------------------------------------------------------
 Index Scan using pg_class_relname_nsp_index on pg_class  (cost=0.27..8.29 rows=1 width=273) (actual time=0.033..0.035 rows=1 loops=1)
   Index Cond: (relname = 'pg_class'::name)
   Buffers: shared hit=3
 Planning Time: 0.127 ms
 Execution Time: 0.060 ms
(5 rows)
If regular index scans are disabled, you’ll get a bitmap index scan followed by a bitmap heap scan:
                                                        	QUERY PLAN
-----------------------------------------------------------------------------------------------------------------------------------
 Bitmap Heap Scan on pg_class  (cost=4.28..8.29 rows=1 width=273) (actual time=0.027..0.029 rows=1 loops=1)
   Recheck Cond: (relname = 'pg_class'::name)
   Heap Blocks: exact=1
   Buffers: shared hit=3
   ->  Bitmap Index Scan on pg_class_relname_nsp_index  (cost=0.00..4.28 rows=1 width=0) (actual time=0.019..0.020 rows=1 loops=1)
     	Index Cond: (relname = 'pg_class'::name)
     	Buffers: shared hit=2
 Planning Time: 0.157 ms
 Execution Time: 0.087 ms
(9 rows)
Comparing something like this by looking at the two plans side-by-side is pretty straightforward because the plan is small, but once you need to compare larger plans, you may want a better mechanism. There are no EXPLAIN-specific comparison tools, but GNU diff has been around since the early seventies (Wikipedia has a nice overview of the history), and is still a go-to tool for comparing text files. But diff output of the plans above is not very usable:
1,4c1,5
<                                                           	QUERY PLAN
< ---------------------------------------------------------------------------------------------------------------------------------------
<  Index Scan using pg_class_relname_nsp_index on pg_class  (cost=0.27..8.29 rows=1 width=273) (actual time=0.033..0.035 rows=1 loops=1)
<	Index Cond: (relname = 'pg_class'::name)
---
>                                                         	QUERY PLAN
> -----------------------------------------------------------------------------------------------------------------------------------
>  Bitmap Heap Scan on pg_class  (cost=4.28..8.29 rows=1 width=273) (actual time=0.027..0.029 rows=1 loops=1)
>	Recheck Cond: (relname = 'pg_class'::name)
>	Heap Blocks: exact=1
6,8c7,12
<  Planning Time: 0.127 ms
<  Execution Time: 0.060 ms
< (5 rows)
---
>	->  Bitmap Index Scan on pg_class_relname_nsp_index  (cost=0.00..4.28 rows=1 width=0) (actual time=0.019..0.020 rows=1 loops=1)
>      	Index Cond: (relname = 'pg_class'::name)
>      	Buffers: shared hit=2
>  Planning Time: 0.157 ms
>  Execution Time: 0.087 ms
> (9 rows)
It shows us lines that are due to differences in plan structure, but also some differences due to cost estimates, timing or I/O differences, or other irrelevant details.
Building a bespoke EXPLAIN plan comparison
We experimented with a couple of different approaches to improve this experience when using pganalyze for recording and comparing query plans. We settled on an interface built on a text-based diff of the text output (inspired by diff and GitHub’s git changeset rendering), but optimized for understanding the most important EXPLAIN plan differences:
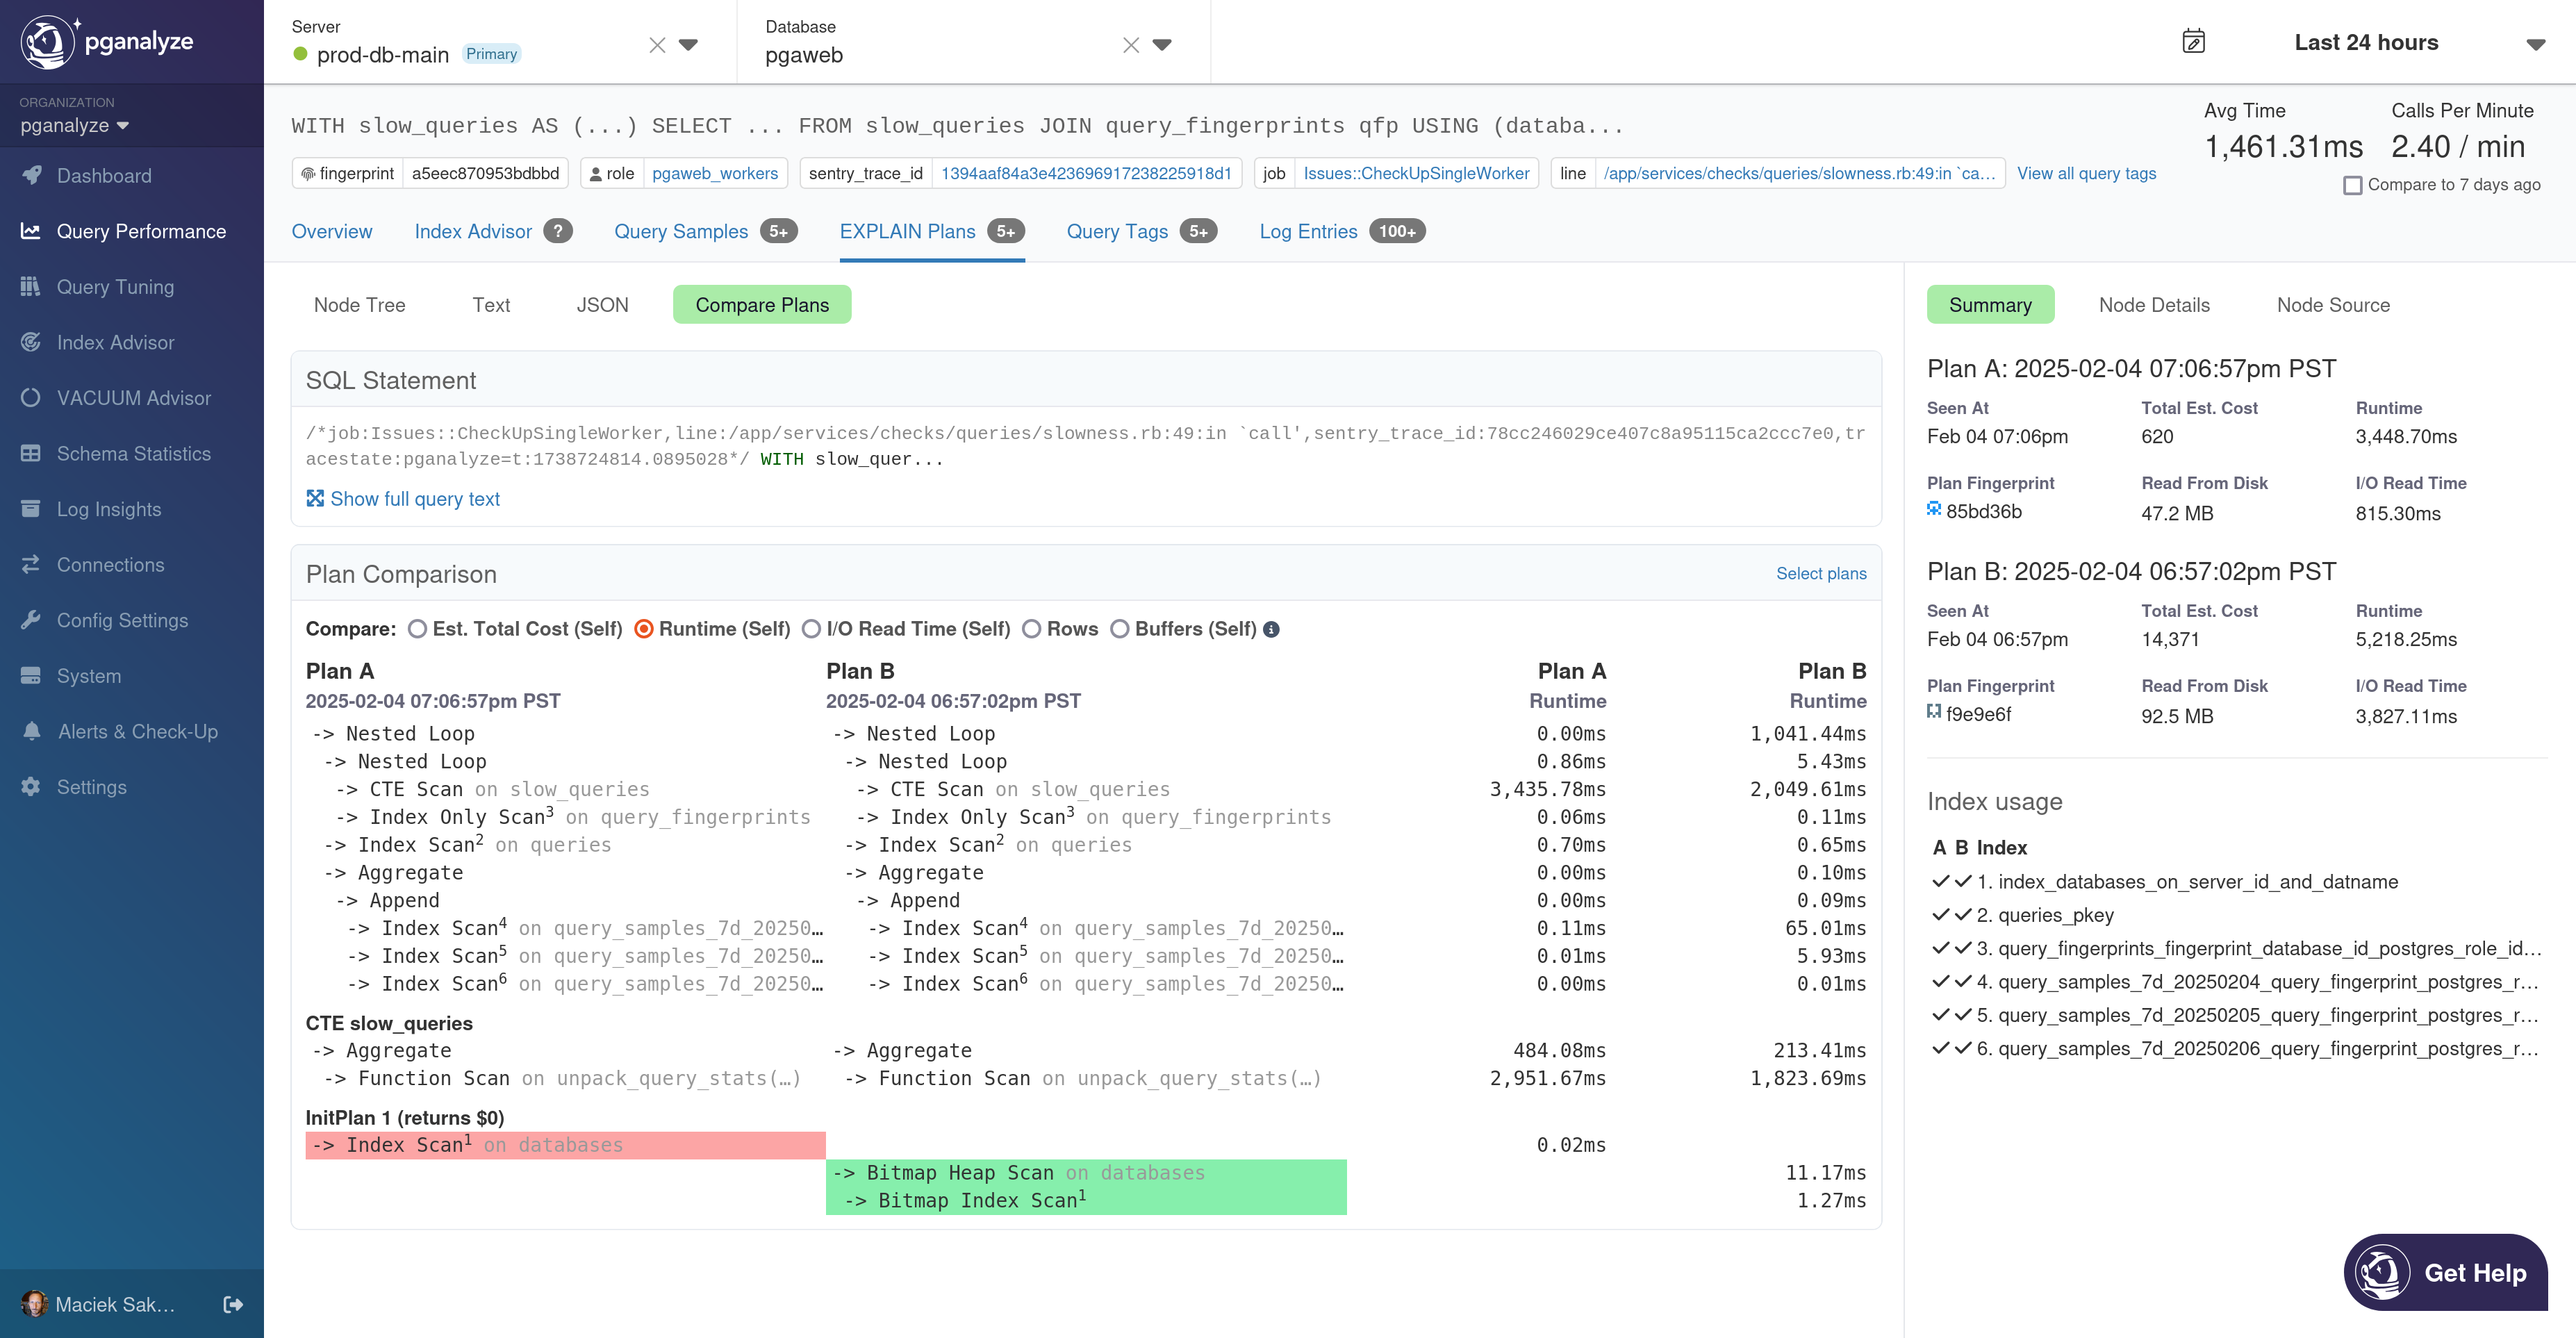
The plans in the comparison are rendered to focus on the plan structure (since this is usually what leads to the biggest performance differences between plans). Changes in runtime or I/O will not show up as a difference between plans, but you can select a comparison metric to focus on, and see the values of that metric for each node in the plan. You can also click on a node in either Plan A or Plan B to see details about that node, just like when viewing full EXPLAIN plans.
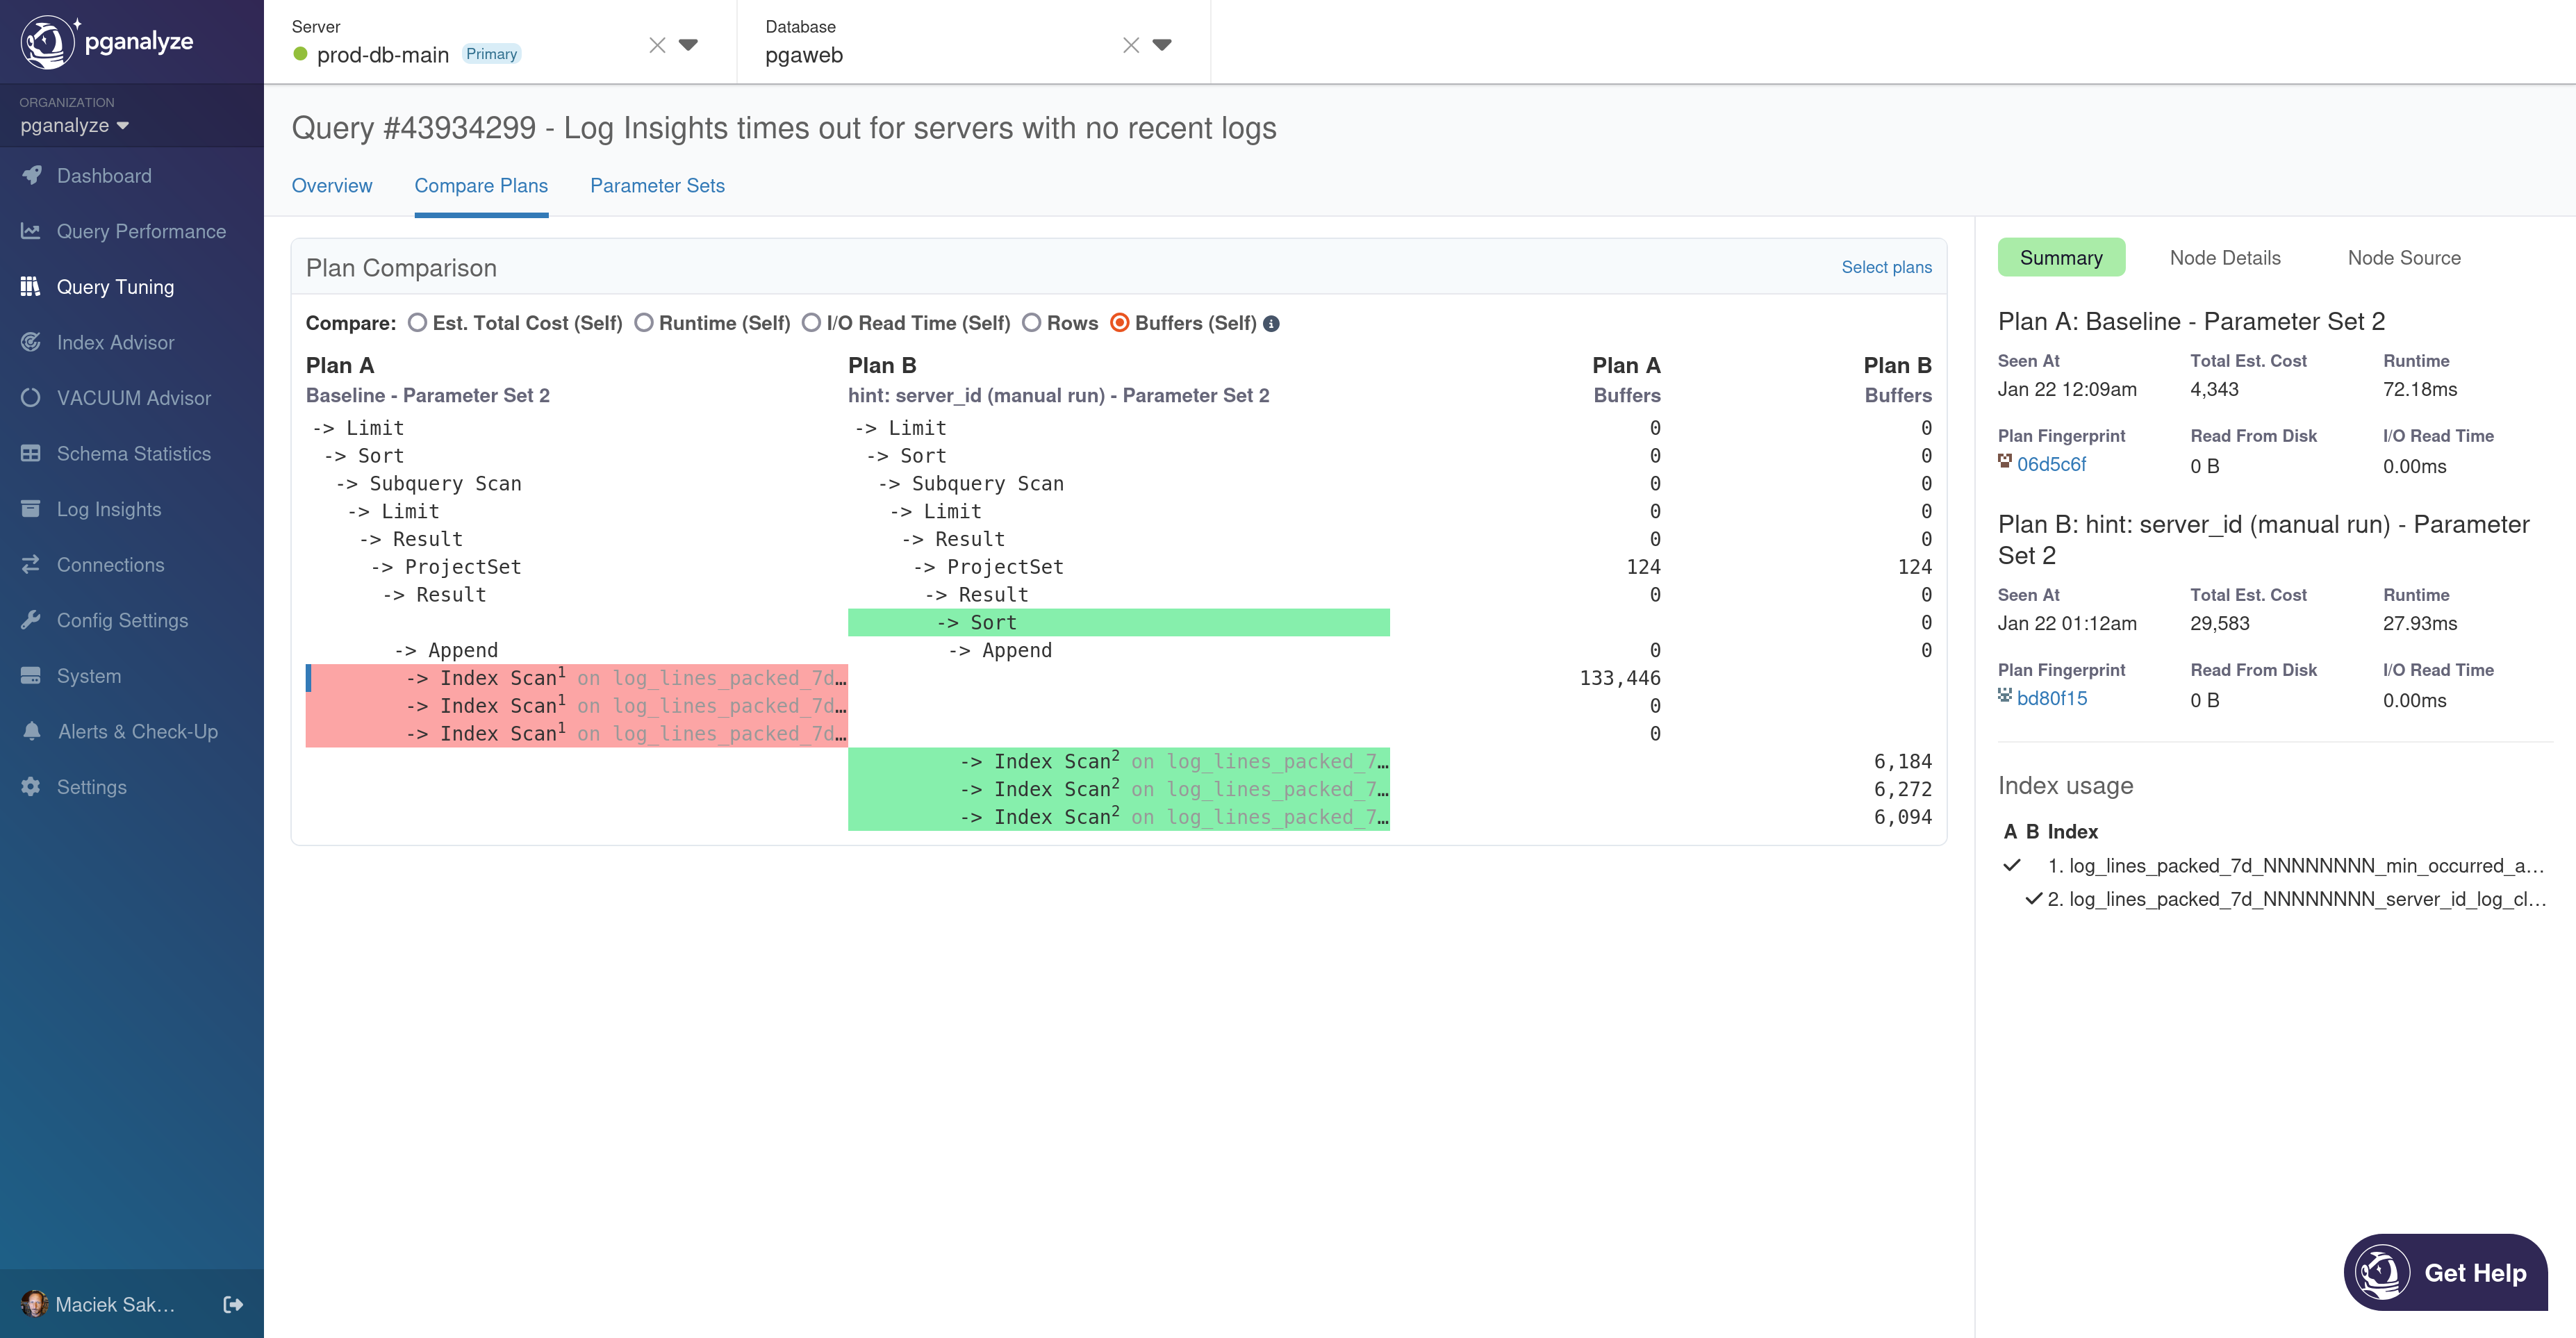
As mentioned, we first introduced EXPLAIN plan comparison as part of the Query Tuning Workbooks feature we launched in beta. When tuning a query, being able to compare plans easily is extremely useful.
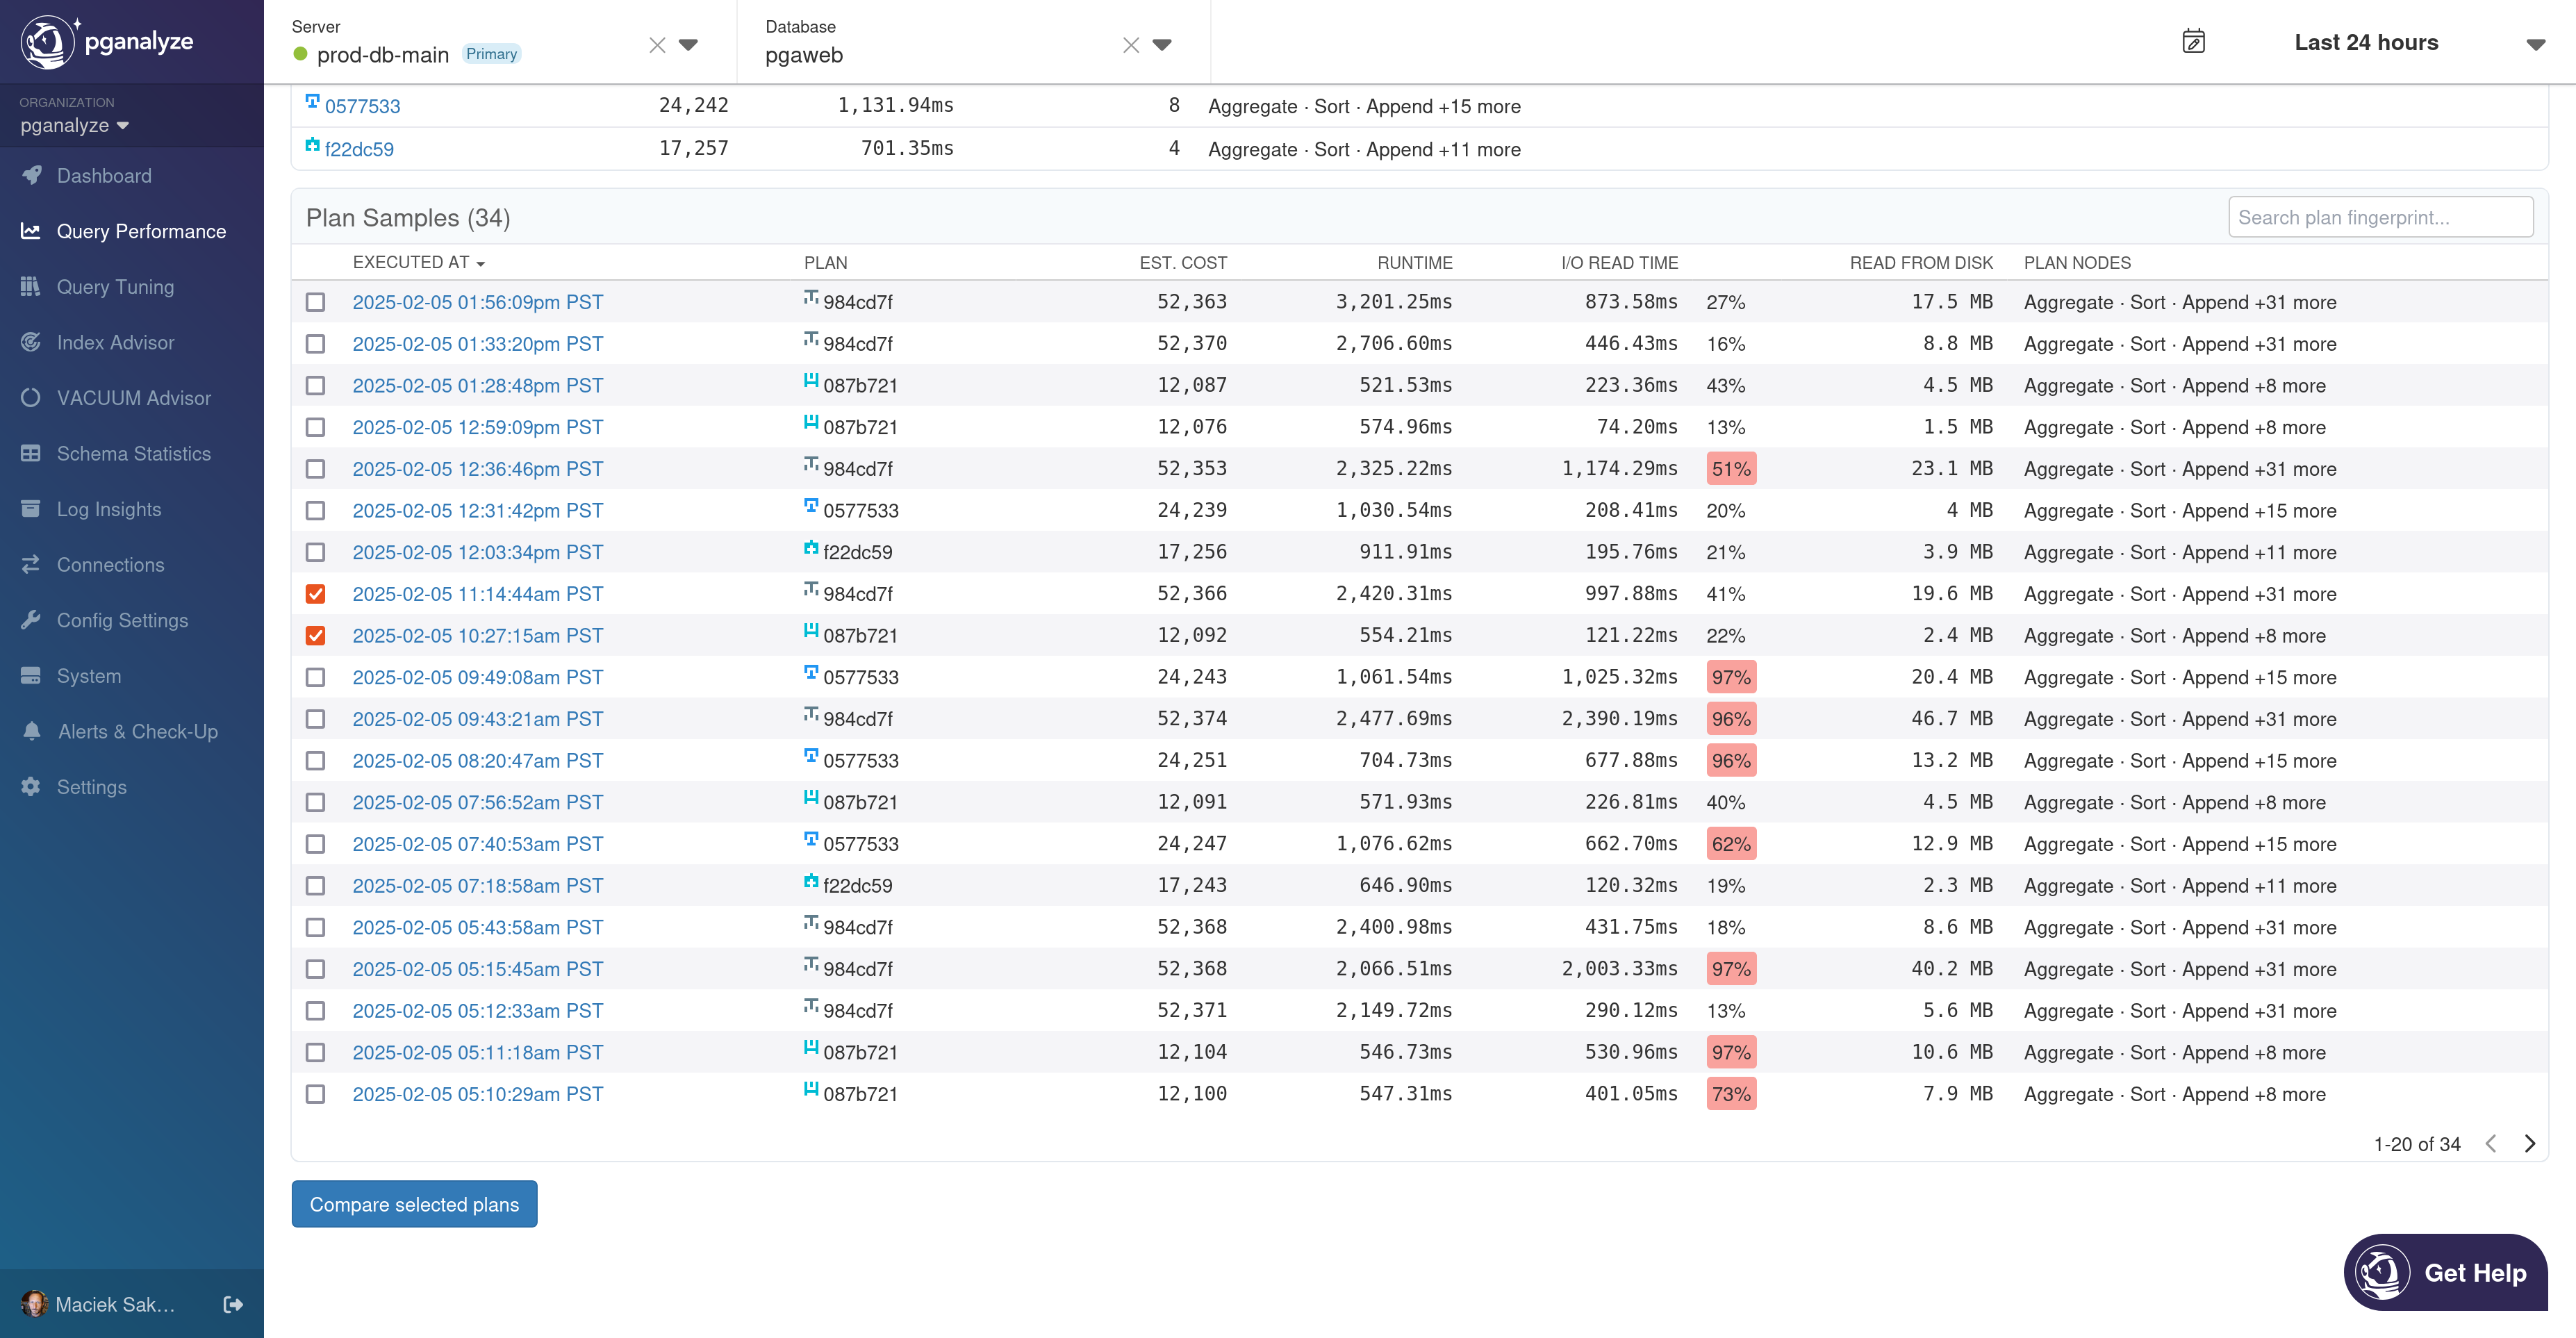
Today we’re extending this functionality to the query EXPLAIN plan list, for plans captured through Automated EXPLAIN. When multiple distinct plans for a query exist, it can be hard to understand what the differences are. Now, you can select two plans on the Query Detail page for a specific query to see their comparison:
As part of this release, we’re also adding buffers used as one of the execution metrics to comparisons. Buffer usage can be tricky to compare because buffer hits can be double-counted in Postgres’ current statistics accounting. But the sources of double-counting are somewhat limited: most of that happens in Nested Loop joins, and sometimes with Index Scans. It can’t always reliably be used to determine “how much data did this query load” with a warm cache, but it can still be useful to compare two plans with a similar structure.
In Summary
We’re excited to expand our EXPLAIN comparison feature beyond Query Tuning Workbooks, and we hope you’ll find this feature useful. If you’re an existing user, you can find the feature on the EXPLAIN Plans tab of the Query Detail page under Query Performance. If you’re new to pganalyze, visit our Getting Started Guide and sign up for a free trial today.