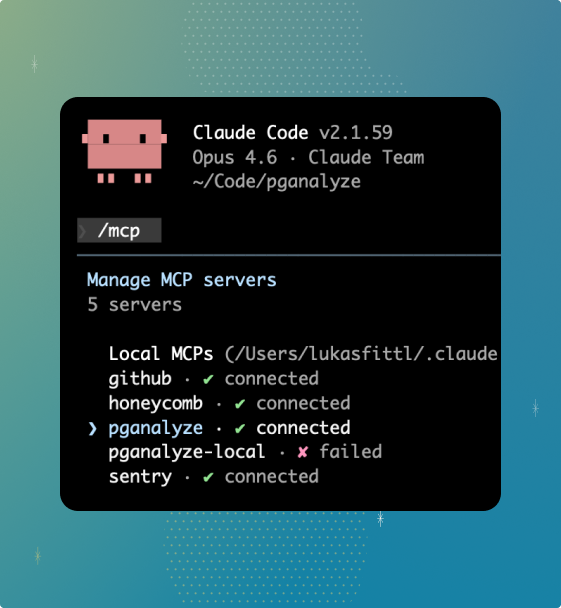
Tuning Postgres Safely with AI Tools & MCP Servers
AI tools can help debug Postgres performance issues, but only if they have the right context. Learn how Model Context Protocol (MCP) lets you safely share production data with tools like Claude, without the risks of generic database access.
In this webinar, you will:
- Use AI tools like Claude for Postgres performance work without compromising production safety
- Understand the risks of existing MCP servers and how purpose-built abstractions solve them
- See real-world MCP architecture patterns, including how Robinhood approaches this problem
- Get a first look at the upcoming pganalyze MCP Server
Running Postgres on AWS: What’s New & How It Impacts Performance
Running Postgres on AWS gives you powerful managed infrastructure but also limits how much you can see under the hood. Learn what’s publicly known about how RDS Postgres and Aurora behave internally, how they differ from self-managed Postgres, and what you actually need to monitor to keep performance stable. We’ll also explore an alternative deployment model using the CloudNativePG operator on Amazon EKS and when it makes sense over RDS or Aurora.
In this webinar, we will discuss:
- How Aurora’s distributed storage engine changes checkpoints, replication, and failover
- Key differences between RDS, Aurora, and Postgres on Kubernetes (CloudNativePG)
- What you can detect with AWS metrics and CloudWatch Database Insights and how pganalyze goes further by surfacing plan changes, vacuum issues, and slow queries that aren’t visible in built-in tools
- What to monitor when you can’t access host-level internals
- Effective approaches for Postgres log extraction in RDS/Aurora and EKS
- Cost tradeoffs across deployment options, including the new AWS Database Savings Plans announced at re:Invent
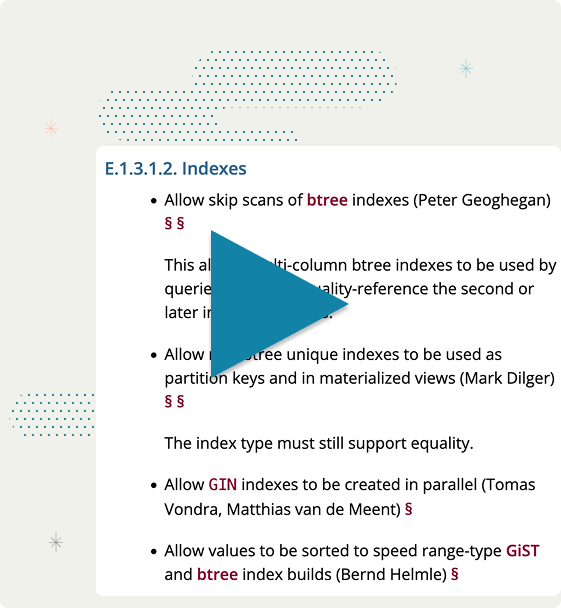
Hands on Postgres 18: Async I/O, B-tree Skip Scan, UUIDv7, and More
The release of PostgreSQL 18 introduced significant changes that directly influence performance at scale: from the introduction of asynchronous I/O, which changes how Postgres interacts with the disk both in the cloud and on-premise, to new planner optimizations that can make queries faster. Indexing capabilities also expand with B-tree Skip Scan, while the EXPLAIN command and statistics tables gain new information for tuning production workloads. We examine these changes in detail, using demonstrations and examples to show how they can be applied to achieve faster queries, more predictable scaling, and improved observability in PostgreSQL environments.
In this webinar, we will discuss:
- Asynchronous I/O: A fundamental change in how Postgres handles I/O, offering the potential for significant performance gains, particularly in cloud environments where latency is often the bottleneck.
- Indexing Improvements: How the new B-tree Skip Scan builds on Postgres 17’s improvements to more efficiently find a set of values, how it compares to loose index scans, and how indexing strategies should evolve.
- UUIDv7 for Primary Keys: Understand why UUIDv7 improves performance and ordering, how to migrate from UUIDv4, and when bigint still makes sense.
- Planner Changes: How Postgres 18 interacts with queries, for example, removing unnecessary self-joins, transforming OR-clauses into array scans, optimizing DISTINCT, and enabling more efficient join strategies.
- VACUUM Enhancements: The new autovacuum_vacuum_max_threshold setting and how it helps optimize autovacuum schedules for large tables with many rows, and other ways that VACUUM behavior is changing.
- Monitoring Upgrades: From richer EXPLAIN output to extended pg_stat_* views, learn how Postgres 18 makes it easier to understand query behavior, WAL activity, NUMA interactions with shared buffers, and more.
- pg_stat_plans: The addition of the PlannedStmt.PlanID column in Postgres 18 enabled the ability to track plan-level metrics and query execution trends with our new open source extension, pg_stat_plans.
- Other Performance Gains: Partition planning improvements, increased fast-path lock limits to reduce locking overhead for large-scale workloads.
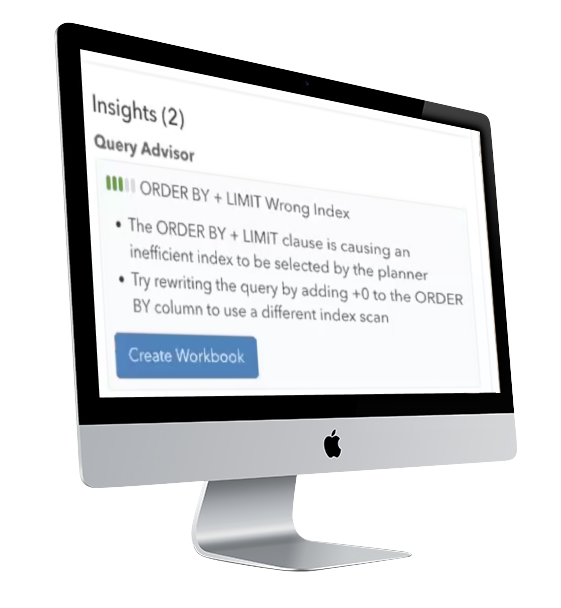
Fixing & Detecting Slow Postgres Queries with pganalyze Query Advisor
Need help detecting & fixing slow Postgres queries? Watch our webinar to learn how Query Advisor, a first-of-its-kind query optimization workflow purpose-built for Postgres coming soon to pganalyze, can help speed up queries (by over 1000x in one case) by selecting a better plan.
In this webinar, you will learn how Query Advisor:
- Detects inefficient queries, like nested loops and inefficient index scans, and automatically suggests a query rewrite or plan adjustments to fix the root cause of the slowdown
- Provides targeted recommendations grounded in your workload’s query plans, while tracking performance improvements over time
- Works behind the scenes to automatically identify problematic patterns and internally rewrites queries using the pg_query library
- Utilizes purpose-built logic specifically for Postgres that targets common problems encountered on production databases
- Has helped our team identify and fix queries on our own database, and improve a query’s runtime by over 1000x through a better query plan (from 6,286 ms to 5 ms)
- Helps you create and test query variants in Query Tuning Workbooks, which makes it easy to compare execution plans side-by-side, so you can apply changes with confidence
- Integrates with recent improvements to pganalyze Workbooks, like automatic formatting of SQL, built-in diff between variants and better support for IN lists
pganalyze in action: The Latest Features for Tuning Postgres
We walk through specific use cases that demonstrate how pganalyze can streamline slow query analysis, help you select the right indexes, and provide insights into critical parts of Postgres.
In this webinar, you will learn how to:
- Pinpoint slow and inefficient queries using auto_explain and pg_stat_statements to capture historical performance data, including cache hit ratios and whether queries are I/O-bound or CPU-bound
- Safely experiment with query optimizations using the Query Tuning Workbooks (beta) feature to compare alternate EXPLAIN plans side by side
- Improve indexing with Index Advisor suggestions to identify optimal indexes based on a constraint programming model applied to actual query workloads
- Detect and resolve table bloat using the VACUUM Advisor to gain visibility into autovacuum effectiveness and freezing
- Track PostgreSQL buffer cache changes over time, improving query performance and identifying cache issues.
- Leverage Amazon Aurora plan statistics to understand how query performance is affected by plan changes.
- Automate lock monitoring by regularly running a query to check for blocked sessions, which can lead to serious incidents on production databases
- Work effectively as a team by monitoring key Postgres metrics to align on database health and ensure everyone, from developers to DBAs, has the visibility needed to prevent and fix issues
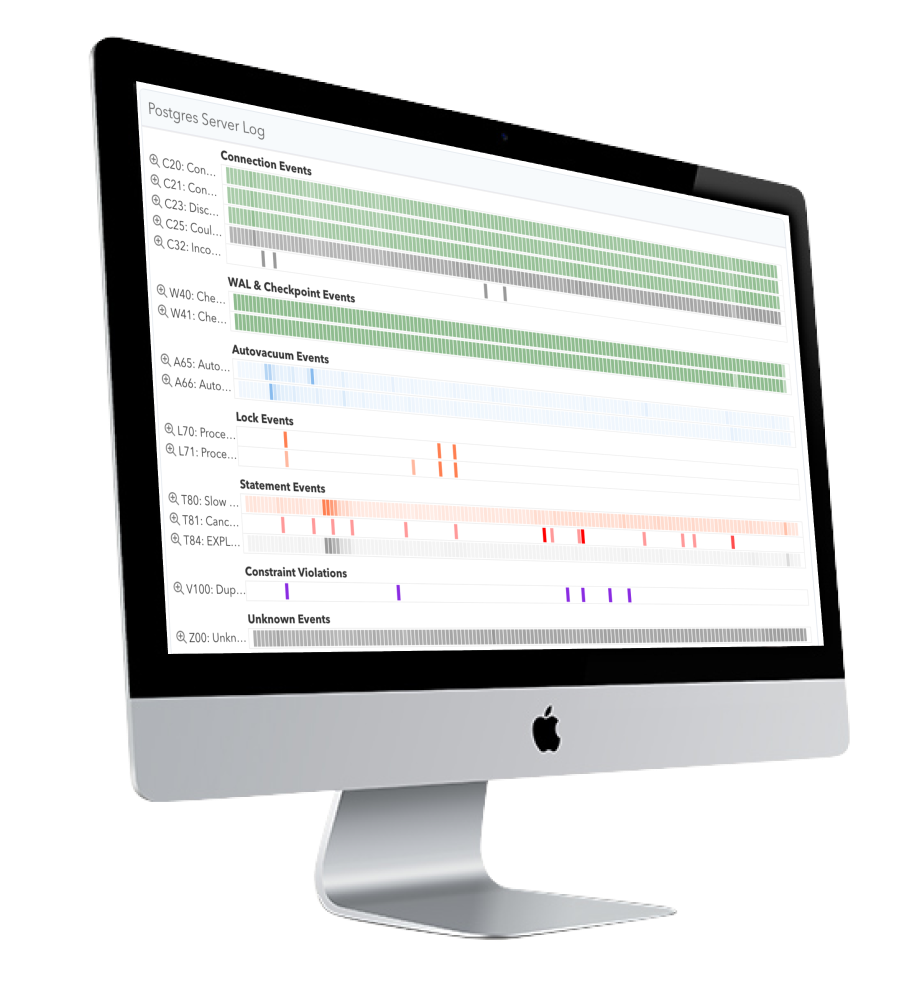
Proactive Postgres Practices to Prevent Performance Bottlenecks
Learn how to uncover hidden performance risks in Postgres, such as slow queries, checkpoint behavior, and connection issues, before they escalate, ensuring your database stays efficient and reliable.
Here is what you will learn in this webinar:
- Key early warning signs of performance bottlenecks, such as recurring wait events and unhealthy replication lag, that need intervention to resolve
- Best practices for checkpoint tuning, including settings related to Write-Ahead Logging (WAL), and how to balance crash recovery speed with performance
- Managing connections to avoid hitting limits and allocate resources effectively, and how to tune connection poolers
- Indexing strategies, including when to reindex and how to assess the impact of newly added indexes, especially in terms of blocking PostgreSQL’s HOT (Heap-Only Tuple) optimization
- Managing bloat by checking the autovacuum settings to ensure it’s running as expected to prevent new bloat and cleaning up existing bloat when needed
- Unlocking hidden insights in logs to detect slow queries and connection issues, like timed-out queries or deadlocks
- Best practices for team collaboration, to ensure DBAs, engineers, and SREs work together to prevent issues
How to Compare Postgres Plans & Tune Slow Queries with pganalyze
Comparing EXPLAIN plans manually is painstaking process of pattern-matching and query trial-and-error. We’ll show you how to compare Postgres plans in pganalyze where the analysis is done automatically to easily uncover common problems causing slow queries.
Here is what you will learn in this webinar:
- How to identify slow queries using data gathered by pganalyze & its Automated EXPLAIN feature
- How to compare query plans against variants to test for performance with the new Query Tuning features
- How to debug common scenarios like inefficient joins and nested loops and missing or inefficient indexes
- How to fix queries by rewriting them, changing statistics settings, or forcing a better plan
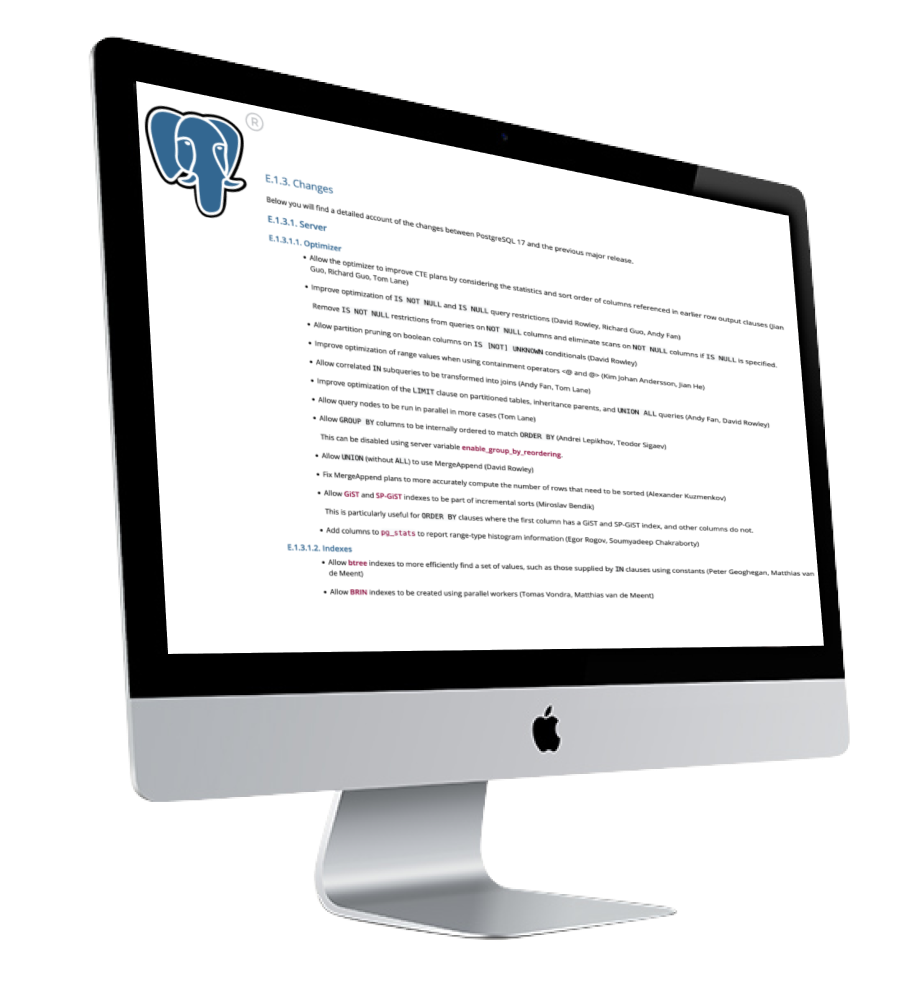
Hands on Postgres 17: What’s New & How It Impacts performance
Dive deep into the final release, examining what features have been included, what was removed in the beta phase due to bugs that were found, and how the changes in this release will impact your database performance and monitoring.
Here is what you will learn in this webinar:
- How faster B-tree scans and adaptive vacuum strategies improve performance
- The introduction of streaming I/O, and when to tune the new “io_combine_limit”
- Configurable SLRU cache sizes for better support for running Postgres at large scale
- Updated pg_stat_checkpointer and pg_stat_bgwriter views for in-depth monitoring
- The impact of built-in C.UTF-8 locale support for better compatibility after OS upgrades
- Changes to the Postgres planner, such as CTE statistics propagation, better handling of IN lists in joined tables and more
- Improvements to the EXPLAIN command (such as the new SERIALIZE option), to help you optimize queries better
- A quick overview of other significant improvements (Incremental backups, logical replication, COPY ON_ERROR, JSON_TABLE & more)
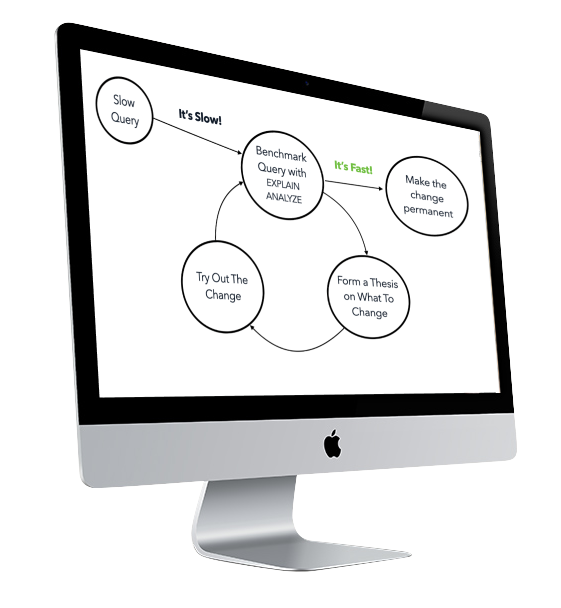
How to Optimize Slow Queries with EXPLAIN to Fix Bad Query Plans
Learn the essential skills of optimizing slow queries with EXPLAIN ANALYZE and get practical advice on how to address common problems.
Here is what you will learn in this webinar:
- How to go from a slow query to a query plan that shows which exact part was slows
- Why BUFFERS is important, and how to interpret the hits counter
- How to rewrite queries based on plans to speed up performance
- The different planner settings and how they influence plan choices
- How to identify when plans "fall over" to a bad query plan and why this can happen
- Identifying bad row estimates in a query, and how to correct them with better statistics
- Using statistics on expressions to help queries that use JSONB
- Identifying alternate plans using planner hints with pg_hint_plan
- Other ways of overriding the Postgres planner choices
- Parameterized Index Scans, and how they are influenced by the join order and join type
- Existing and upcoming pganalyze functionality for optimizing slow queries and working with EXPLAIN plans
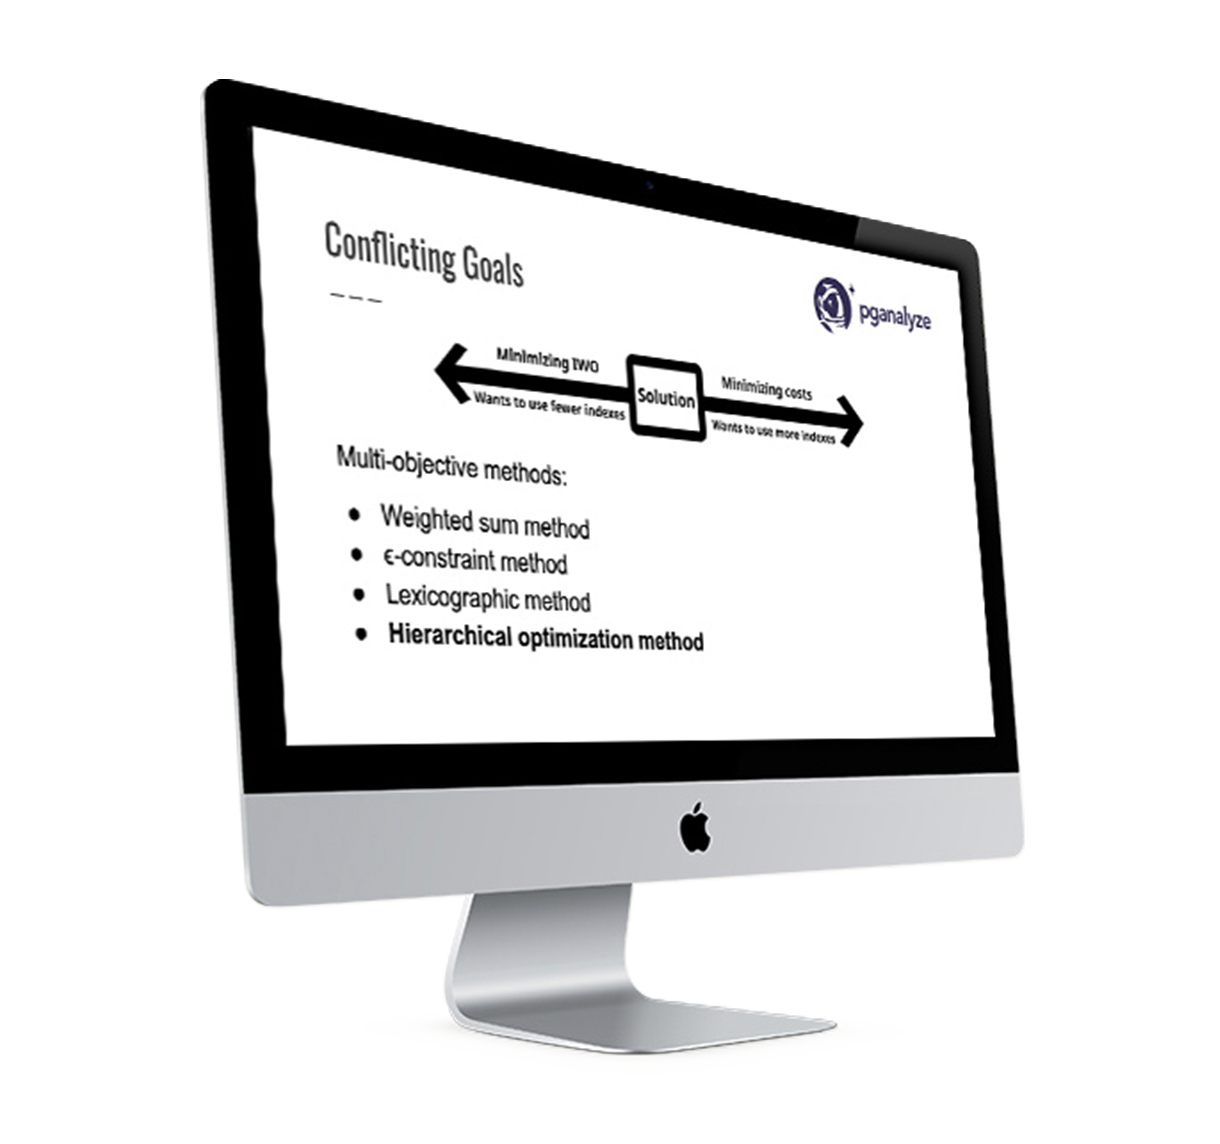
Automating Postgres Index Selection Using Constraint Programming
Get an introduction to a new approach for automatically determining which set of indexes to create for a given Postgres query workload, based on objectives chosen by the developer or DBA.
Here is what you will learn in this webinar:
- Our approach for processing the Postgres query workload statistics derived from pg_stat_statements
- Why we optimize index selection for a given table, not just a single query
- A constraint programming optimization model that finds the mathematically optimal solution (set of index choices) based on a given set of constraints and objectives
- How to find a set of indexes by minimizing the plan cost of all queries, whilst optimizing for the lowest index write overhead
- How to prioritize a subset of queries over others
- Controls for considering the impact of indexing to Postgres' HOT Updates
- Using the model for consolidating existing indexes into a smaller set, to reduce overhead
- How this compares to other approaches, such as Dexter, HypoPG, and research published on automatic index selection in recent years
Advanced Autovacuum Tuning and pganalyze VACUUM advisor
Understand the most important VACUUM metrics, concepts like xmin horizon, how to prevent transaction ID wraparound, estimating bloat, and more.
Here is what you will learn in this webinar:
- How to identify ineffective VACUUMs that run but don’t actually produce any results
- Tracking freezing stats to prevent TXID wraparound, and how to find problem tables
- The VACUUM xmin horizon, and how it causes “Dead Tuples Not Yet Removable”, and how pganalyze alerts you of this situation
- Why BUFFERS is important, and how to interpret the hits counter
- How pganalyze calculates the age of transaction IDs using calendar time (not just counting TXIDs)
- How pganalyze estimates bloat, and when the estimates are more vs less accurate
- The new logic for scale factor and threshold tuning recommendations, and how it works behind the scenes
- How VACUUMs that have multiple index phases can use a lot of resources, and how pganalyze recommends changing autovacuum_work_mem to avoid the problem
- The pganalyze VACUUM Advisor
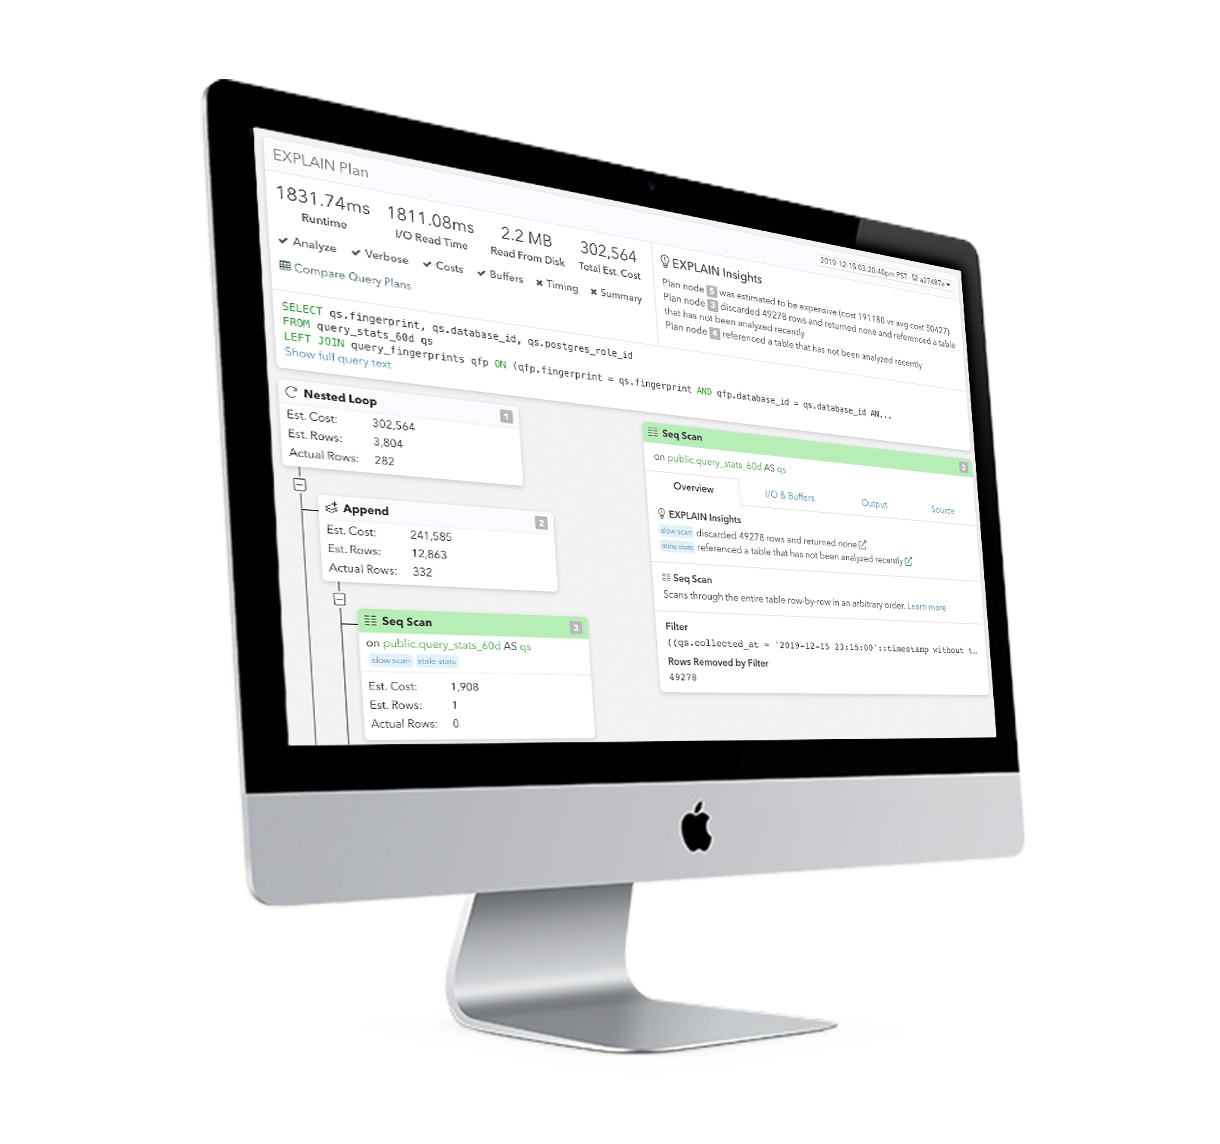
How to use the Postgres query planner to debug bad plans and speed up queries
Understand how the Postgres query planner chooses different plans for the same query, and how to debug bad plans.
Here is what you will learn in this webinar:
- How to go from a slow query to a query plan that shows which exact part was slow
- Understanding "Scans" and how Postgres decides which index to use
- Why BUFFERS is important, and how to interpret the hits counter
- How to rewrite queries based on plans to speed up performance
- The different planner settings and how they influence plan choices
- How to identify when plans "fall over" to a bad query plan and why this can happen
- Choosing particular query plans using planner hints with pg_hint_plan
- How managed cloud providers offer ways to control query plans (such as Aurora Query Plan Management), and how it compares to pg_hint_plan
- Using the Postgres queryid to link pg_stat_statements, pg_stat_activity and auto_explain
- Generic query plans, and how to get them from pg_stat_statements output
- Looking at query plans over time with pganalyze - and how it works behind the scenes
- and much more
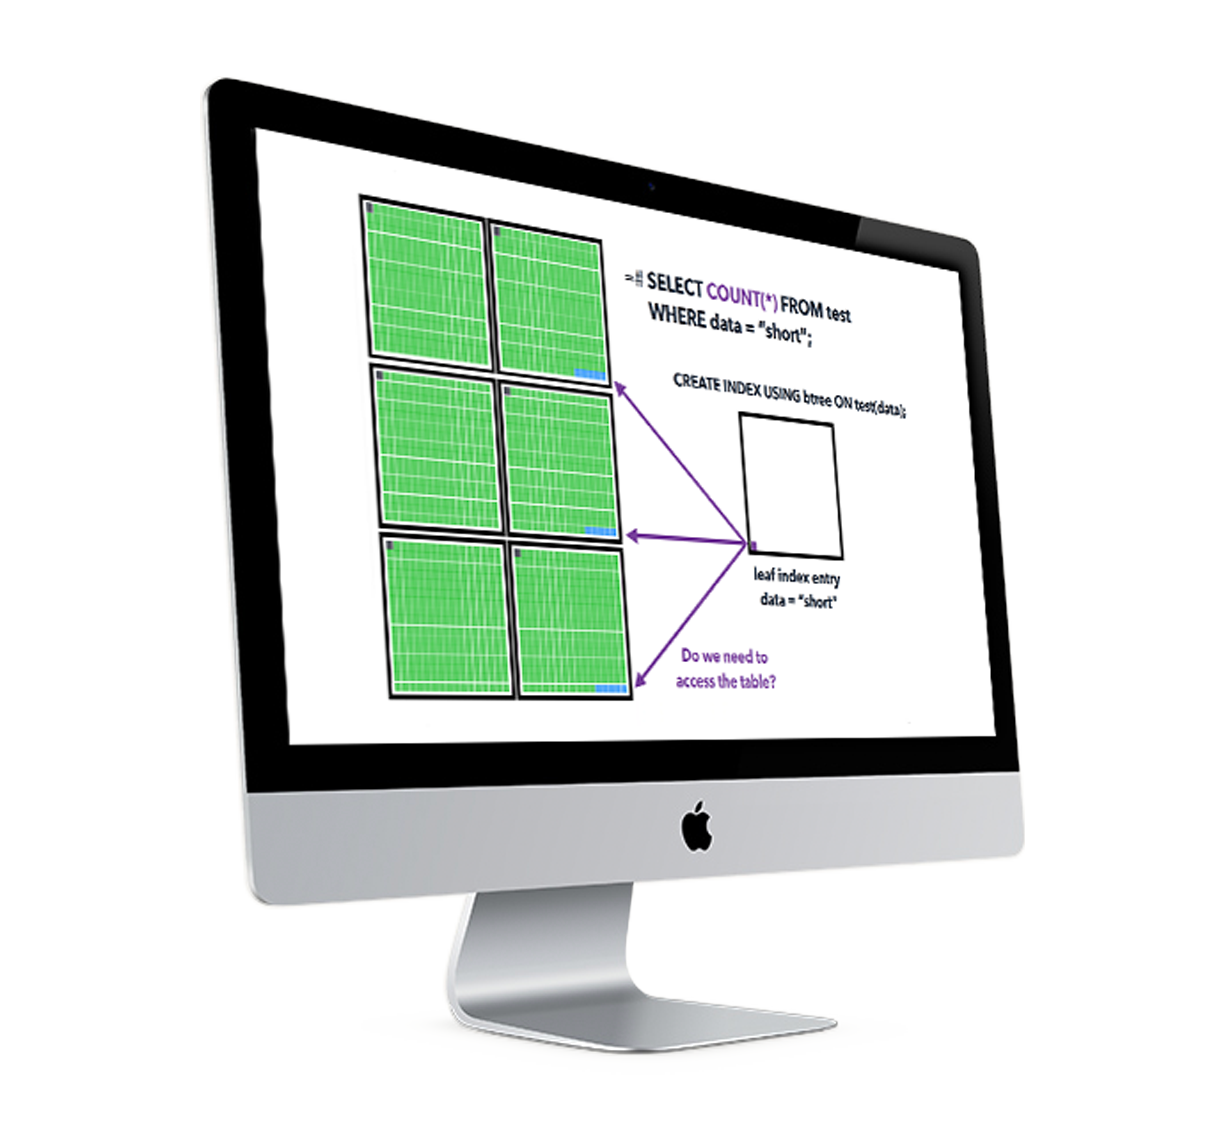
How to tune Postgres autovacuum to improve performance and reduce bloat
Tune your autovacuum settings to ensure that VACUUM runs at the right time and is effective for your workload.
Here is what you will learn in this webinar:
- The physicality of tables
- The Transaction ID clock
- All-visible pages and slow queries
- Understanding autovacuum scheduling
- Cost delay 101
- Aggressive and Failsafe VACUUMs
- Dead tuples not yet removable
- VACUUMing in the cloud - RDS, Aurora, Cloud SQL & AlloyDB
- Estimating and fixing table bloat
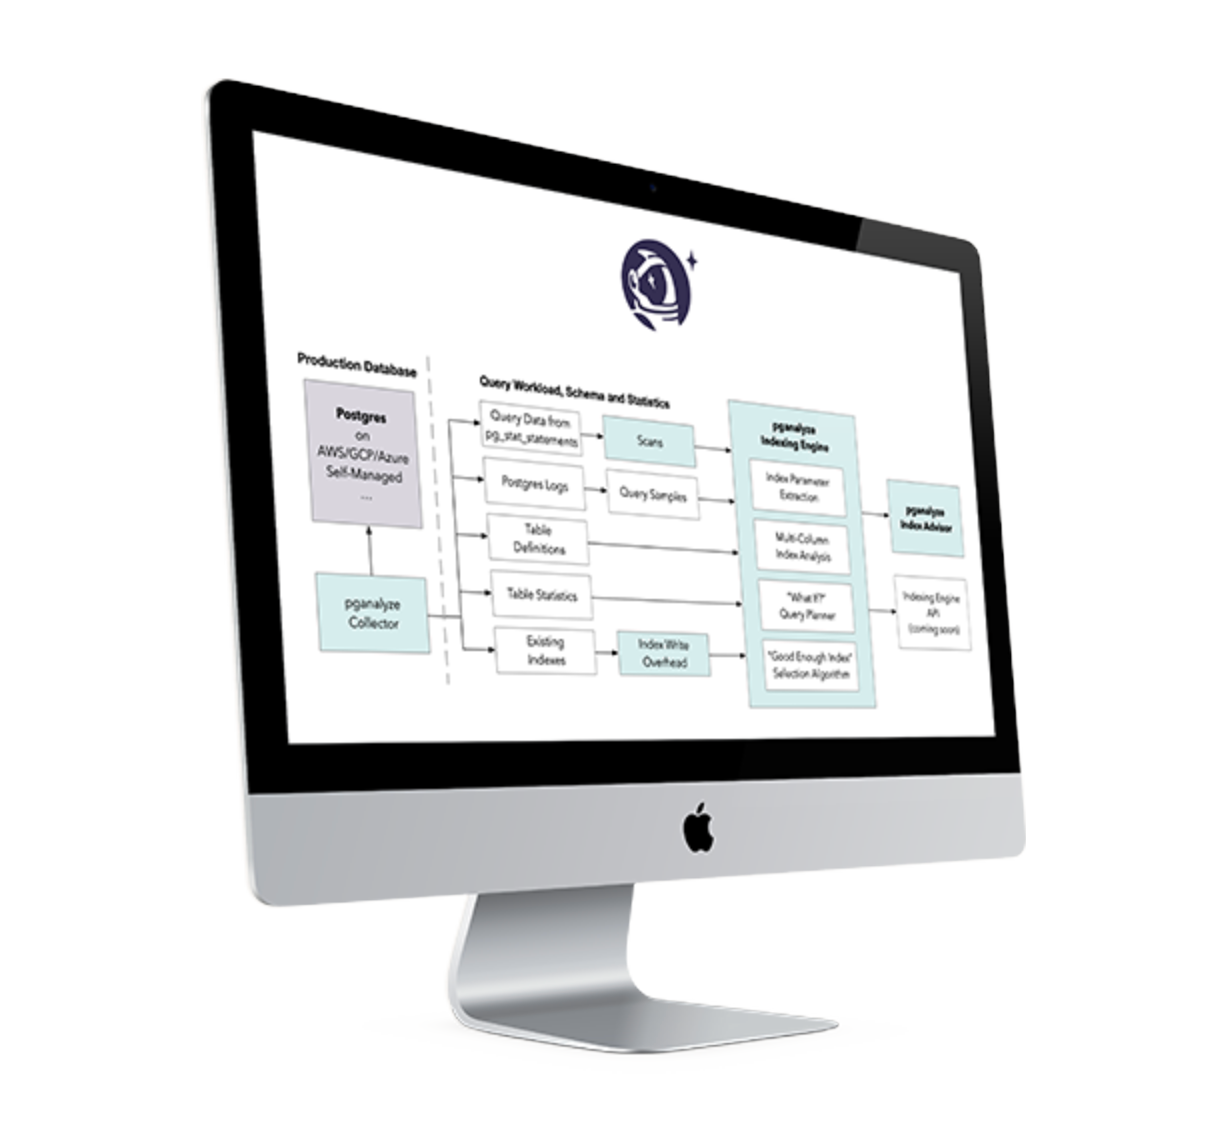
How To Reason About Indexing Your Postgres Database
See how Postgres chooses which index to use, and learn a methodology for analyzing queries and optimizing indexes.
Here is what you will learn in this webinar:
- How Postgres chooses which index to use
- Background about indexing
- What is a “good enough” index?
- A structured approach for finding the right indexes
- A look behind the scenes: The pganalyze Indexing Engine
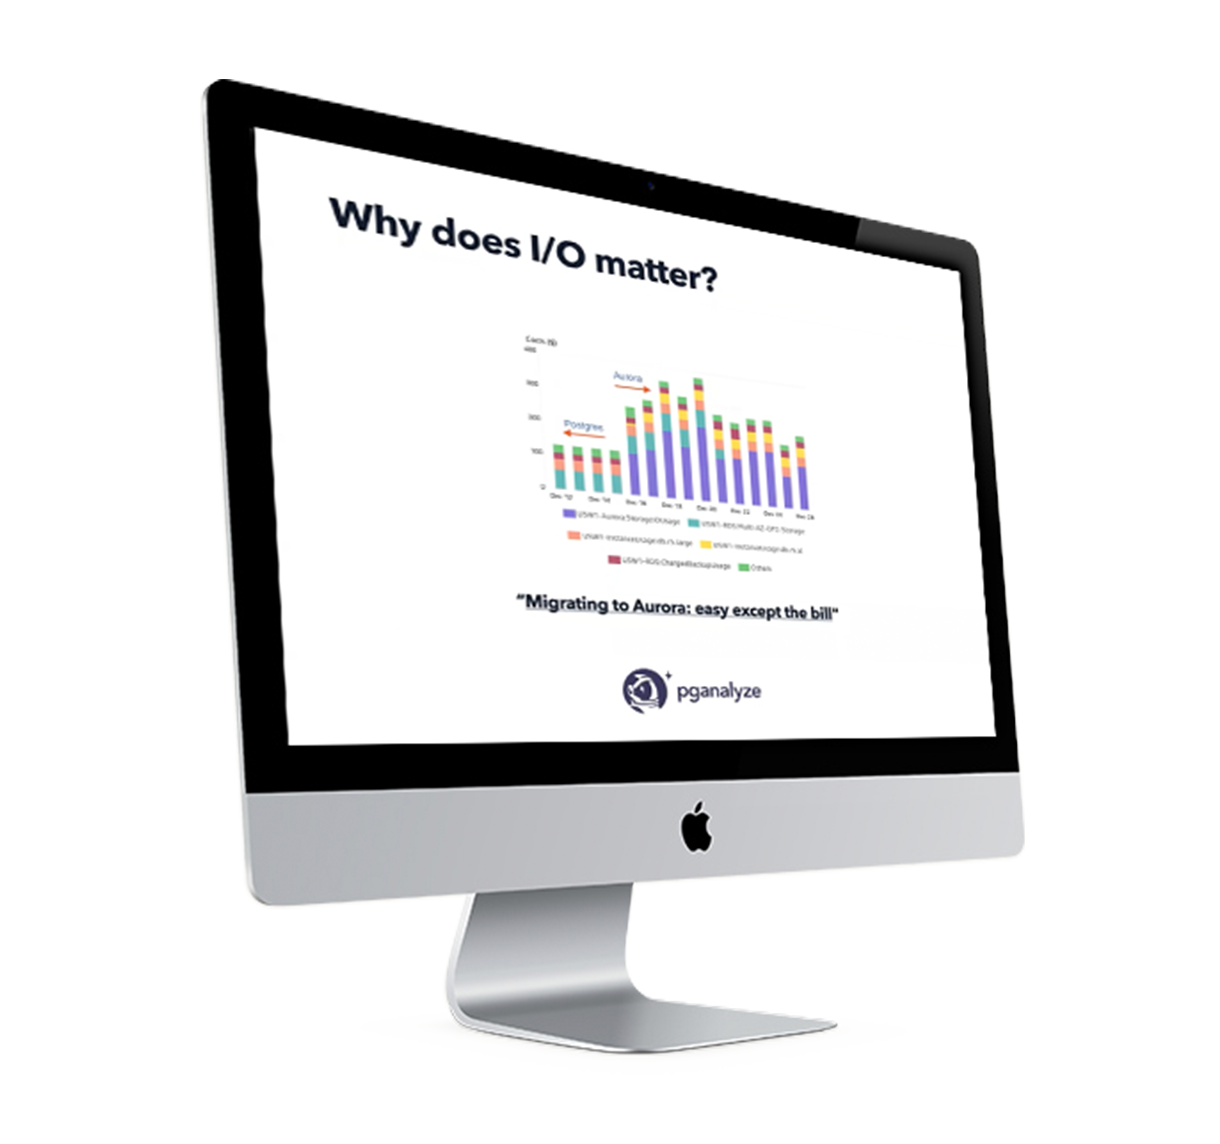
Optimizing Postgres I/O Performance and Costs
We dive into I/O optimization in Postgres and how tuning I/O helps reduce overall database costs.
Here is what you will learn in this webinar:
- Common causes for I/O spikes in Postgres and how they affect infrastructure costs
- How to map high read and/or write IOPS to database activity
- Using EXPLAIN plans to find heavy hitting I/O intensive queries
- Caching in Postgres, and how the buffer cache hit ratio can be improved to reduce I/O
- Finding the root cause of high I/O costs of cloud databases such as Amazon Aurora
- and much more
Hundreds Of Companies Monitor Their Production PostgreSQL Databases With pganalyze


