Introducing Automated Postgres EXPLAIN Visualization & Insights
Today, we’re excited to introduce you to the next evolution of pganalyze.
We updated our logo and overall brand, worked on our documentation to help you understand Postgres and its internals better and, most importantly, we’re proud to announce a new key feature on our platform: Automated EXPLAIN Visualization & Insights.
Offering this functionality to you is a natural progression for us as we’re further refining our focus on providing you with even better, more detailed insights into how your Postgres database is performing. You can see that the pganalyze feature set - layer by layer - allows for deeper understanding of your databases:
Automatic Collection of Query Plans
If you are familiar with EXPLAIN and Postgres query planning, you know that it’s a powerful tool that can help you understand exactly why a query is slow, by showing you all the details of how Postgres executes a query:
EXPLAIN (ANALYZE) SELECT * FROM query_stats_60d WHERE database_id = 123 AND ...
                                                QUERY PLAN
------------------------------------------------------------------------------------------------------------------------------------------------------------
 Nested Loop  (cost=874077.08..878028.35 rows=1 width=84) (actual time=14507.794..14509.439 rows=39 loops=1)
   ->  Append  (cost=0.00..864225.73 rows=264387 width=84) (actual time=6294.194..13902.525 rows=1347827 loops=1)
       ->  Seq Scan on query_stats_60d qs  (cost=0.00..1727.95 rows=1 width=74) (actual time=4.000..4.000 rows=0 loops=1)
             Filter: ((collected_at >= '2019-12-14 04:07:02.192978'::timestamp without time zone) AND  (database_id = 123))
             Rows Removed by Filter: 49278
       ->  Bitmap Heap Scan on query_stats_60d_20191214 qs_1  (cost=41610.85..607092.80 rows=185988 width=84)  (actual time=6290.193..12136.674 rows=892360 loops=1)
             Recheck Cond: ((database_id = 123) AND (collected_at >= '2019-12-14 04:07:02.192978'::timestamp  without time zone))
             Heap Blocks: exact=18991
             ...
EXPLAIN is a tool that is commonly run after the fact, when you’ve already experienced a slowdown in your database. Conveniently, PostgreSQL provides the auto_explain module to automatically collect EXPLAIN plans for slow queries. If you tune auto_explain correctly, it’s incredibly powerful and by far the best way to understand what exactly happened at the moment in time when you experienced a slow down.
The auto_explain output is directed to the Postgres log file, where you can then see plans show up. However, as you can imagine, looking at a lot of plain text isn’t the best way to understand what’s really going on.
Automatic Visualization of Postgres EXPLAIN Plans
For us at pganalyze it’s important to provide insights to everyone who is working in some way with your database. As they say, a picture is worth a thousand words, and that is even more important for complex mechanisms such as the PostgreSQL planner.
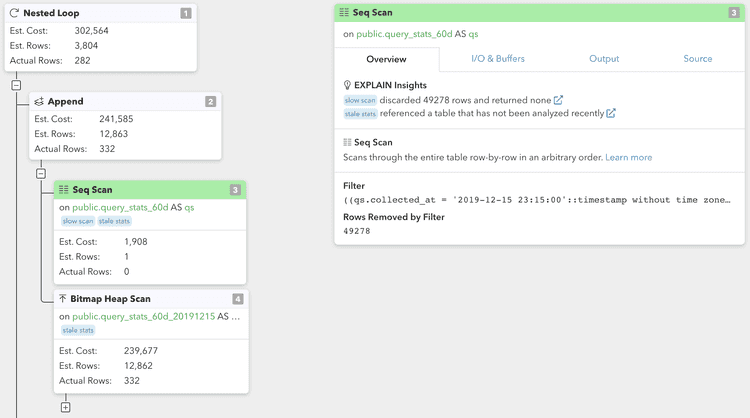
Today, we’re introducing the new EXPLAIN Plan Visualization feature for pganalyze:
This builds on our integration with auto_explain, with additional integration options coming soon.
What you can see above are the individual plan nodes of your query in PostgreSQL. For example, a Sequential Scan is typically used to retrieve data from disk without going through an index. At a glance, in this new view you can easily see which actions were expensive in the query plan.
With this new view it’s easy to have an understanding of what exactly happened, and you will know exactly how Postgres planned and executed a slow query.
Now, we cannot expect everybody on your team to be a Postgres expert so let’s give them some help to see what is worth looking at, so they can understand exactly why a query is slow.
pganalyze EXPLAIN Insights
With the new EXPLAIN Insights feature, pganalyze is automatically analyzing the query plans it receives and equips you and your team with the information to understand what you need to look at or tune:
Specifically, we help you find problematic cases such as:
- Disk Sort
When a Sort operation spills to disk due to low work_mem settings - Expensive Nodes
When particular nodes are more expensive than others in a plan - Hash Batches
When a Hash operation spilles to disk due to low work_mem settings - Inefficient Index
When an index is inefficient because its loading too much data and then filters rows without an index - Large Offset
When OFFSET is used for pagination, instead of an efficient method such as keyset-based pagination - Lossy Bitmaps
Bitmap Heap Scan that utilizes a lossy bitmap due to low work_mem - Mis-Estimate
The Postgres planner mis-estimated the number of rows a particular plan node returns - Slow Scan
Sequential Scan that removed a significant number of rows (an index would have helped to avoid this) - Stale Stats
The table referenced has not had anANALYZErun recently (potentially leading to inefficient plans)
The new pganalyze brand
Last but not least, we'd like to introduce the new pganalyze brand and logo:
The new logo illustrates an astronaut looking towards the stars. Space exploration, much like database optimization, is a team effort, and we'd like to emphasize this with our new branding.
Offering Automated EXPLAIN Insights to you falls perfectly in line with our core philosophy:
pganalyze aims to provide deep insights into your Postgres database. Our goal is to not just give you information on the surface level - we want to provide you with true insights and understanding.
Other tools might show you what happened in your database, pganalyze equips engineering teams with the insights to understand why it happened.
Try out the new pganalyze today, or reach out to us with any questions or thoughts on Twitter or via email.
If you want to help spread the word about our new features and our new brand we’d appreciate a tweet about it. Click here to tweet about this.


