Take control of your Postgres workload and query plans
Learn more about automatic collection and insights into Postgres Query Plans →In-depth Postgres observability
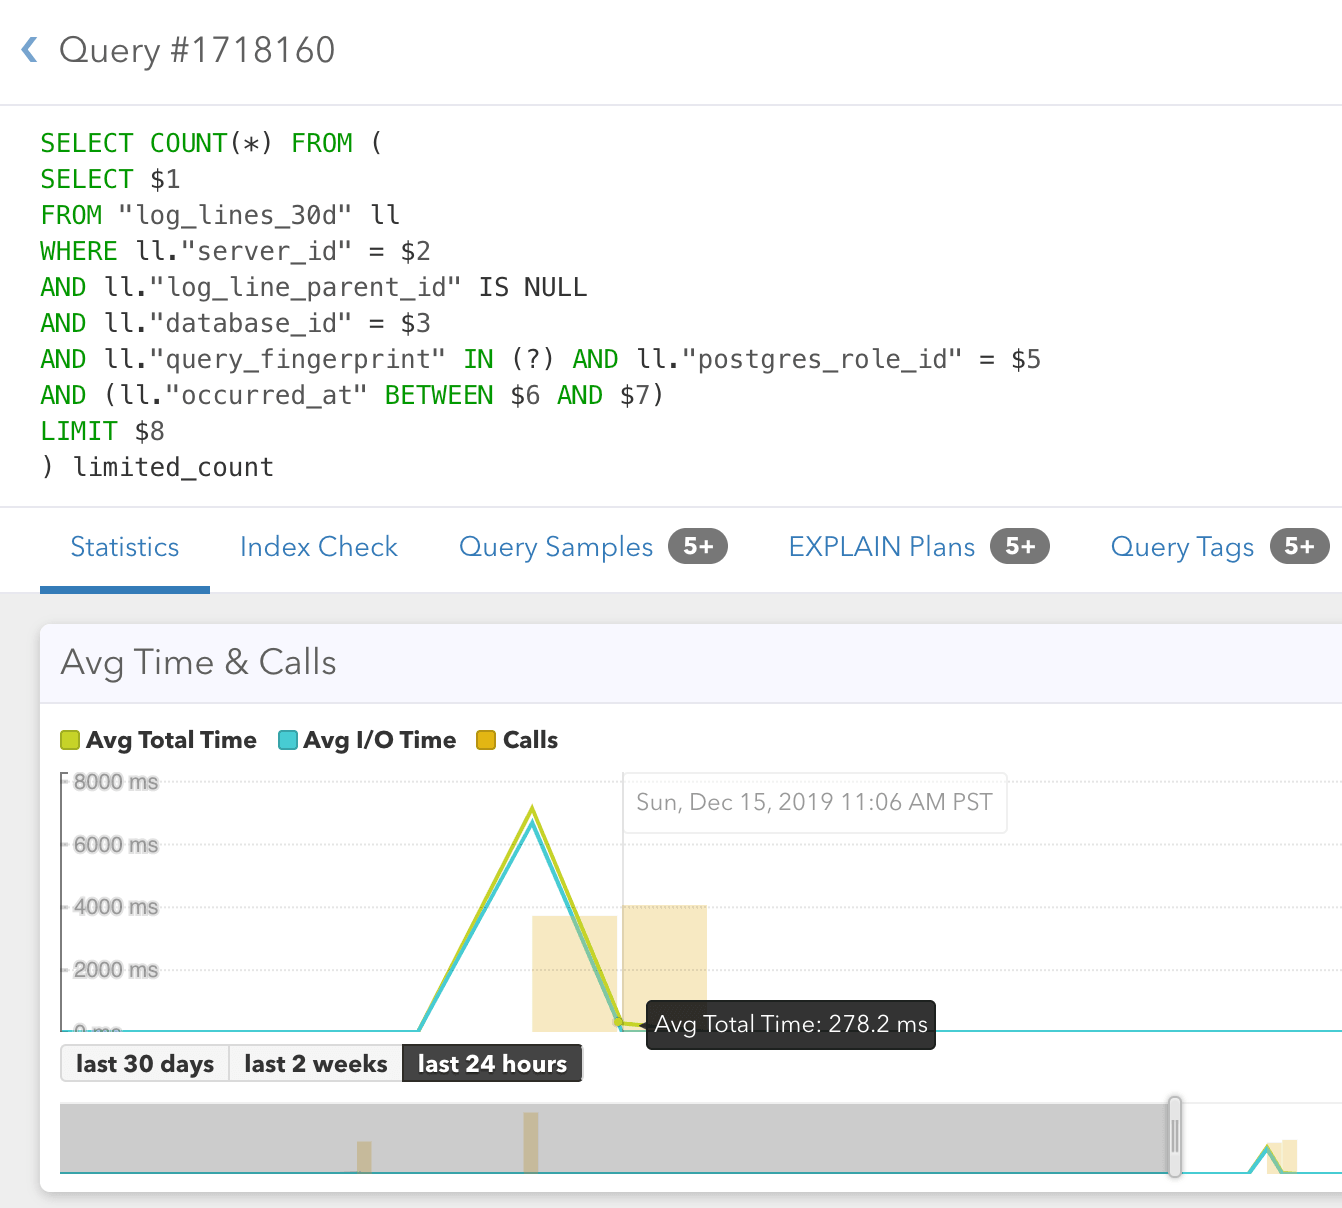
Drill down into detailed per-query statistics and benefit from insights into your query performance history to detect slow queries.
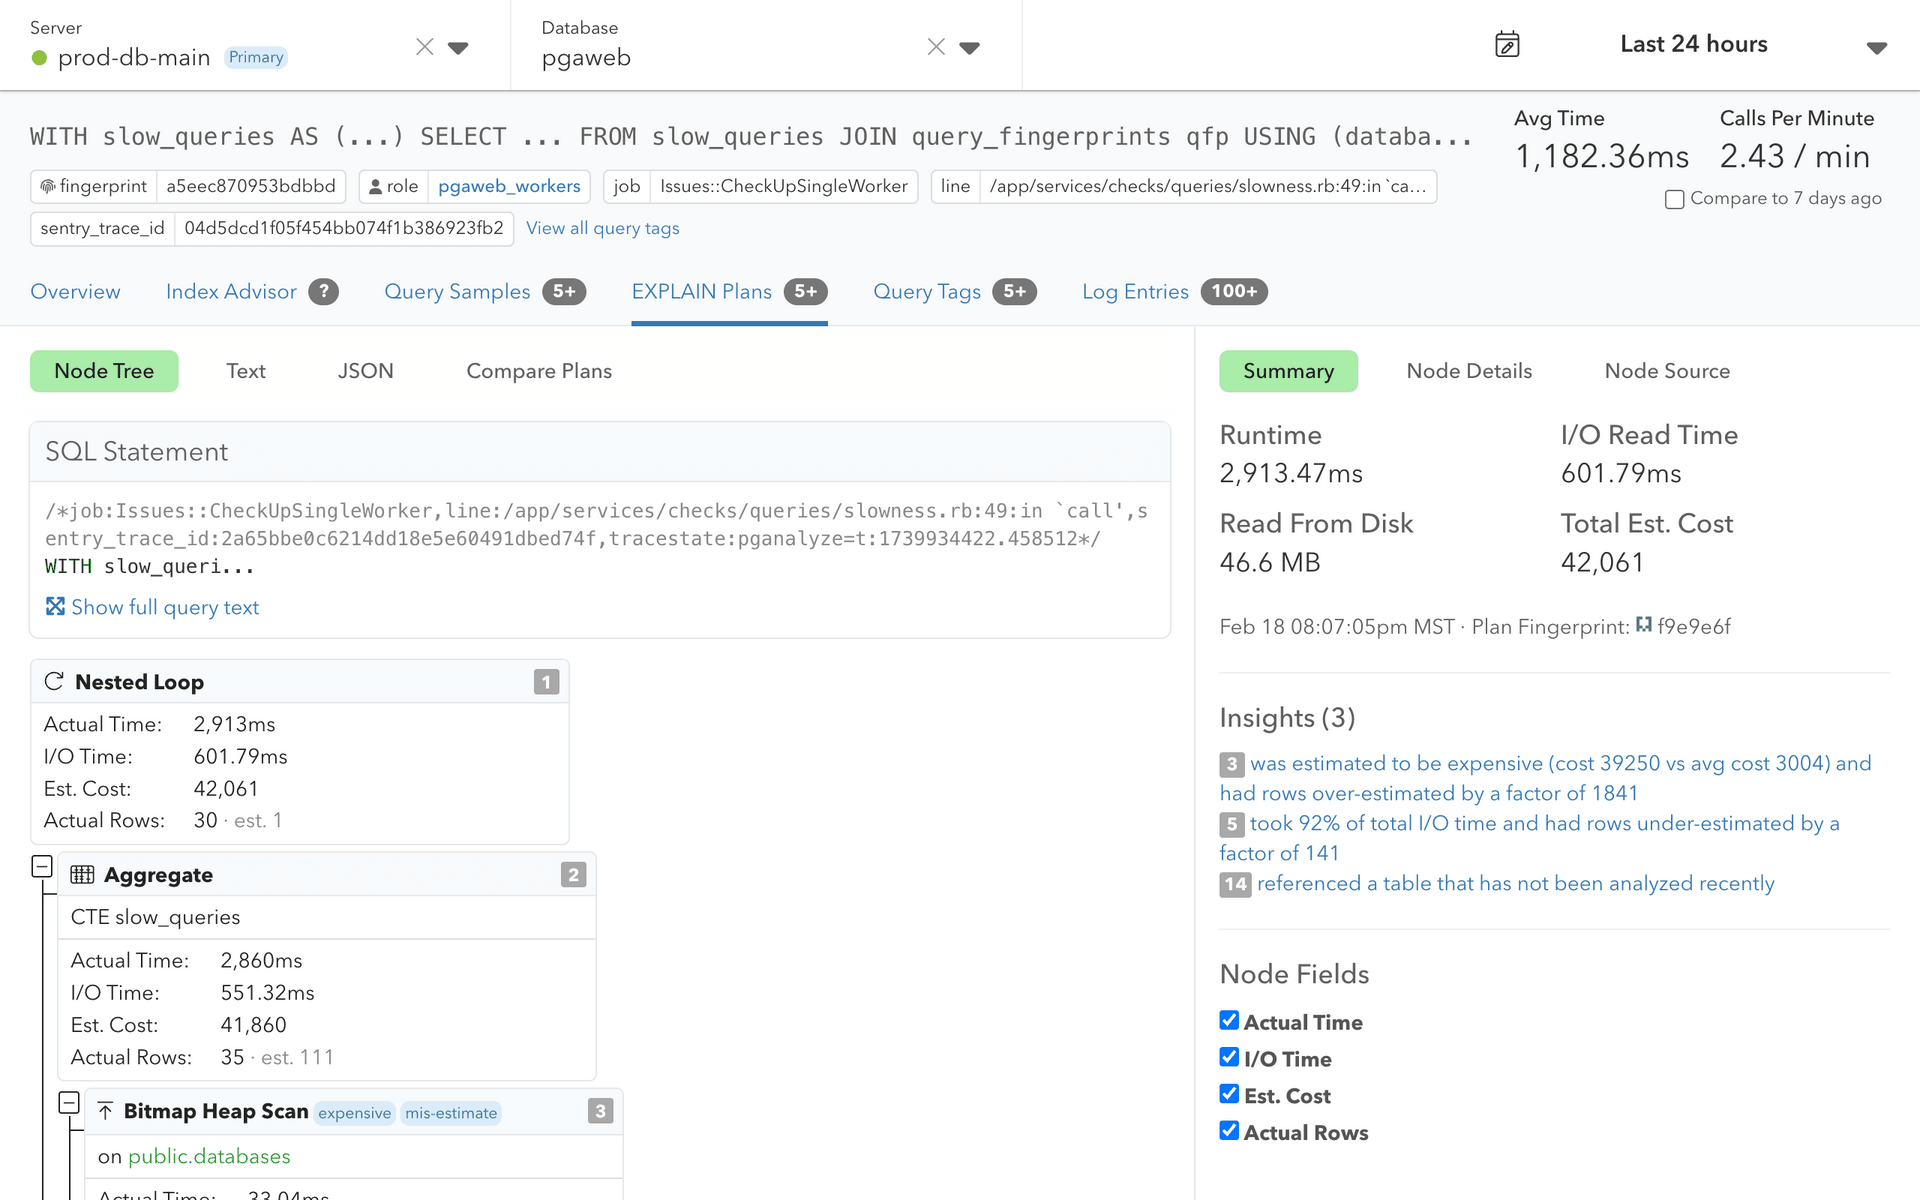
Analyze EXPLAIN plans over time
Automatically collect your EXPLAIN plans with auto_explain, and get detailed insights based on query plans gathered from your database.
Find root causes of slow queries
Understand why a query is slow and get tuning recommendations on how to make the query faster.
Resolve database slowdowns
Identify slowdowns for specific queries over time, I/O vs CPU time spent, and buffer cache hit ratio for each query.
Discover tuning opportunities with automatic advisors
Learn more about Postgres index recommendations with pganalyze Index Advisor →pganalyze Index Advisor
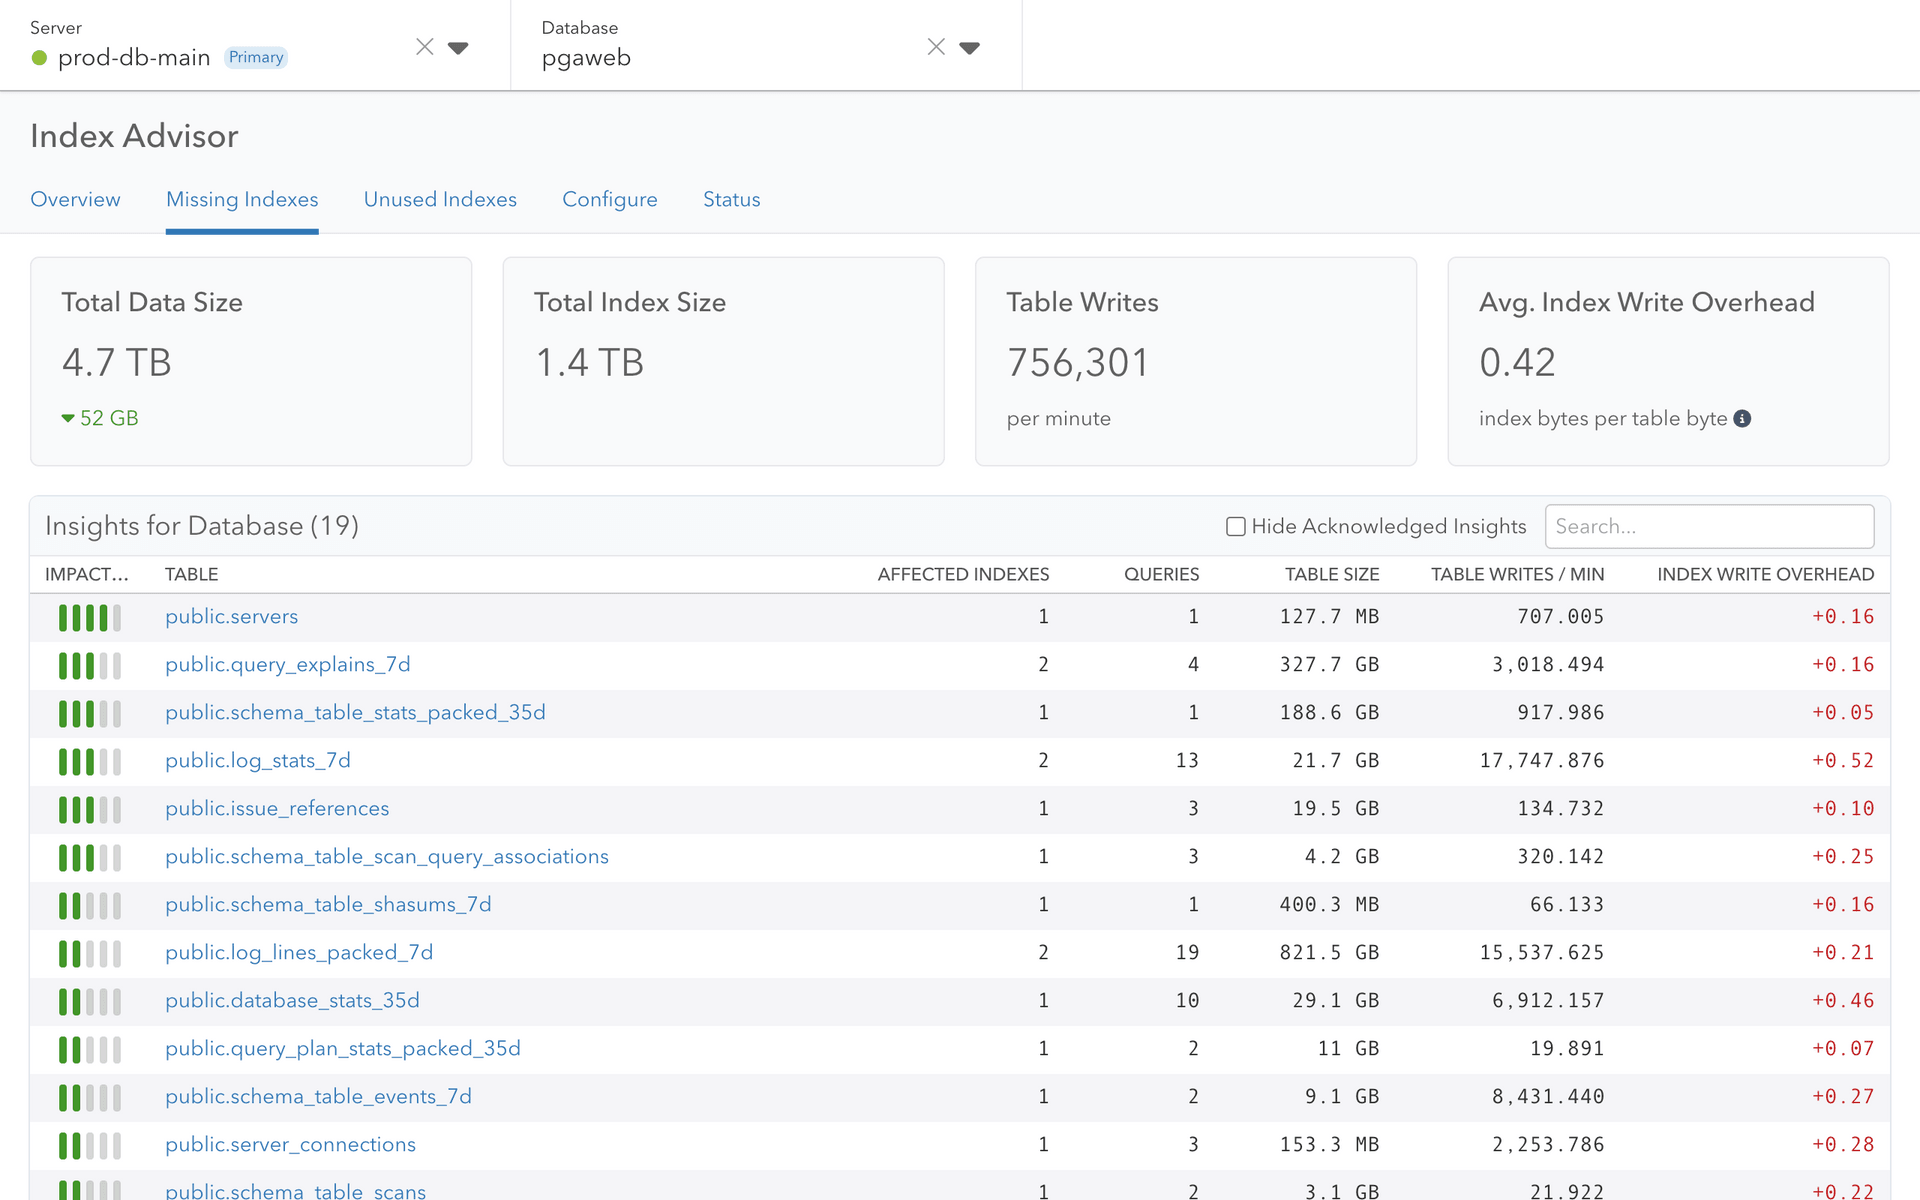
Automatically detects missing indexes and recommends single and multi-column indexes that improve query performance across your databases.
Based on reproducible logic
The pganalyze Indexing Engine tries out hundreds of index combinations using its "What If?" analysis & surfaces the most impactful opportunities.
pganalyze VACUUM Advisor
Provides per-table recommendations for autovacuum settings to optimize table bloat, freezing, VACUUM performance, and more.
Smart configuration tuning
Discover effective config settings tailored to your database workload that enable you to achieve consistent Postgres performance and availability.
Empower all development teams to fix slow queries
Learn more about Postgres query analysis with pganalyze →Greater developer productivity
Give product and infrastructure engineers the right tool to understand and solve query performance issues.
Prevent information silos
Slow queries can be hidden by ORM calls in the application code. Identify them with query tags in pganalyze.
Pinpoint slow queries
Help your teams understand why a query is slow & get recommendations on how to make the query faster.
Collaborate without limits
Enable all your teams to work on improving Postgres performance with Single Sign-On and unlimited users.
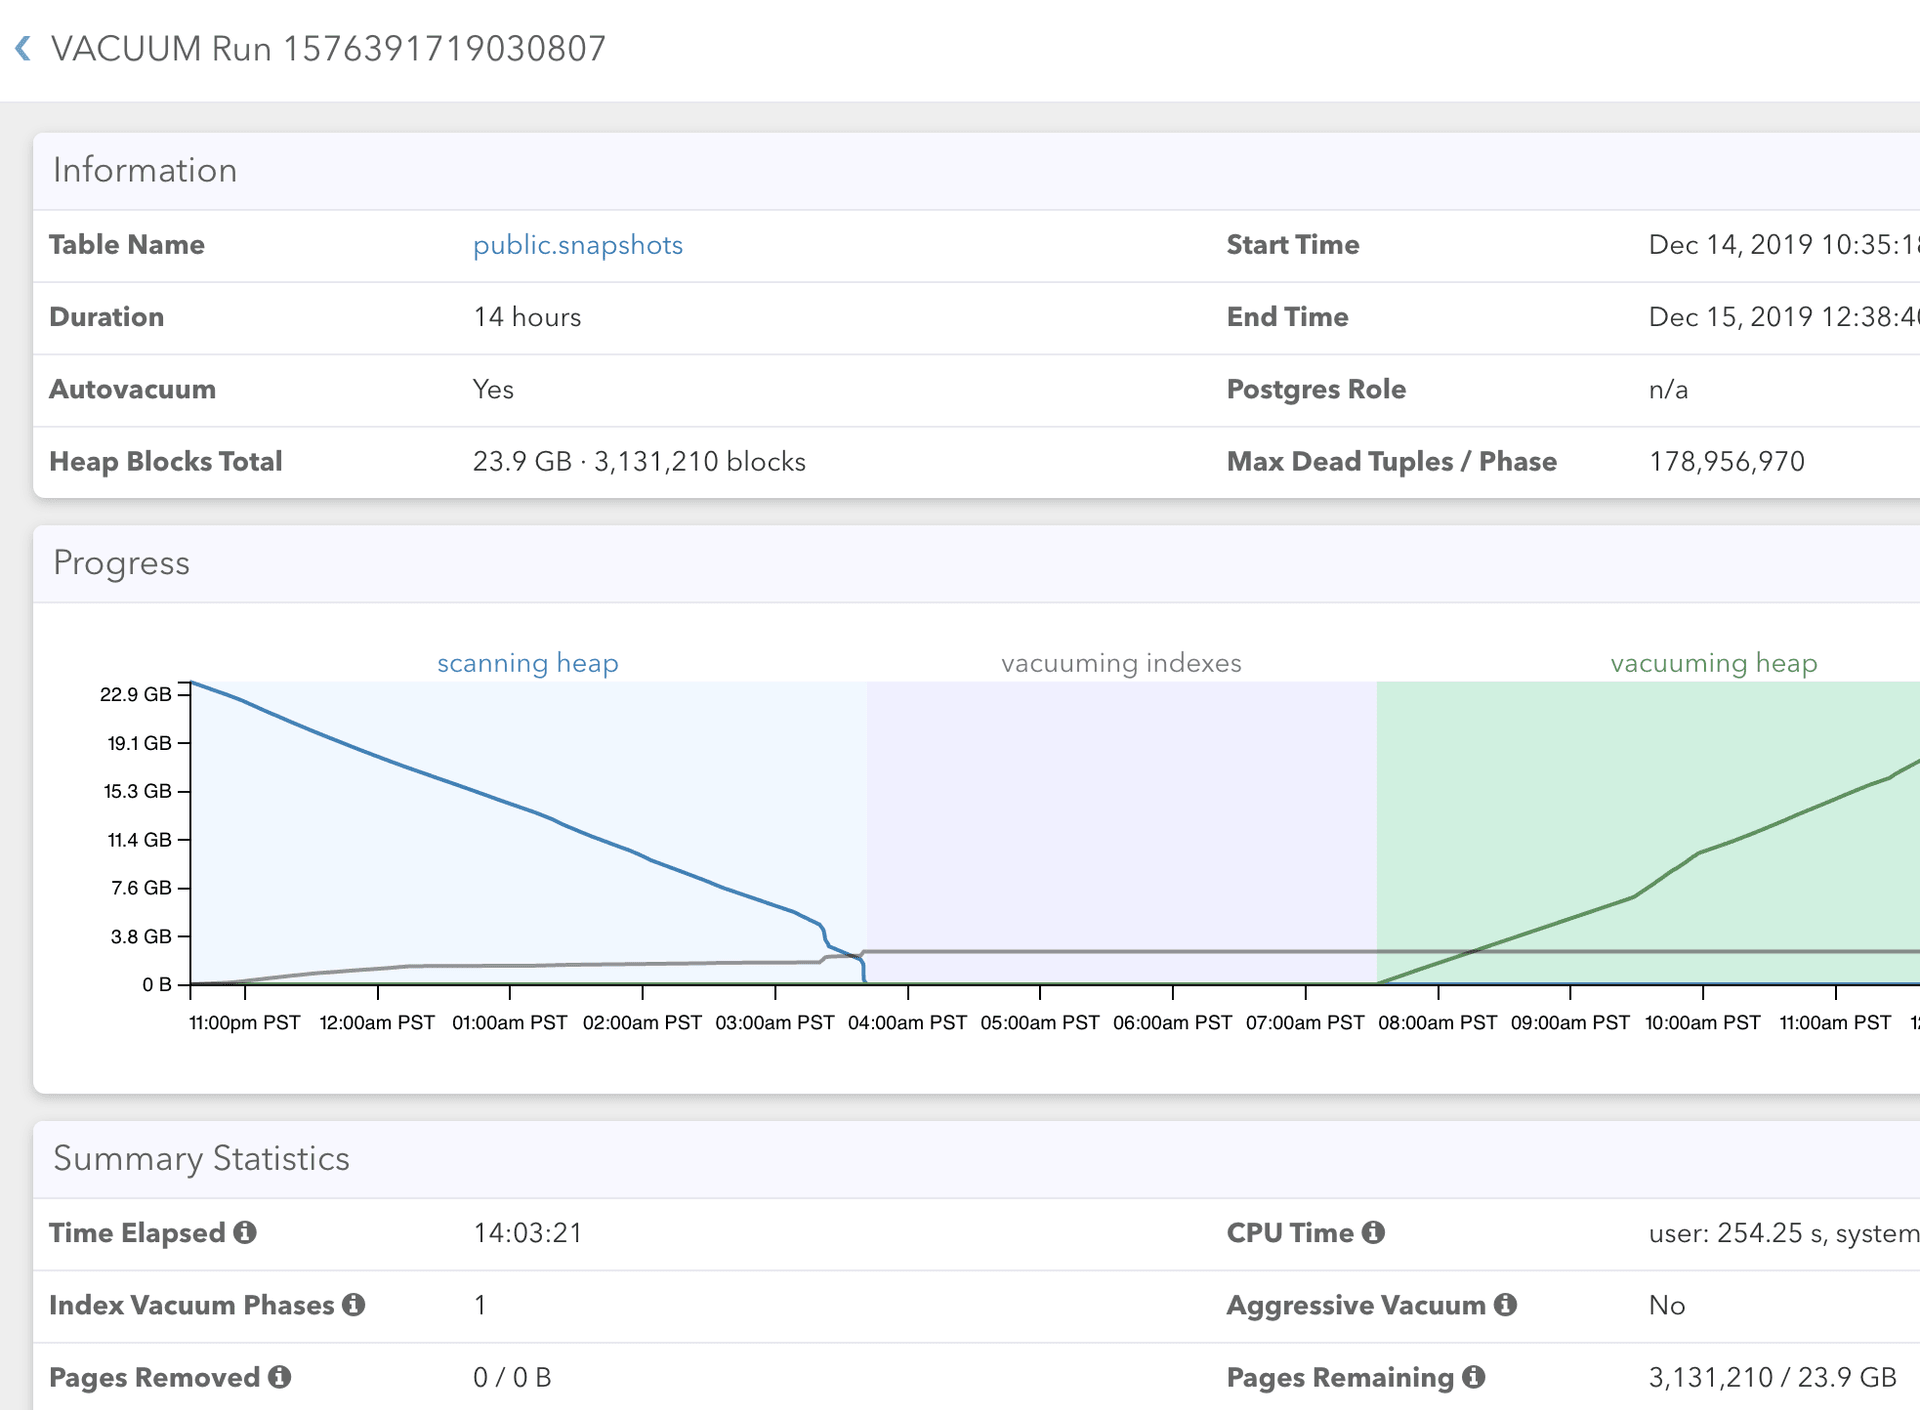
Database visualization and sophisticated dashboards
Learn more about Postgres monitoring with pganalyze →Avoid CLI tools
Uncover root causes to issues in minutes and stop wasting time with command line tools.
One single platform
View your logs and query statistics in one single platform and monitor your key metrics in real-time.
Trend analysis
Analyze meaningful trends and get insights into your query performance history.
Tuning recommendations
Collect detailed insights and receive tuning recommendations for your per-table autovacuum configuration.
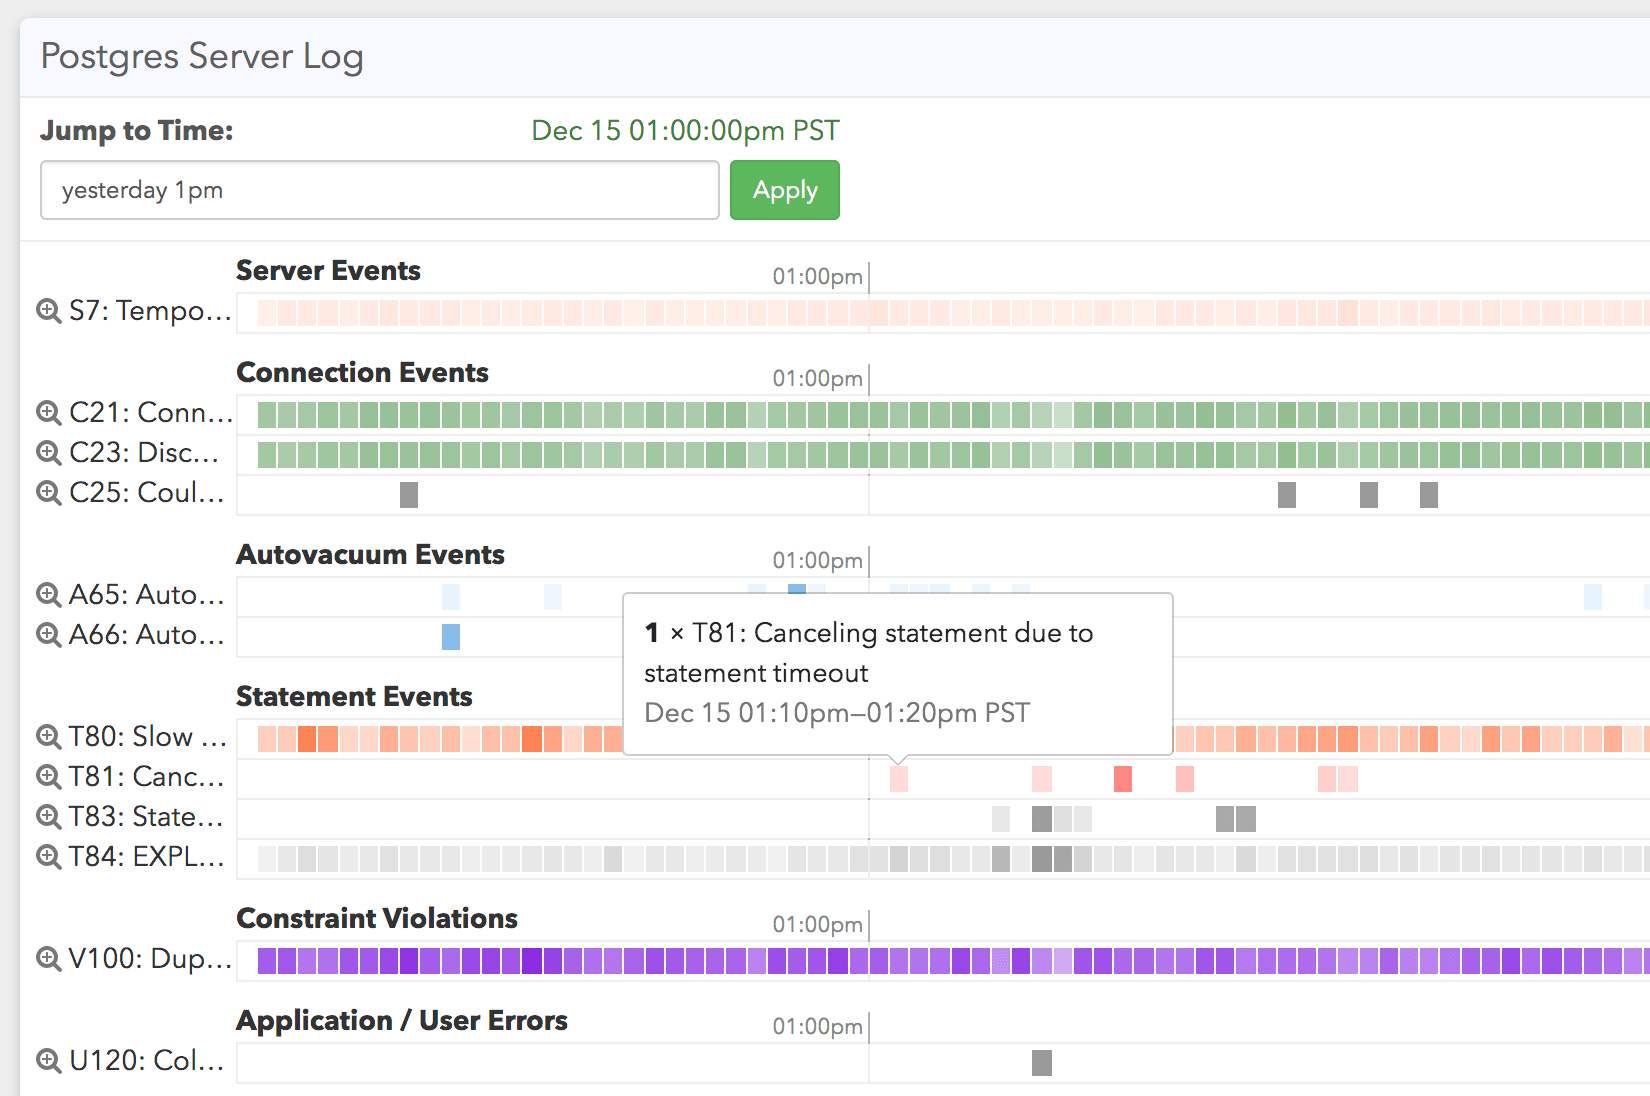
Clear understanding of logs with pganalyze Log Insights
Learn more about pganalyze Log Insights →Structured data
Log Insights automatically extracts the logs into structured data, and filters any sensitive information.
auto_explain integration
Automatically extract the output for the auto_explain extension that comes bundled with Postgres.
Postgres vacuum monitoring
Automatically combine information about vacuum logs with statistics data, and see it in one unified interface.
Careful PII filtering
Thanks to over 100 log filters, pganalyze filters PII from the log messages before it gets stored.
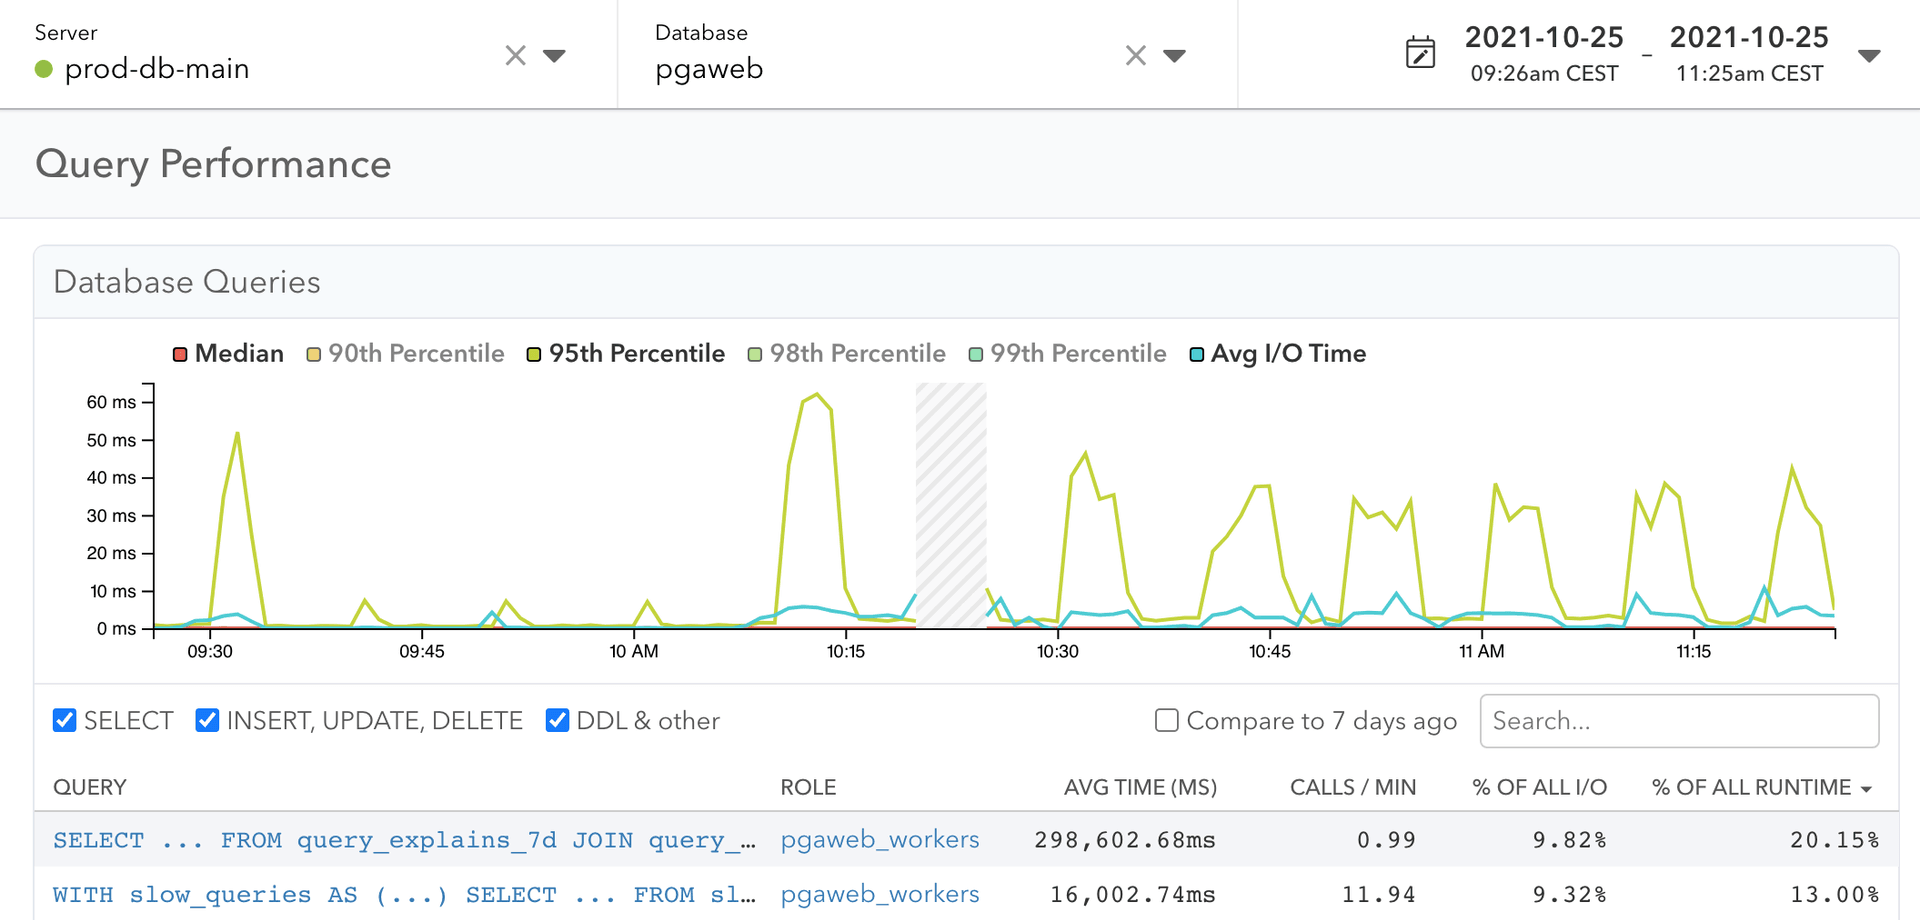
Performance optimization for your Postgres databases
Learn more about Postgres performance optimization with pganalyze →Comparison over time
Get easy access to historic data, and zoom into specific moments of your database server performance.
Tuning recommendations
Set up automated checks that analyze your Postgres configuration and suggest optimizations.
Per-table detection
pganalyze detects per-table configuration, for example for table-specific autovacuum settings.
Buffer cache hit ratio
Easily get insights into your buffer cache hit ratio for each query, over time.
Secure Postgres monitoring
Learn more about secure database monitoring with pganalyze →Running on-premise
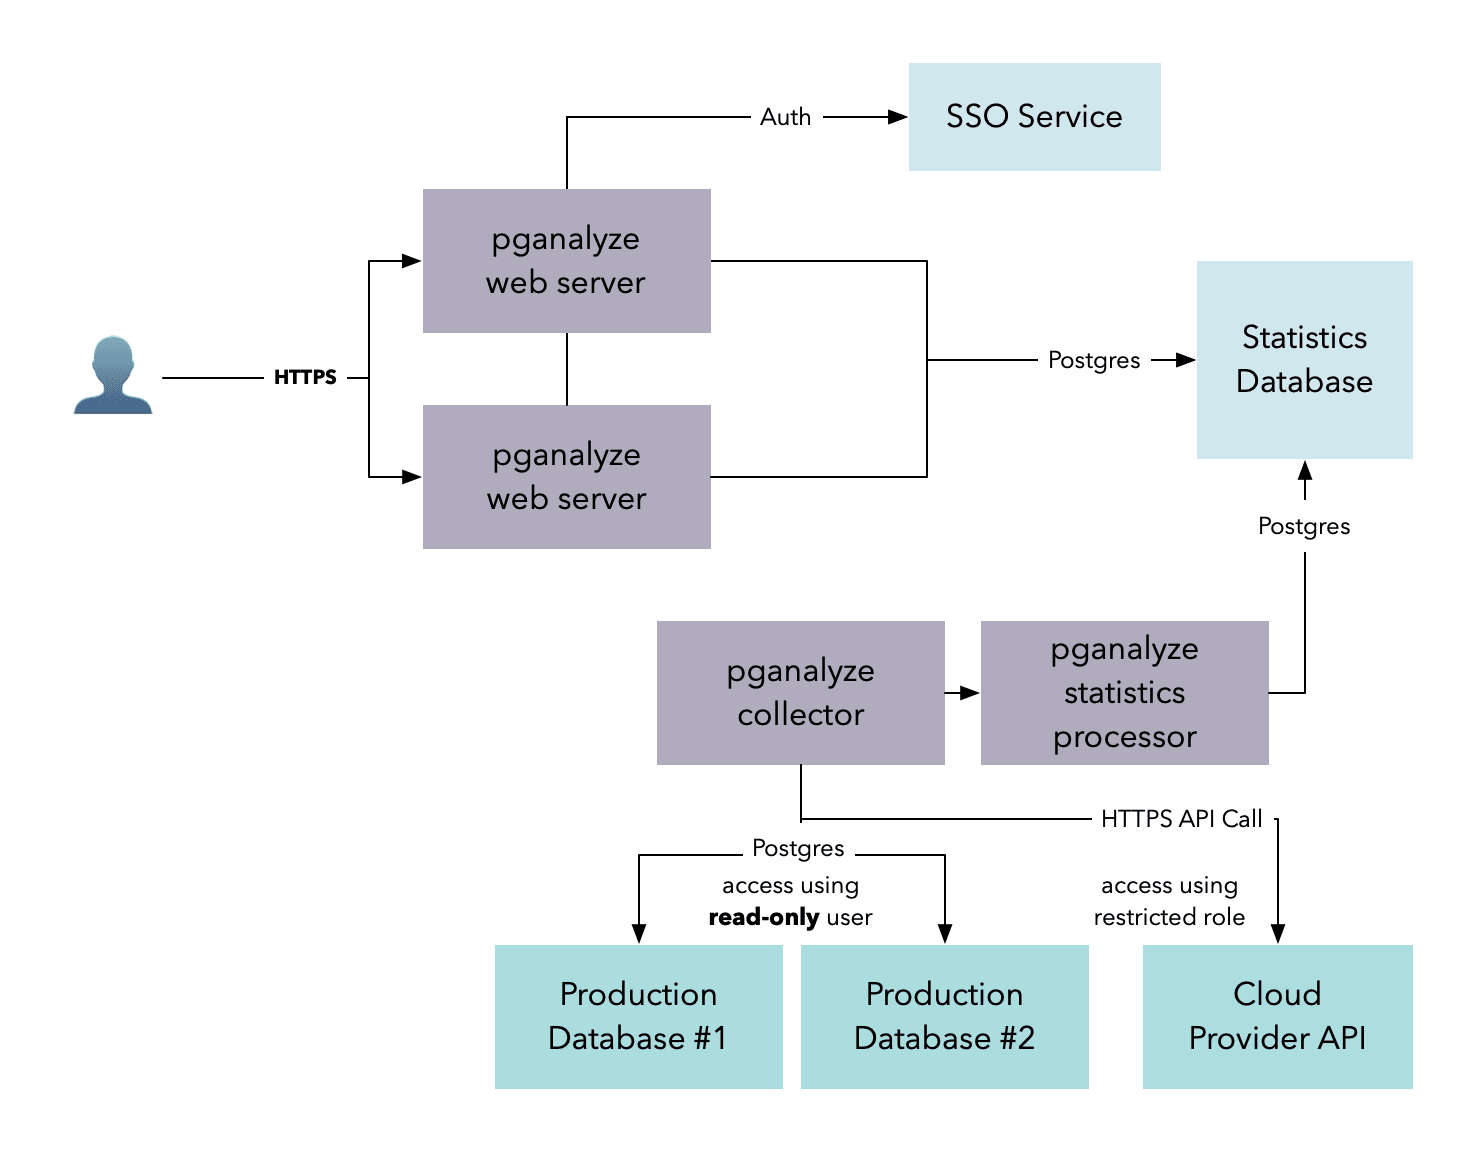
pganalyze can be run on-premise inside a Docker container behind your firewall, on your own servers.
Comply with local policies
Retain your database statistics data in the correct region of the world to comply with local policies.
Sensitive data
pganalyze normalizes query information so that only structural data is stored and presented.
SSO integration
pganalyze integrates with your Active Directory, LDAP, Okta or Google Apps setup.
