
Postgres Log Monitoring with pganalyze: Introducing Log Insights 2.0
 By Lukas Fittl
TLDR: We recently released substantial improvements to our Log Insights feature, including up to 30 day history, support for Heroku Postgres, as well as support for monitoring the log files of PostgreSQL servers running on-premise.
How pganalyze parses Postgres log files
Its now been a bit over a year since we first released the log monitoring functionality in pganalyze, and we would like to share a major update with you today.
Before diving in, a quick review how the pganalyze collector works with log data. Most existing third party tools that you can send log data to, such as Papertrail or Splunk, upon encountering Postgres log output, will just see unstructured text.
Jul 24 07:00:00am PDT [2317] LOG: automatic vacuum of table "mydb.public.vac_test": index scans: 1
 pages: 0 removed, 1 remain, 0 skipped due to pins, 0 skipped frozen
 tuples: 3 removed, 6 remain, 0 are dead but not yet removable
 buffer usage: 70 hits, 4 misses, 4 dirtied
 avg read rate: 62.877 MB/s, avg write rate: 62.877 MB/s
 system usage: CPU 0.00s/0.00u sec elapsed 0.00 sec
However, when pganalyze parses this line, we have a set of pre-defined rules and filters that automatically analyze the text, and extract the following information:
- Log event type: A65: Automatic vacuum of table completed
- Timestamp: July 24 07:00:00am (Pacific Time)
- PID: 2317
- Table: public.vac_test
- Details
- Avg Read Rate: 62.877 MB/s
- Tuples dead but not yet removable: 0
- etc.
We do the same analysis for over 100 different kinds of log events out of the box. This way you don’t have to worry about setting up custom log filters, or knowing about every possible Postgres problem.
Compared to some of the existing tools in the Postgres ecosystem which batch-process a log file you specify, pganalyze Log Insights processes data once a minute and continuously makes new events available in the pganalyze web UI.
Now, to review the new features that are part of pganalyze Log Insights 2.0:
Historic Access up to 30 days
When we first released Log Insights, the aim was to only collect data for the last 24 hours. However, often times production issues happen, but teams will only find time to run a post-mortem the next day, or the day after.
We now provide up to 30 days historic log retention, and have increased the included log retention for all accounts on the Scale plan from one day to seven days.
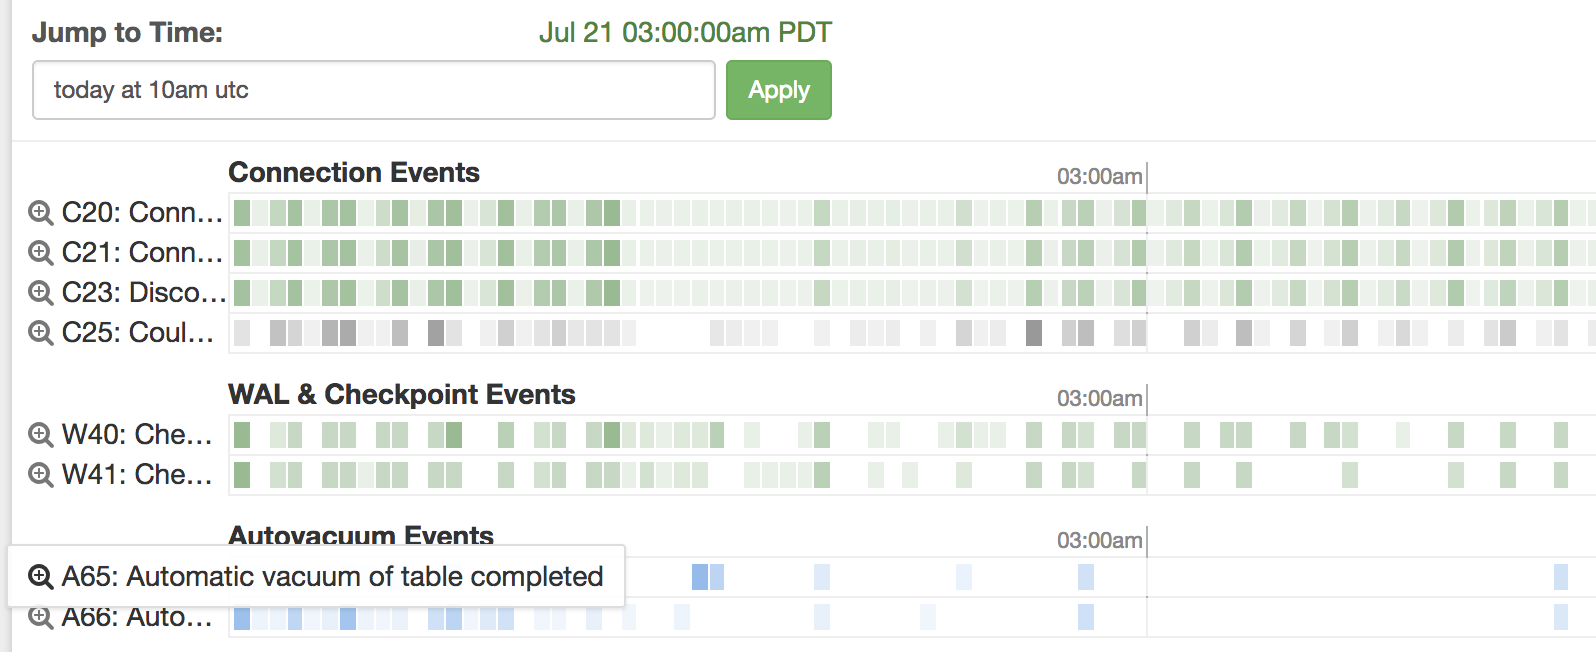
You can navigate to historic logs using the time input, and specifying a time in words like today at 10am UTC:
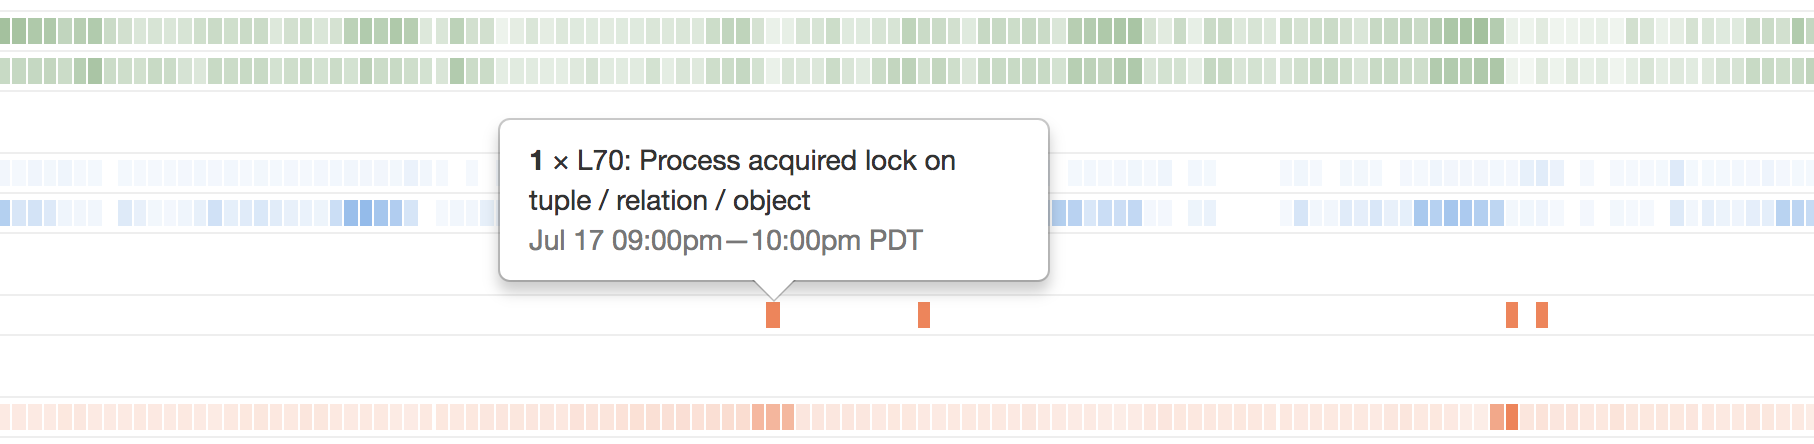
Or by clicking one of the time buckets of a specific log event, e.g. to dig deeper on a lock situation:
Support for Heroku Postgres and on-premise servers
We now support the most popular database-as-a-service cloud providers, including Heroku Postgres, Amazon Aurora and Amazon RDS.

In addition, we also support systems you configure and operate yourself, by having the pganalyze collector run on your database server and continuously tail your logs.
Getting started can be as simple as configuring db_log_location in your pganalyze collector configuration. Detailed setup guides can be found in our documentation.
VACUUM monitoring details
pganalyze already provides autovacuum monitoring based on the statistics tables, but not all information is stored in those, and the events output by log_autovacuum_min_duration can be valuable.
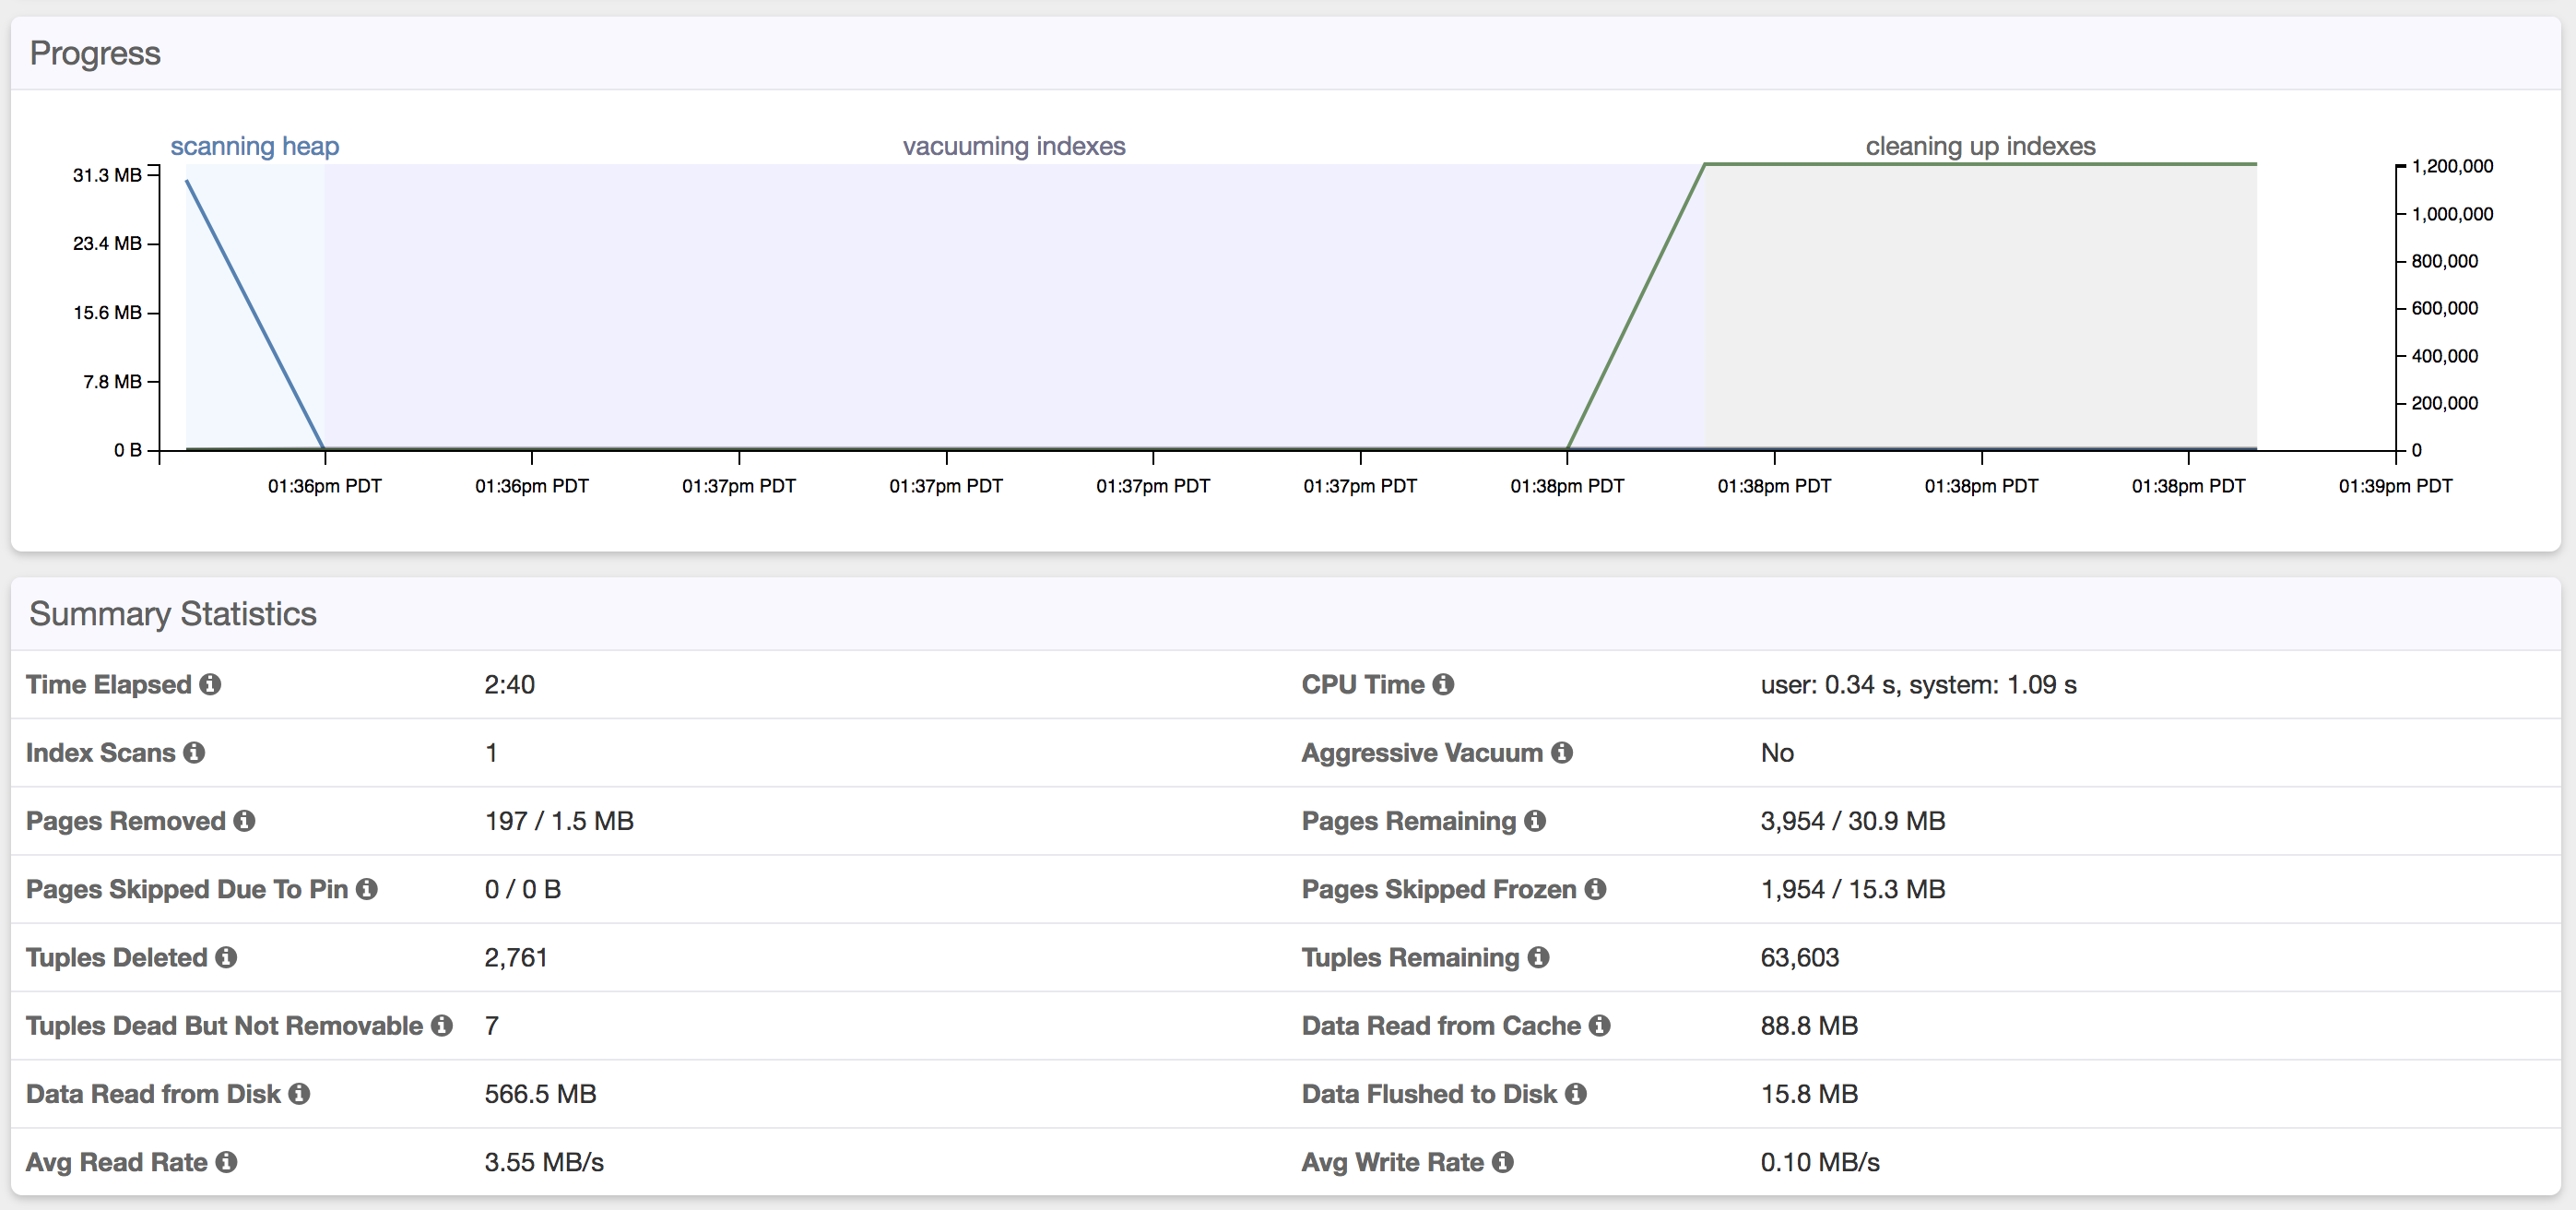
When we detect an autovacuum event, and autovacuum monitoring is active, we will automatically associate the log data to the vacuum run details, so you can see information such as tuples “dead but not yet removable” in the new VACUUM summary statistics:
Improved documentation
We now have a dedicated documentation page for every Postgres log event we detect and parse, and give you helpful tips what to do in response.
For example, you might want to learn how to react to data corruption being reported as invalid page in block or what it means when you see application errors such as subquery in FROM must have an alias.
Conclusion
This marks a significant milestone for pganalyze’s log monitoring capability, and we believe its the best tool for PostgreSQL log file monitoring today.
Give it a try with our free 14 day trial, you can sign up for a free pganalyze account here. If you don’t want to sign up right away, you might be interested to explore the pganalyze app some more in our free-to-access pganalyze demo area. We’re also happy to help you in a personal demo call. Just reach out to us if you have any questions!
For pganalyze Enterprise customers these features are part of the 2018.07.0 release.