
Find, Diagnose & Fix Slow PostgreSQL Queries
Bad indexes, wrong plans, stale statistics, I/O bottlenecks, table bloat. Any of these can tank query performance, and they often look the same on the surface.
TL;DR
Step 01
Find the root cause of your slow query
Before running a single optimization, you must determine if you are dealing with a structural flaw or a runtime regression. Chronic slowness may point to missing indexes, while intermittent spikes often signal I/O contention or plan instability.
Step 02
Benchmark with EXPLAIN (ANALYZE, BUFFERS)
Standard execution time can be misleading due to system overhead or caching. To see the ground truth of how your query interacts with physical storage, you must include BUFFERS.
Download guideWhat to look for in the output:
work_mem is too low.Step 03
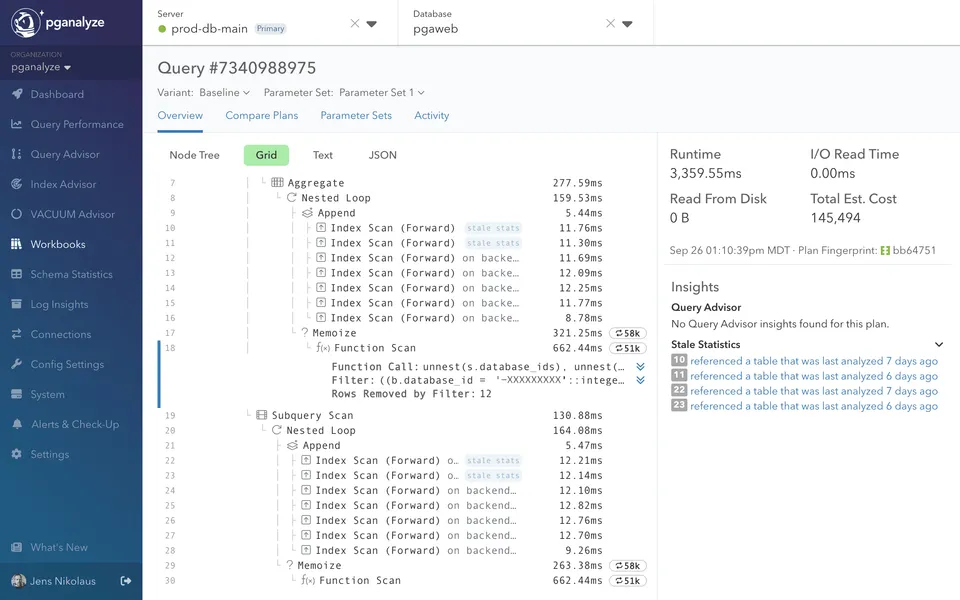
Identify the failure mode of your query
Most slow queries are one of six things. A single slow query can be affected by more than one. The EXPLAIN output, particularly buffer counts and row estimate accuracy, details which failure mode(s) you’re dealing with.
Step 04
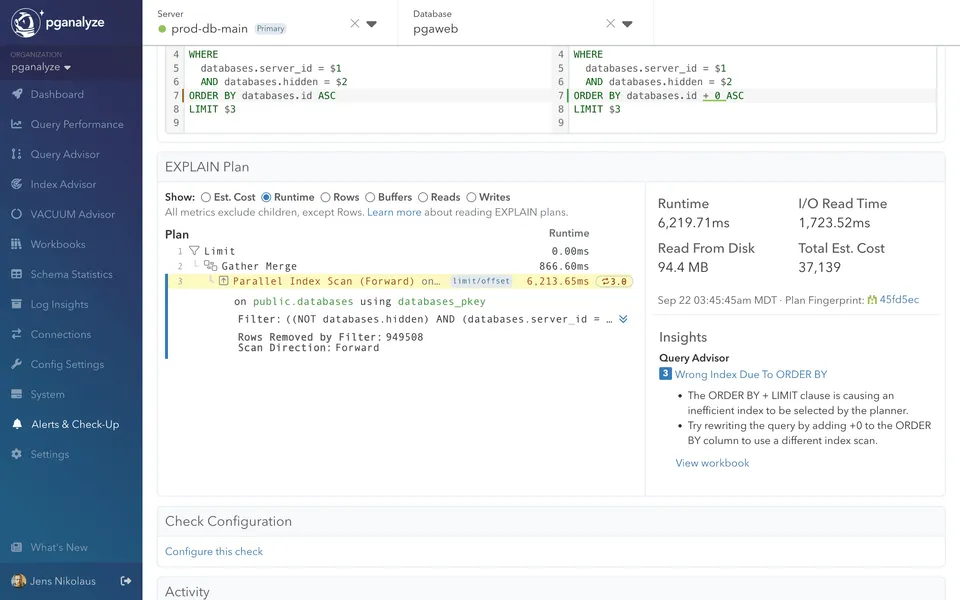
Fix the issue at the root
The fix order matters. Indexes and statistics are permanent fixes. Planner hints and scaling are not. They buy time while you address what’s actually wrong.
Add or redesign the index
Fix statistics: Use ANALYZE or CREATE STATISTICS to improve row estimates.
Rewrite the query: Use MATERIALIZED CTEs or better join logic to guide the planner.
Tune cost settings: Adjust random_page_cost or work_mem to align with your hardware.
Use planner hints: Deploy pg_hint_plan only as a temporary bridge to force good plans.
Scale resources: Increase I/O or compute only after structural fixes are exhausted.
Step 05
Verify & watch query performance
Re-run EXPLAIN (ANALYZE, BUFFERS) after each change. A real fix reduces buffer counts and brings estimated rows closer to actual—not just execution time.
Monitor the query over time, as plan regressions after bulk loads or statistics updates are common and often silent.
Signs your fix worked:
I/O drop: shared read counts decrease significantly
Accurate stats: rows= estimate is close to actual rows
Scan type: Seq Scan transitions to Index Scan
Memory sort: Sort Method: Disk moves to Memory or disappears.

Free Webinar
How to Compare Postgres Plans and Tune Slow Queries
Watch the recorded webinar on reading EXPLAIN plans, spotting regressions, and tuning queries with confidence.


The product
All-in on Postgres for Over a Decade
pganalyze is the trusted provider of deep Postgres observability and performance tuning for top companies around the world, including some of the Fortune 500.
Check out the tour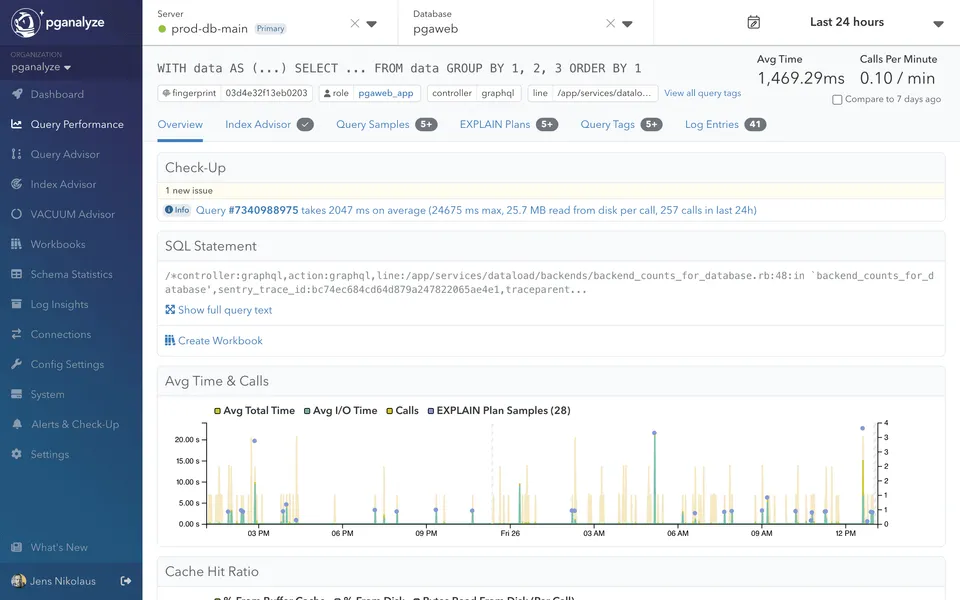


pganalyze Does This Across Your Entire Workload
Doing this manually works when you know which query to look at. The real challenge is finding the queries you’re not watching: the ones degrading quietly until they become incidents.
Generic observability tools may show you that a query is slow, but stop short of identifying what’s causing it or how to fix it. pganalyze shows you which part of the plan node is the bottleneck. Every query. All the time.
Start 14-day free trialauto_explain for every slow query — with ANALYZE and BUFFERS

Trusted by engineering teams running Postgres at scale
With pganalyze’s help, we improved a query that led to an instant CPU utilization drop from 400% down to 25% on the live database server. It was really cool to see such a dramatic difference.”
The slow query analysis and indexing recommendations significantly reduced the time we spent debugging query performance problems.”


Get in touch
Stop diagnosing slow queries one at a time
Scale your Postgres expertise. pganalyze monitors every query, collects every plan, and surfaces systemic problems—indexes, statistics, regressions, I/O, and bloat—in a single place.