


New Query Advisor Insights: Inefficient Index Use, work_mem tuning, and OR to UNION rewrite



Today, we’re excited to announce three new insights for pganalyze Query Advisor that detect common problems encountered on production databases, based on query plans that show pathological patterns. Before we jump in, some background: Last year, we released the initial version of pganalyze Query Advisor, a deterministic system that runs in the background and continuously analyzes EXPLAIN plan data that pganalyze collects from auto_explain.
Query Advisor can detect issues like many rows being filtered out due to not using the right index, and perform verifications against the schema data in pganalyze to determine if alternative query plans are available. It offers a direct recommendation on how a query could be modified. To validate the recommendation, the pganalyze Workbooks feature can be used to test an updated query with a rewrite, a settings change, or planner hints.
New Insight: Inefficient Index Use
One of the common problems we see on production databases that causes sudden slowdowns is Postgres picking the wrong index, due to statistics being off, or the index being bloated. In such situations you will get no advance notice, but suddenly your query jumps from taking a few milliseconds to multiple seconds.
When we look at a query plan, we can notice inefficient indexes due to a high “Rows Removed By Filter” value on the Index Scan:
Index Scan using orders_customer_id_idx on orders  (cost=... rows=... width=...) (actual time=... rows=12)
  Index Cond: (customer_id = 42)
  Filter: (status = 'shipped'::text)
  Rows Removed by Filter: 48213
The new “Inefficient Index Use” Query Advisor insight automatically detects such cases. When we identify the problem, the best validation is to force the use of a different index that looks more suitable, to confirm the problem. Note this doesn’t mean we create a new index—it just means that we tell Postgres to ignore incorrect costing that leads it to picking the wrong index.
In existing Postgres versions, the best way to do so is the pg_hint_plan extension. With the upcoming Postgres 19 we will also be able to use the new pg_plan_advice module to force particular query plans. In the example above, we can use a hint like this to test a different index:
/*+ IndexScan(orders orders_customer_id_status_idx) */
SELECT * FROM orders
WHERE customer_id = 42 AND status = 'shipped';
Which gives us a different plan that performs better—note the lack of Rows Removed by Filter on the Index Scan:
Index Scan using orders_customer_id_status_idx on orders  (cost=... rows=... width=...) (actual time=... rows=12)
  Index Cond: (customer_id = 42 AND status = 'shipped'::text)
With this confirmed, it’s usually best to further debug the root cause. For example, if the index that was not being used is bloated (which can be confirmed with pgstatindex), a REINDEX CONCURRENTLY might be in order.
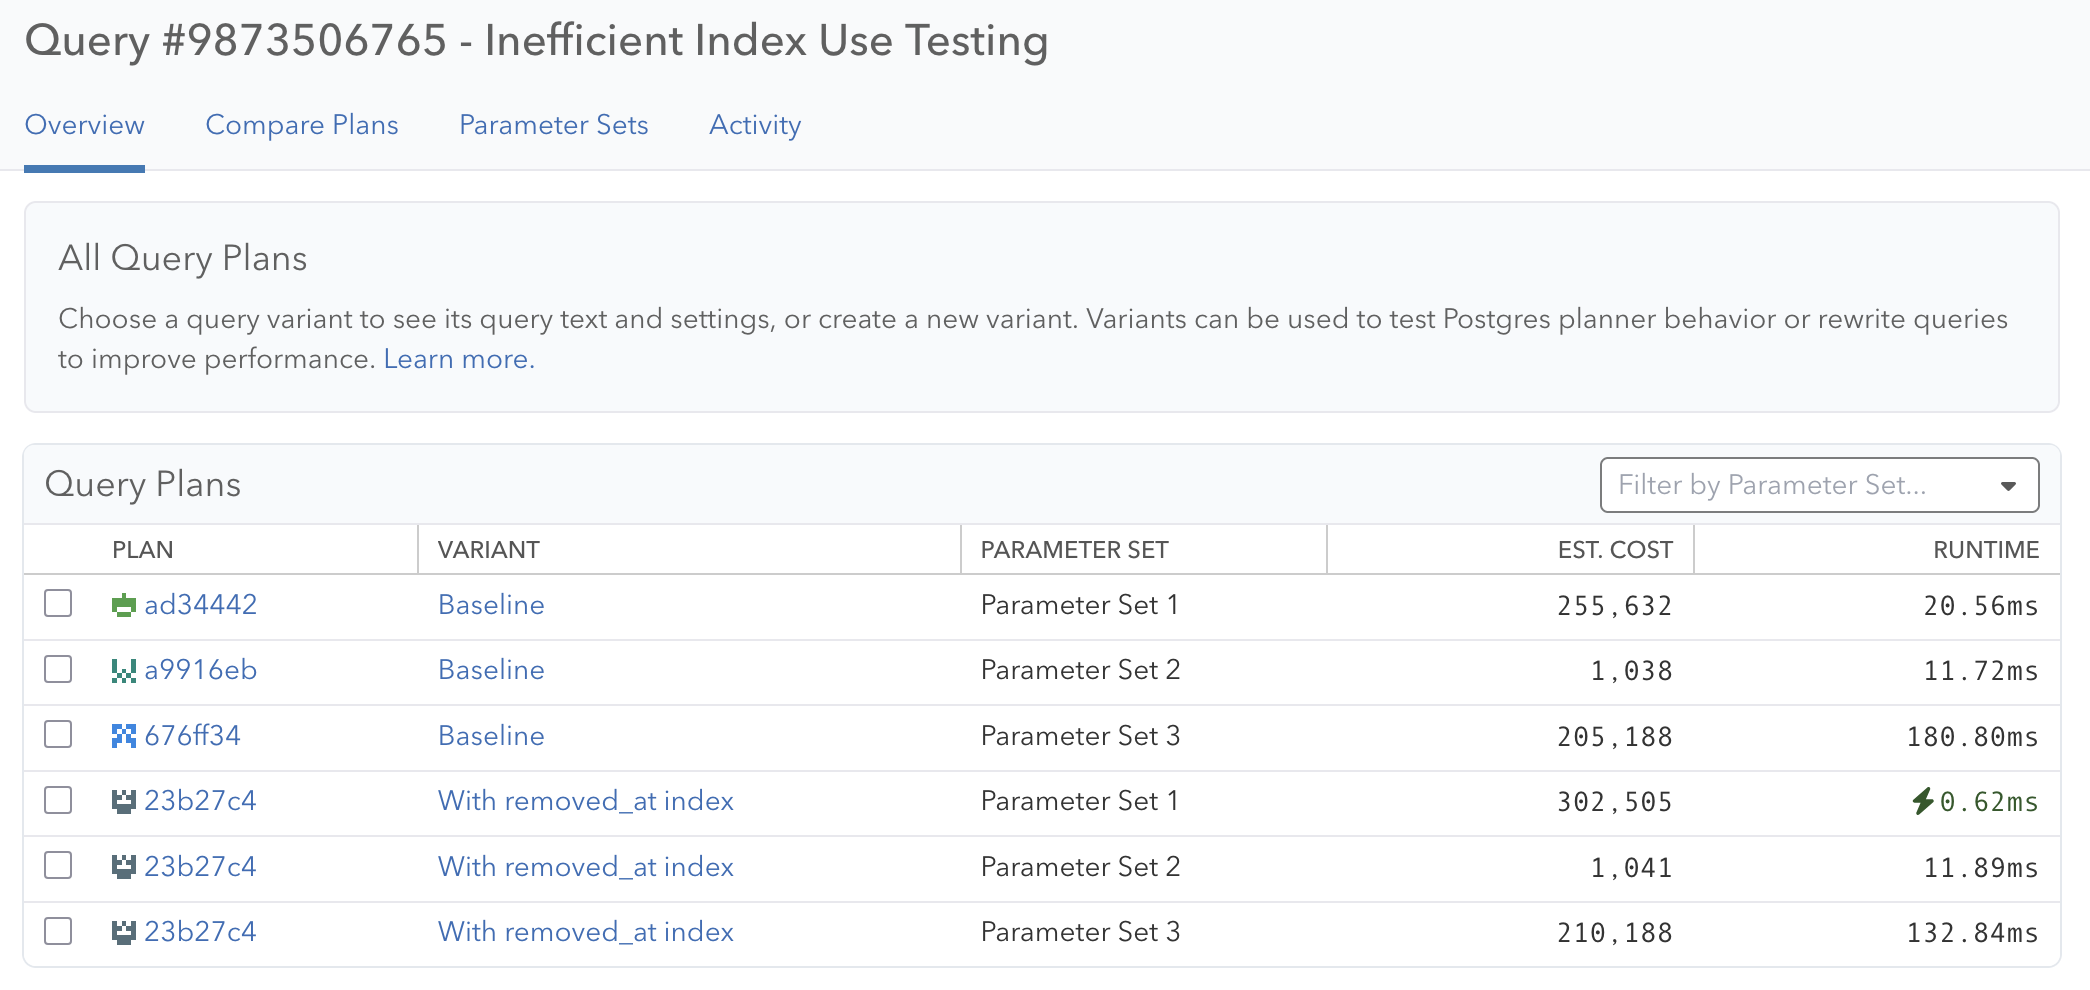
pganalyze Query Advisor helps us prioritize and proactively identify such cases, so we can know about it right away, instead of seeing significant production impact until the root cause is found. To give a practical example, when testing this insight, we’ve found a 20x improvement on a query where Postgres picked the wrong index:
New Insight: Disk Spill Due To Low work_mem
When a query contains an “ORDER BY” or “GROUP BY” clause, Postgres often has to sort or aggregate results before returning them to the client. If the data set being sorted is large, such sorts can’t be done in memory all at once, but instead have to be processed in batches with temporary files on disk serving as the staging area.
A similar disk spill mechanism is used for Hash Joins when the size of the data is large. Queries can often be noticeably slowed down when such spills happen, driven by the amount of data being sorted/hashed, and the work_mem setting.
When we look at an example query plan, we can see that this sort was executed on disk, and the size of the sort operation:
Sort  (cost=... rows=... width=...) (actual time=... rows=...)
  Sort Key: (count(*)) DESC
  Sort Method: external merge  Disk: 11456kB
  Buffers: shared hit=54504 dirtied=2, temp read=32453 written=32552
Similarly, with a Hash Join, we can observe a disk spill by looking at the Hash Batches information on the Hash node:
->  Hash Join  (cost=... rows=... width=...) (actual time=... rows=... loops=...)
      Hash Cond: (table1.id = table2.table1_id)
      ->  Seq Scan on table1  (cost=... rows=... width=...) (actual time=... rows=... loops=...)
      ->  Hash  (cost=... rows=... width=...) (actual time=... rows=... loops=...)
            Buckets: 131072  Batches: 8  Memory Usage: 1030kB
            ->  Seq Scan on table2  (cost=... rows=... width=...) (actual time=... rows=... loops=...)
pganalyze Query Advisor now detects both sort and hash operations that spill to disk, and recommends a specific work_mem increase that is sufficiently large to cover the operation:
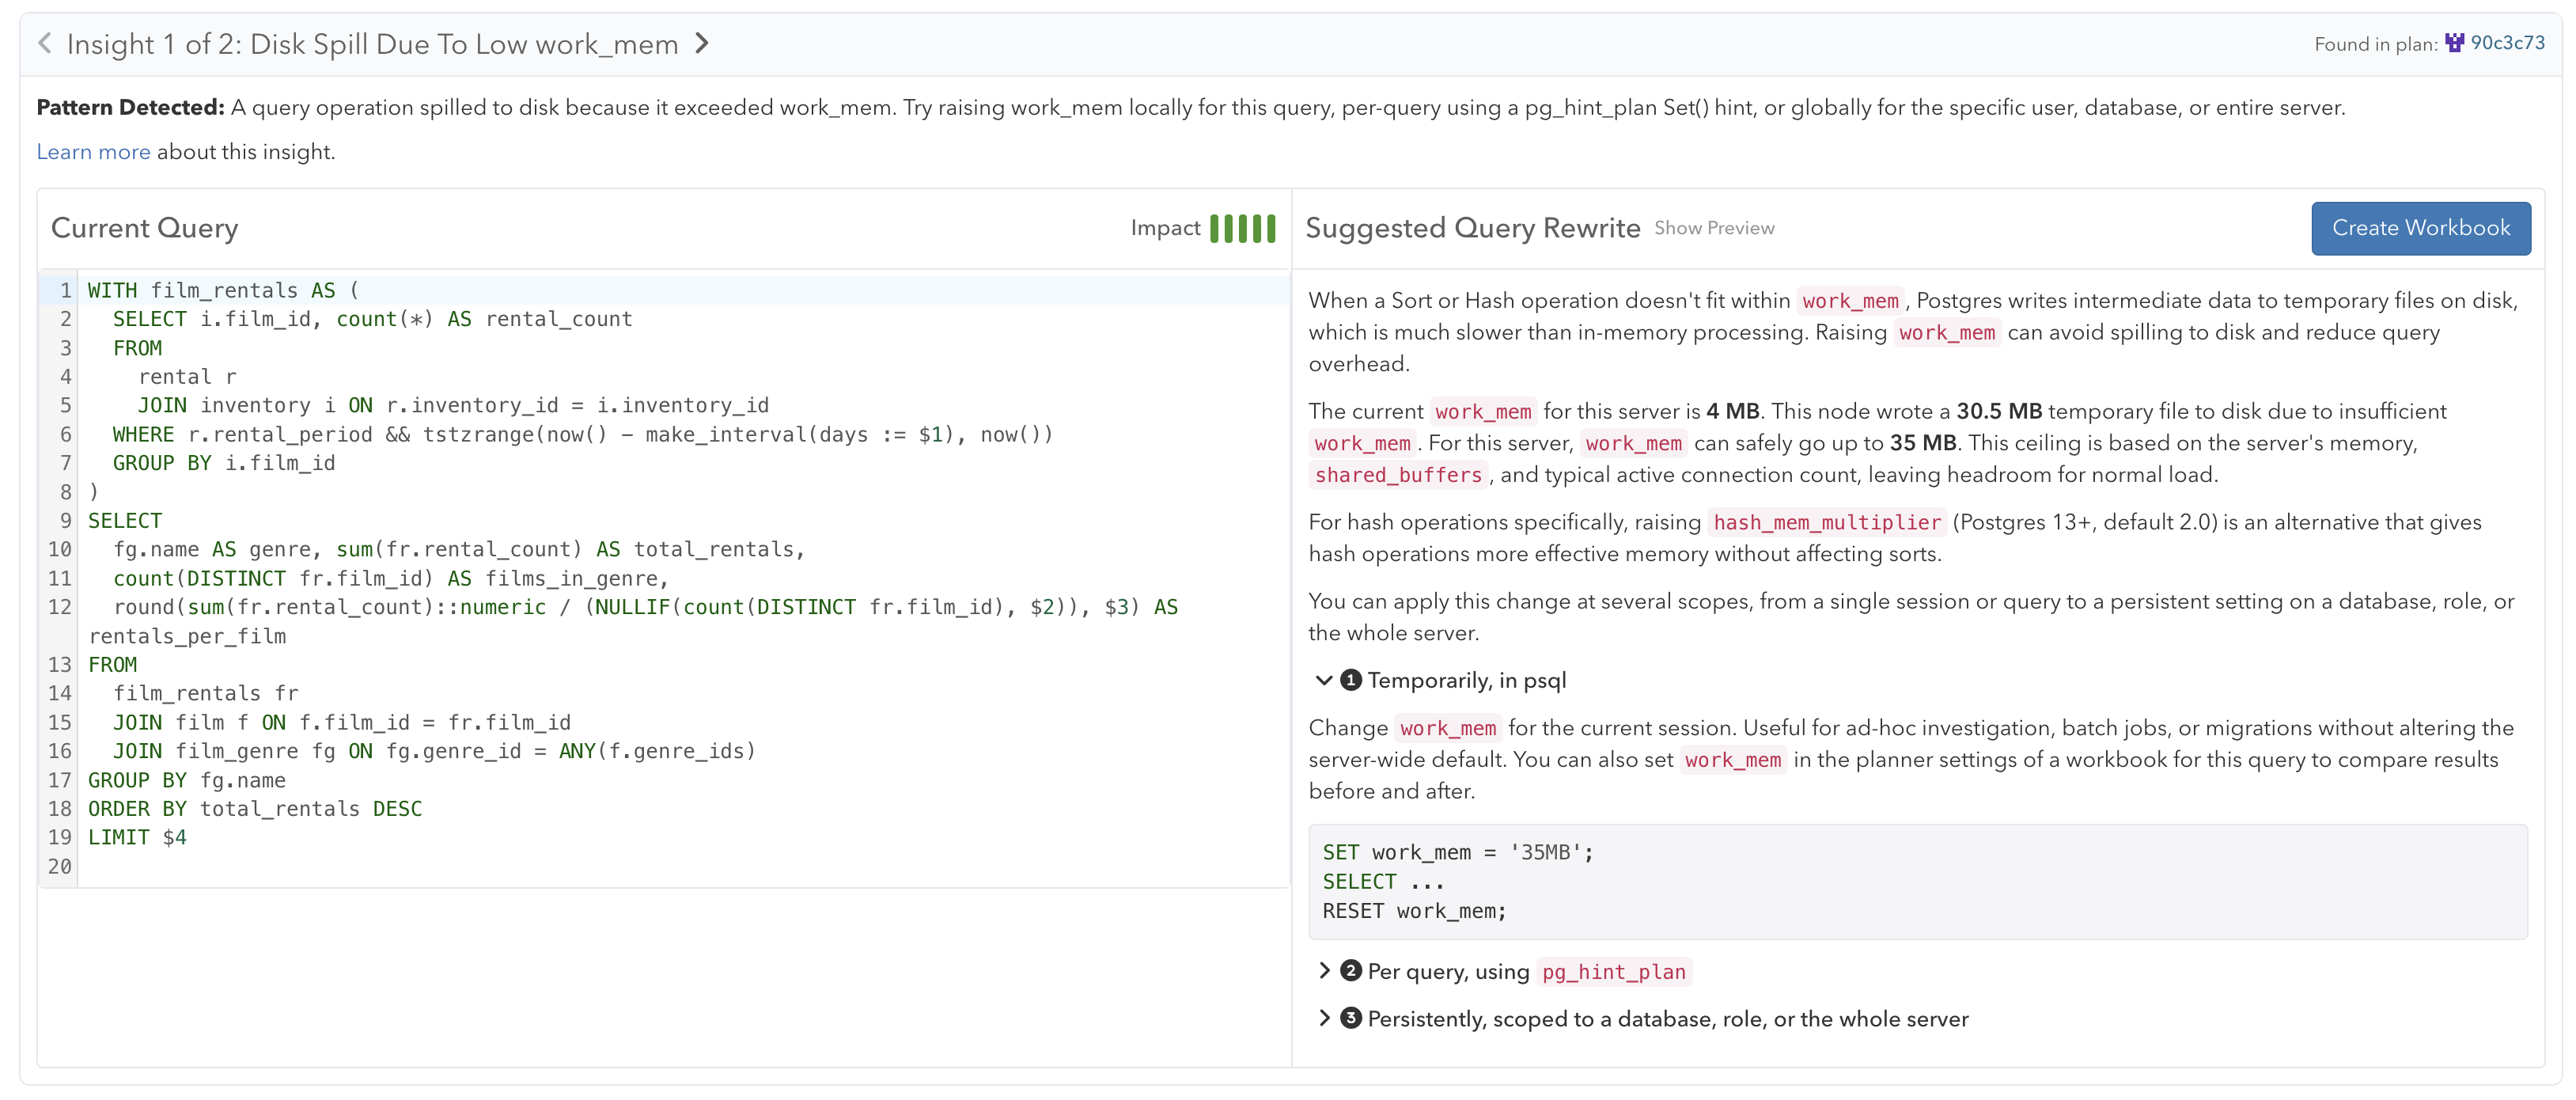
This is bounded by how much of the server’s available memory can safely go to each connection, capped at 256 MB. When considering a work_mem increase it’s worth watching out for changes in aggregate memory use across connections, and keeping in mind that work_mem affects individual plan nodes. For hash operations, work_mem gets multiplied by hash_mem_multiplier (default 2.0).
New Insight: Late Join Filter with OR
Last but not least, we’re introducing a new insight that covers a common gotcha that seasoned DBAs will be familiar with: In certain queries, when an indexable clause is combined with another table through an OR statement, Postgres is unable to use such indexes:
SELECT *
 FROM orders o
 JOIN customers c ON o.customer_id = c.id
 WHERE o.status = 'shipped' OR c.country = 'US';
We can observe the inability to use an index through a Join Filter appearing on the Join node, instead of an index condition:
Nested Loop  (cost=... rows=... width=...) (actual time=... rows=...)
  Join Filter: ((o.status = 'shipped'::text) OR (c.country = 'US'::text))
  Rows Removed by Join Filter: ...
In certain cases, it makes sense to rewrite such queries to use a UNION instead, enabling Postgres to use an index on one of the tables. Note its worth ensuring its not a problem how duplicates are handled in the UNION.
SELECT *
 FROM orders o
 JOIN customers c ON o.customer_id = c.id
 WHERE o.status = 'shipped'
UNION
SELECT *
 FROM orders o
 JOIN customers c ON o.customer_id = c.id
 WHERE c.country = 'US';
pganalyze Query Advisor now flags such cases where OR conditions reference two different tables and suggests testing a UNION rewrite. If you’re interested in the full theory behind this, Laurenz Albe wrote a good series of blog posts that still holds true today, including why Postgres does not do this automatically.
In conclusion
The new Query Advisor insights are now available on all current pganalyze Scale and Enterprise plans when auto_explain is set up with the recommended settings. EXPLAIN plans are automatically analyzed for insights when they come in, and proactive notifications, for example through Slack, are available. You can find the full details in the Query Advisor documentation.
If you’re interested in how to use pganalyze Workbooks effectively to test insights, we’re working on a new integration with the pganalyze MCP Server that allows AI tools to perform end-to-end validation of suggested Query Advisor rewrites and settings changes. Learn more about it in our July 30th webinar, together with other stories on how to use the pganalyze MCP Server effectively.