
Fix Postgres Table Bloat & Tune Autovacuum Performance
Tables growing out of control, autovacuum falling behind, or unexplained I/O spikes? Learn how to find what is blocking VACUUM, tune it table by table, and keep your queries fast.
Why do Postgres tables bloat?
Tables bloat when VACUUM can't keep up with dead rows, or something blocks it from removing them.
How to fix Postgres table bloat in 5 steps
Step 01
Understand why your table is bloated
Before tuning anything, confirm what you're actually dealing with. Bloat isn't just "the table is big." It's dead space inside the table that VACUUM hasn't reclaimed or can't reclaim.
With pganalyze, bloat estimates come from column statistics, so every table is tracked without copy and pasting estimation queries.
Step 02
Track autovacuum with Postgres logs
Storage metrics won't tell you why VACUUM is failing. Turn on log_autovacuum_min_duration = 0 (or a low threshold like 10 seconds) and every run leaves a log event that you can analyze later: pages removed, dead tuples not yet removable, index scan phases. Without it, the diagnosis in Step 3 is guesswork.
What to look for in the log output:
Step 03
Identify the failure mode
Most VACUUM problems fall into one of four categories. They can overlap. Your autovacuum logs and system statistics detail which failure mode you're dealing with. Knowing the difference between an I/O bottleneck and an xmin blocker saves you from making the wrong configuration changes.
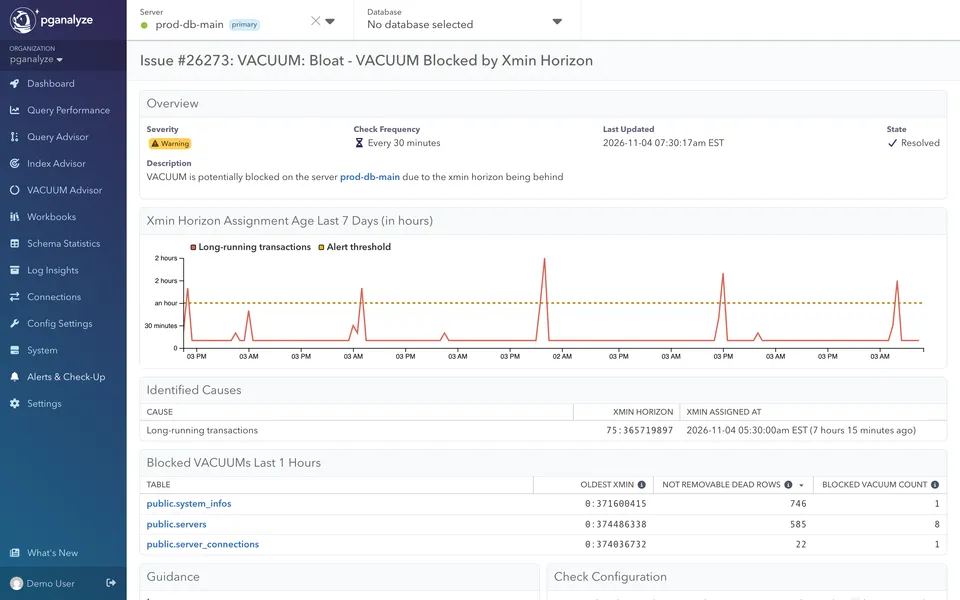
With pganalyze, the xmin horizon is tracked in calendar time, and you get an alert when a long-running query or stale slot blocks cleanup.
hot_standby_feedback.autovacuum_vacuum_scale_factor being too high for large tables.autovacuum_work_mem too low.autovacuum_max_workers too low, anti-wraparound vacuums hog remaining capacity.Step 04
Fix the issue at the root
The fix order matters: remove blockers before you tune thresholds.
Blanket server-wide changes can cause I/O spikes, so targeted table-level tuning is usually the better approach.
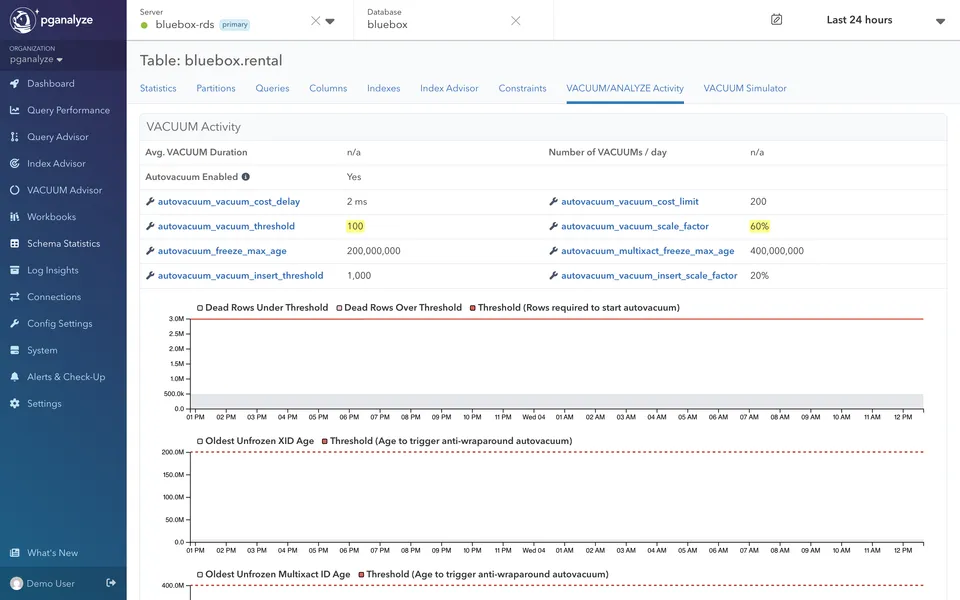
With pganalyze, the VACUUM Simulator shows how a settings change affects scheduling on your real data, and the Insufficient VACUUM Frequency insight recommends per-table values.
Consider killing long-running idle transactions: Logs show 0 tuples removed with non-zero tuples dead but not yet removable. Set idle_in_transaction_session_timeout and check replication slots and prepared transactions.
Tune per-table autovacuum settings: Large tables on default scale factor. Set it to 0 and use a fixed threshold sized to the table (for very large tables, 1 million dead rows is a common starting point). If your config predates Postgres 12, also drop the cost delay from the old 20ms default to the modern 2ms.
Adjust freeze settings: Anti-wraparound vacuums firing too often. Raise autovacuum_freeze_max_age from 200M to 400M+. Lower vacuum_freeze_min_age on large tables for more eager freezing.
Run pg_repack for severe existing bloat: table is many times its expected size. VACUUM marks space reusable but won't shrink the file. Mostly online, with brief exclusive locks at the start and end.
Check cloud and version specifics: RDS/Aurora adaptive autovacuum is a safety net, not a strategy, and Aurora's network-based storage changes the vacuum cost model, so revisit cost settings. Cloud SQL's maintenance mode flag grants extra transaction IDs once wraparound protection has stopped writes. For multi-hour vacuums with repeated index phases, upgrade to Postgres 17+ (9 index phases dropped to 1 in our PG16 vs PG17 test).
Step 05
Verify & keep watching
Re-check pgstattuple output and autovacuum logs after each change. A real fix shows up as lower free space percentage on a table, higher tuples-per-page density, and shorter VACUUM runtimes.
VACUUM problems recur. Write patterns change, tables grow, new long-running queries appear. One-time fixes drift.
With pganalyze, frozen XID age is monitored across all databases, with alerts well before wraparound protection stops writes. See the side-by-side ↓
Signals your fix worked:
Table size drops after repack and stays small with tuning: Bloat is resolved and new writes are filling reclaimed space.
Dead tuples not yet removable = 0 on each run: VACUUM is no longer blocked by long-running transactions.
No anti-wraparound vacuums on busy tables in logs: Freezing is keeping up via regular vacuums.
VACUUM runtime drops from hours to minutes: Cost delay or index cleanup bottleneck resolved.

Free Ebook
Tuning Autovacuum for Best Postgres Performance
The full guide to autovacuum: how VACUUM works, why bloat and wraparound happen, and the per-table settings that keep both under control.


The product
See how pganalyze surfaces & resolves autovacuum issues
pganalyze continuously monitors autovacuum activity, bloat growth, and transaction ID age across your entire Postgres fleet.
Check out the tour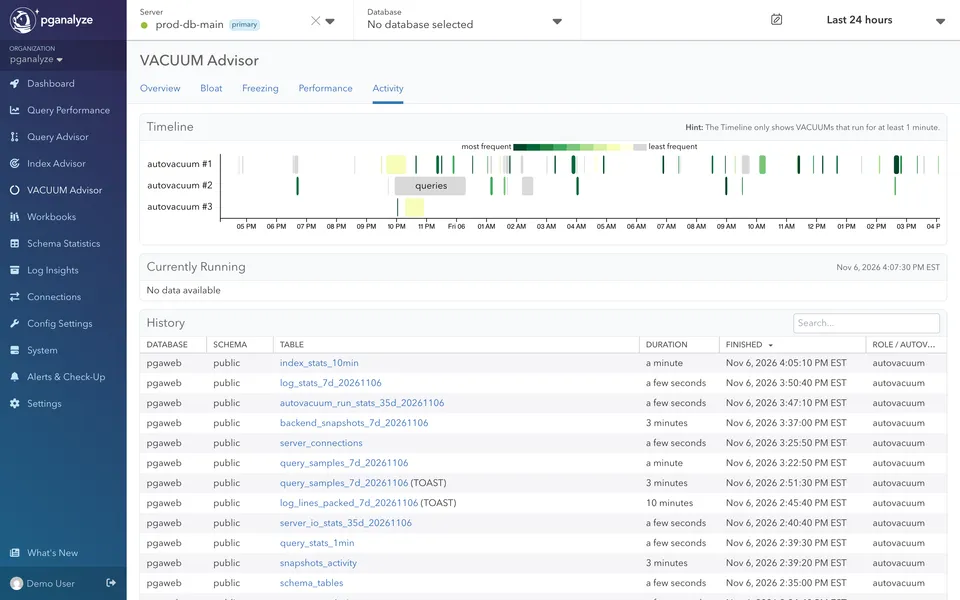


Stop diagnosing storage issues one table at a time
Doing this manually works when you already know which table is bloated. The harder problem is catching VACUUM issues before they become incidents: across every database, every table, all the time.
Monitoring tools show that storage is growing, but most stop at top-level VACUUM metrics, and cloud auto-tuning only adjusts server-wide settings. pganalyze shows you what is blocking VACUUM and recommends settings per table, with alerts when cleanup stalls.
Start 14-day free trialpg_stat_activity is actually blocking VACUUM.

Trusted by engineering teams running Postgres at scale
We could see 8,885,770 rows for mot_vehicle, but vacuum hadn't run in over 24 hours. The power came from pganalyze, understanding when vacuum was needed and why it hadn't happened yet.”
We couldn’t understand why our database was struggling so much with things like vacuums. It was just hard to get visibility into what is happening in the internals. None of the tools we had, like RDS Performance Insights or application-level logging, gave us the deep insights we needed.”






Get in touch
Every table, every VACUUM run, one place
pganalyze monitors every table and tracks every VACUUM run, surfacing systemic problems like bloat, wraparound risk, and blocked cleanup all in one place.
Platform Support: Works with RDS, Aurora, Google Cloud SQL, Azure Database for PostgreSQL, and self-managed Postgres.