


Find and fix slow Postgres queries on Supabase and Neon with pganalyze
 By Ryan Booz
Postgres databases are being created faster than ever, and increasingly not by humans. Databricks reports that over 80 percent of the databases provisioned on Neon are created by AI agents rather than people. On Supabase, more than 60 percent of new databases are launched via AI tools, with Claude Code being the largest contributor so far in 2026. I see this in my own development sessions: AI-assisted tools comb the schema with one-off queries, iterating until they find what they need. Building an app on Postgres has never been faster. But every app that succeeds reaches a moment where it needs more than just new features added. It needs attention on stability and performance. The AI tool that created your database in seconds didn’t tune it for what your workload became.
That moment is what pganalyze is built for, and today we’re excited to announce support for Supabase and Neon as supported system types, starting with collector release v0.72.0. You get the same workflow you may know from monitoring Postgres on RDS, Aurora, or self-managed servers: continuous query performance statistics collected from pg_stat_statements, schema statistics, Log Insights, and, on Supabase, EXPLAIN plan collection through auto_explain.
How monitoring works on Supabase and Neon
Neither platform gives you a host to install an agent on, so the pganalyze collector runs on your own infrastructure instead: a small VM or container with at least 1GB of RAM works well. From there it connects to your database over the network and collects query and schema statistics continuously over time.
Logs work differently than on providers where the collector polls an API. Both Supabase and Neon push logs using OpenTelemetry: the collector exposes an OTLP HTTP endpoint (the db_log_otel_server setting), and the platform sends Postgres log data to it. That means the collector needs to run somewhere with a stable, publicly reachable address, and for additional security, we recommend putting a TLS-terminating reverse proxy (e.g. with AWS ALB) in front of the endpoint. Once logs arrive, they get stored in pganalyze Log Insights just like on any other supported platform.
How to monitor Supabase database performance
To monitor Supabase database performance with pganalyze, you connect the collector to your project’s database, add a log drain for Log Insights, and enable auto_explain for EXPLAIN plans. Query monitoring starts with pg_stat_statements (if you want to know exactly what it can and can’t tell you, I have a six and soon to be seven-part deep dive on it), and Supabase enables it by default on every project, so step one is usually just a verification. One detail worth knowing: Supabase installs extensions into a dedicated extensions schema rather than public, and the installation guide for Supabase covers granting your monitoring user access to it.
After creating the monitoring user, you install the collector on your own infrastructure and configure it with your project’s connection details from the Supabase dashboard. For logs, you create a Supabase log drain that sends Postgres log data to the collector’s OTLP endpoint.
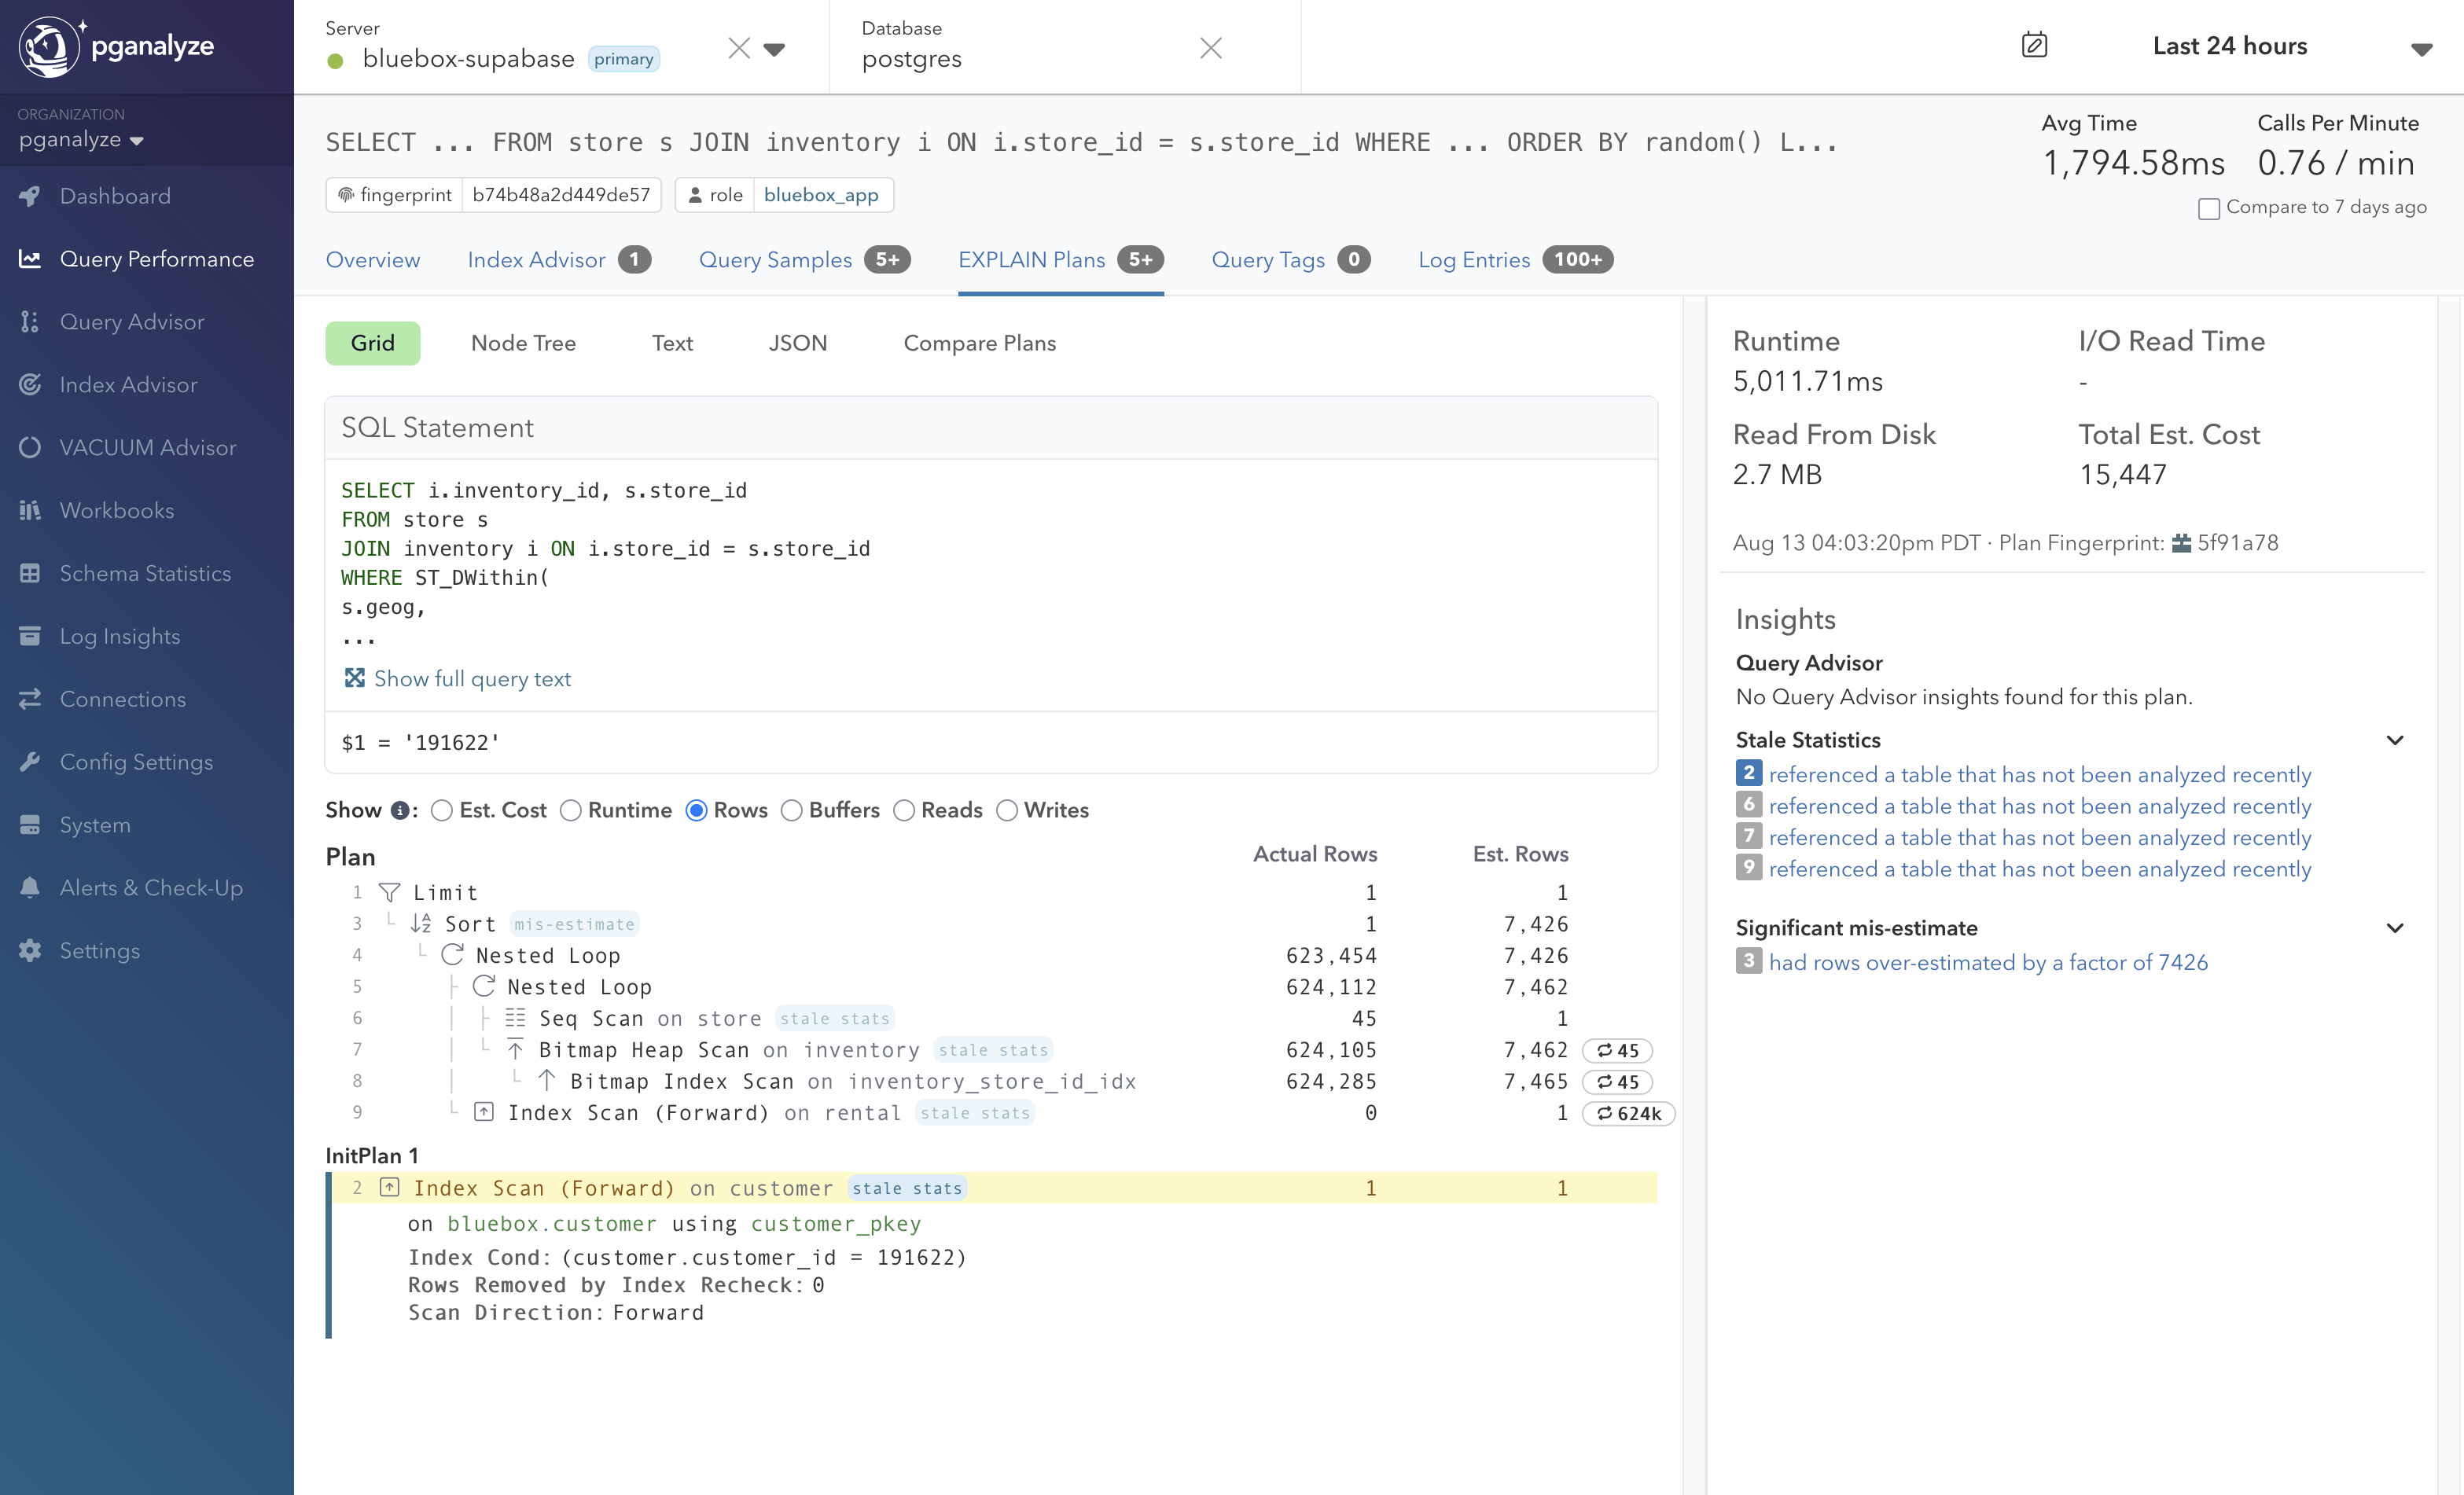
Supabase also supports auto_explain, which unlocks one of the most valuable parts of pganalyze: automatic collection of EXPLAIN plans for your slow queries. The EXPLAIN setup guide for Supabase walks through checking whether auto_explain is active, enabling it, and reviewing the recommended settings. With plans coming in, features that build on EXPLAIN plan data, such as Automated EXPLAIN insights and Query Advisor recommendations, work on your Supabase databases the same way they do elsewhere.
How to monitor Neon database performance
To monitor Neon database performance with pganalyze, you point the collector at the branch you want to monitor and add Neon’s OpenTelemetry integration for logs. One Neon concept matters here: every branch in a Neon project has its own connection string, its own compute, and its own set of roles. Statistics live with the branch, so you set up monitoring per branch, typically just for your production branch.
Setup follows three steps, walked through in the installation guide for Neon:
- Enable the
pg_stat_statementsextension on the branch you want to monitor - Create a dedicated monitoring user (we recommend not reusing your default Neon role)
- Install the collector on your own VM or container and point it at the branch’s connection string
To collect logs, Neon offers an OpenTelemetry integration, currently in Beta on Neon’s side and available on the Neon Scale plan, that pushes Postgres logs to the collector’s OTLP endpoint. You configure it directly from the Integrations page in the Neon Console. Note that Neon currently does not support auto_explain.
Availability
Supabase and Neon support is available now for all pganalyze customers using collector v0.72.0 or newer. For self-managed installations, both system types are included in Enterprise Server v2026.08.0.
If you’re running Postgres on Supabase or Neon, I hope this gives you the visibility that’s been missing. Connect a project and see what your first week of data tells you.
Try it now
- Sign up or log in to pganalyze and follow the in-app setup instructions for Supabase or Neon.
- Supabase installation guide for the full setup, including the log drain and
auto_explain. - Neon installation guide for the full setup, including the OpenTelemetry log integration.
Get a demo or talk to us
- Schedule a demo for a customized 1:1 walkthrough with our team.
- Let us know what you think if you’re running Postgres on Supabase or Neon and there’s something else you’d like pganalyze to support.