


Step 1: Set up OpenTelemetry Logs
Neon allows you to enable an OpenTelemetry integration that pushes Postgres logs (currently in Beta on Neon’s side) to an OpenTelemetry (OTLP) endpoint that the pganalyze collector exposes.
The OpenTelemetry integration requires the Neon Scale plan.
Expose an OpenTelemetry endpoint on the collector
The pganalyze collector can receive logs over OTLP using the
db_log_otel_server setting.
[pganalyze]
api_key = your_pga_organization_api_key

[server1]
db_host = ep-your-endpoint-id.your-region.aws.neon.tech
db_name = your_database_name
...
db_log_otel_server = 0.0.0.0:4318
Neon’s infrastructure needs to reach this endpoint over the public internet, so keep the following in mind:
- Run the collector somewhere with a stable, publicly reachable address (a small VM works well)
- We highly recommend running the collector behind a TLS-terminating reverse
proxy or load balancer in front of the
db_log_otel_serverport to provide ahttps://endpoint URL - The collector’s OTLP receiver does not itself authenticate incoming requests. Neon’s integration setup lets you configure an auth header (e.g. a bearer token) to send with every request, but the collector does not currently validate it — restrict network access to the endpoint (e.g. via firewall/security group rules) wherever possible instead
Add the integration in the Neon Console
In the Neon Console, go to your project’s Integrations page, find the OpenTelemetry card, and click Add:
- Enable the Postgres logs toggle (project metrics are not currently used by pganalyze)
- Protocol: HTTP
- Endpoint: the base URL of your collector, e.g.
https://your-collector-host(Neon appends/v1/logsautomatically) - Authentication: optional — leave blank, or set a placeholder value, since the collector doesn’t check it
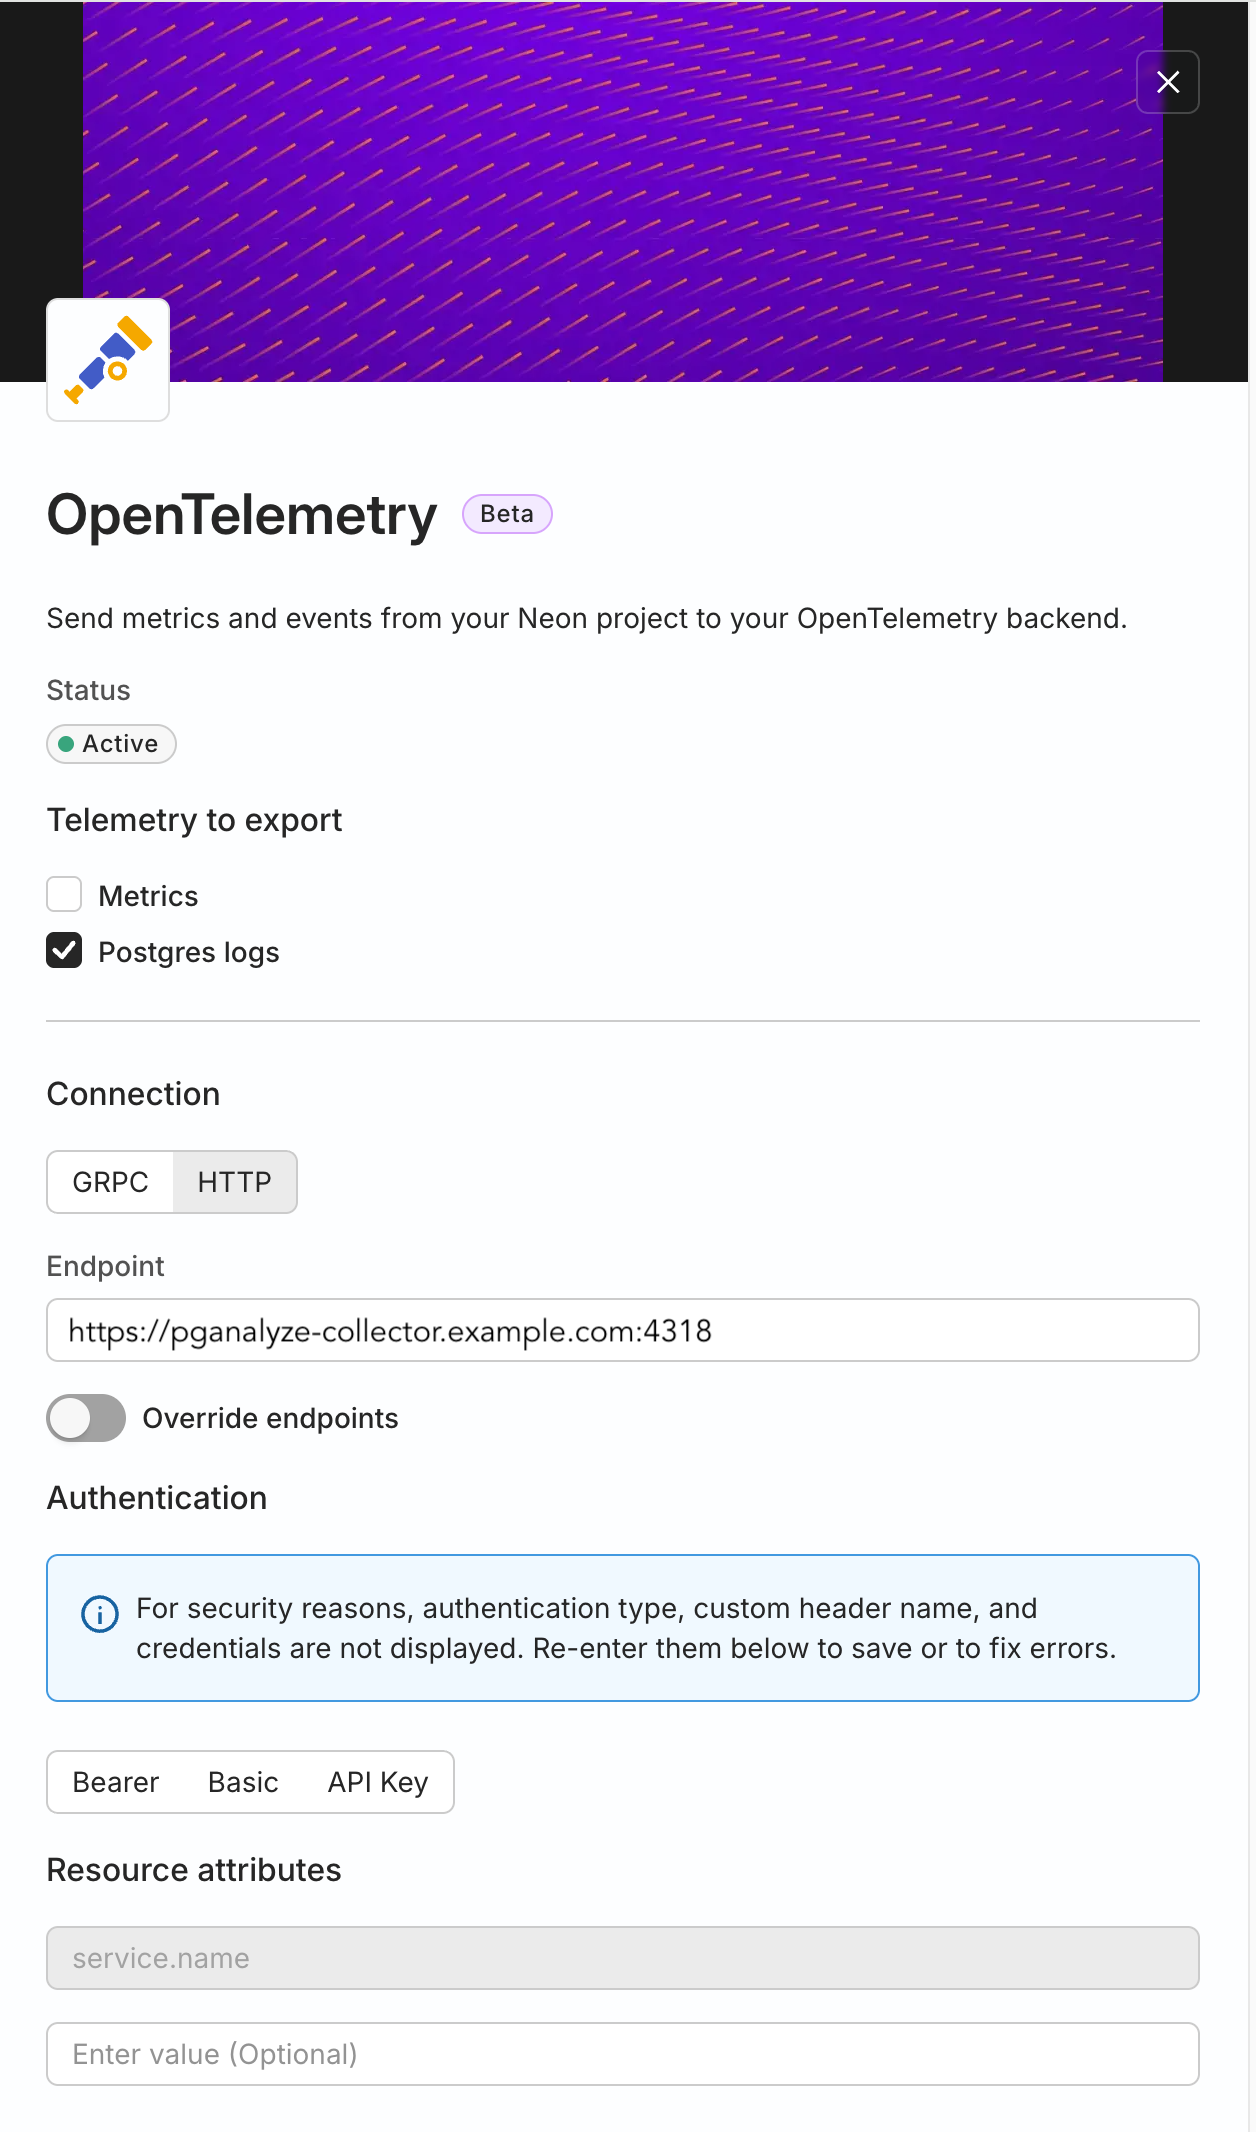
Neon sends logs from every compute in the project to this integration once enabled, so you don’t need to configure anything per-branch. Note that Neon computes only emit logs while they’re active — a suspended (auto-suspended) compute won’t produce any log data until it wakes up.
Test and verify
Run the following on the collector host to verify the configuration:
sudo pganalyze-collector --test-logs --reloadIf the test doesn’t pick up a log line right away, make sure the compute you’re testing against isn’t suspended (run a query against it first to wake it up), and that the OpenTelemetry integration is enabled and pointed at the correct endpoint.
Once ready, you will see log events on the Log Insights page in pganalyze.
Note that pganalyze’s Automated EXPLAIN feature is not currently supported on Neon — see the Automated EXPLAIN overview for details.
Couldn't find what you were looking for or want to talk about something specific?
Start a conversation with us →