


MCP Server (Preview)
The pganalyze MCP (Model Context Protocol) server allows AI assistants to interact with your pganalyze data. This enables AI coding tools like Claude Code, Codex, or Cursor to query server metrics, inspect EXPLAIN plans, run the Index Advisor, and review active issues. A separate set of Workbooks tools (in early access) can additionally create workbooks and run new EXPLAIN ANALYZE executions through the collector to test query rewrites and planner settings.
The pganalyze MCP server is currently in public preview, and available on current pganalyze plans. If you are on a legacy plan you may need to upgrade to access the MCP Server.
For a demo of the MCP server in action, watch the webinar recording:
Enabling the MCP server
Admins can enable or disable the MCP server for the entire organization from the API Access settings page. New organizations have the MCP server enabled by default; organizations created before the public preview have it disabled and need to opt in.
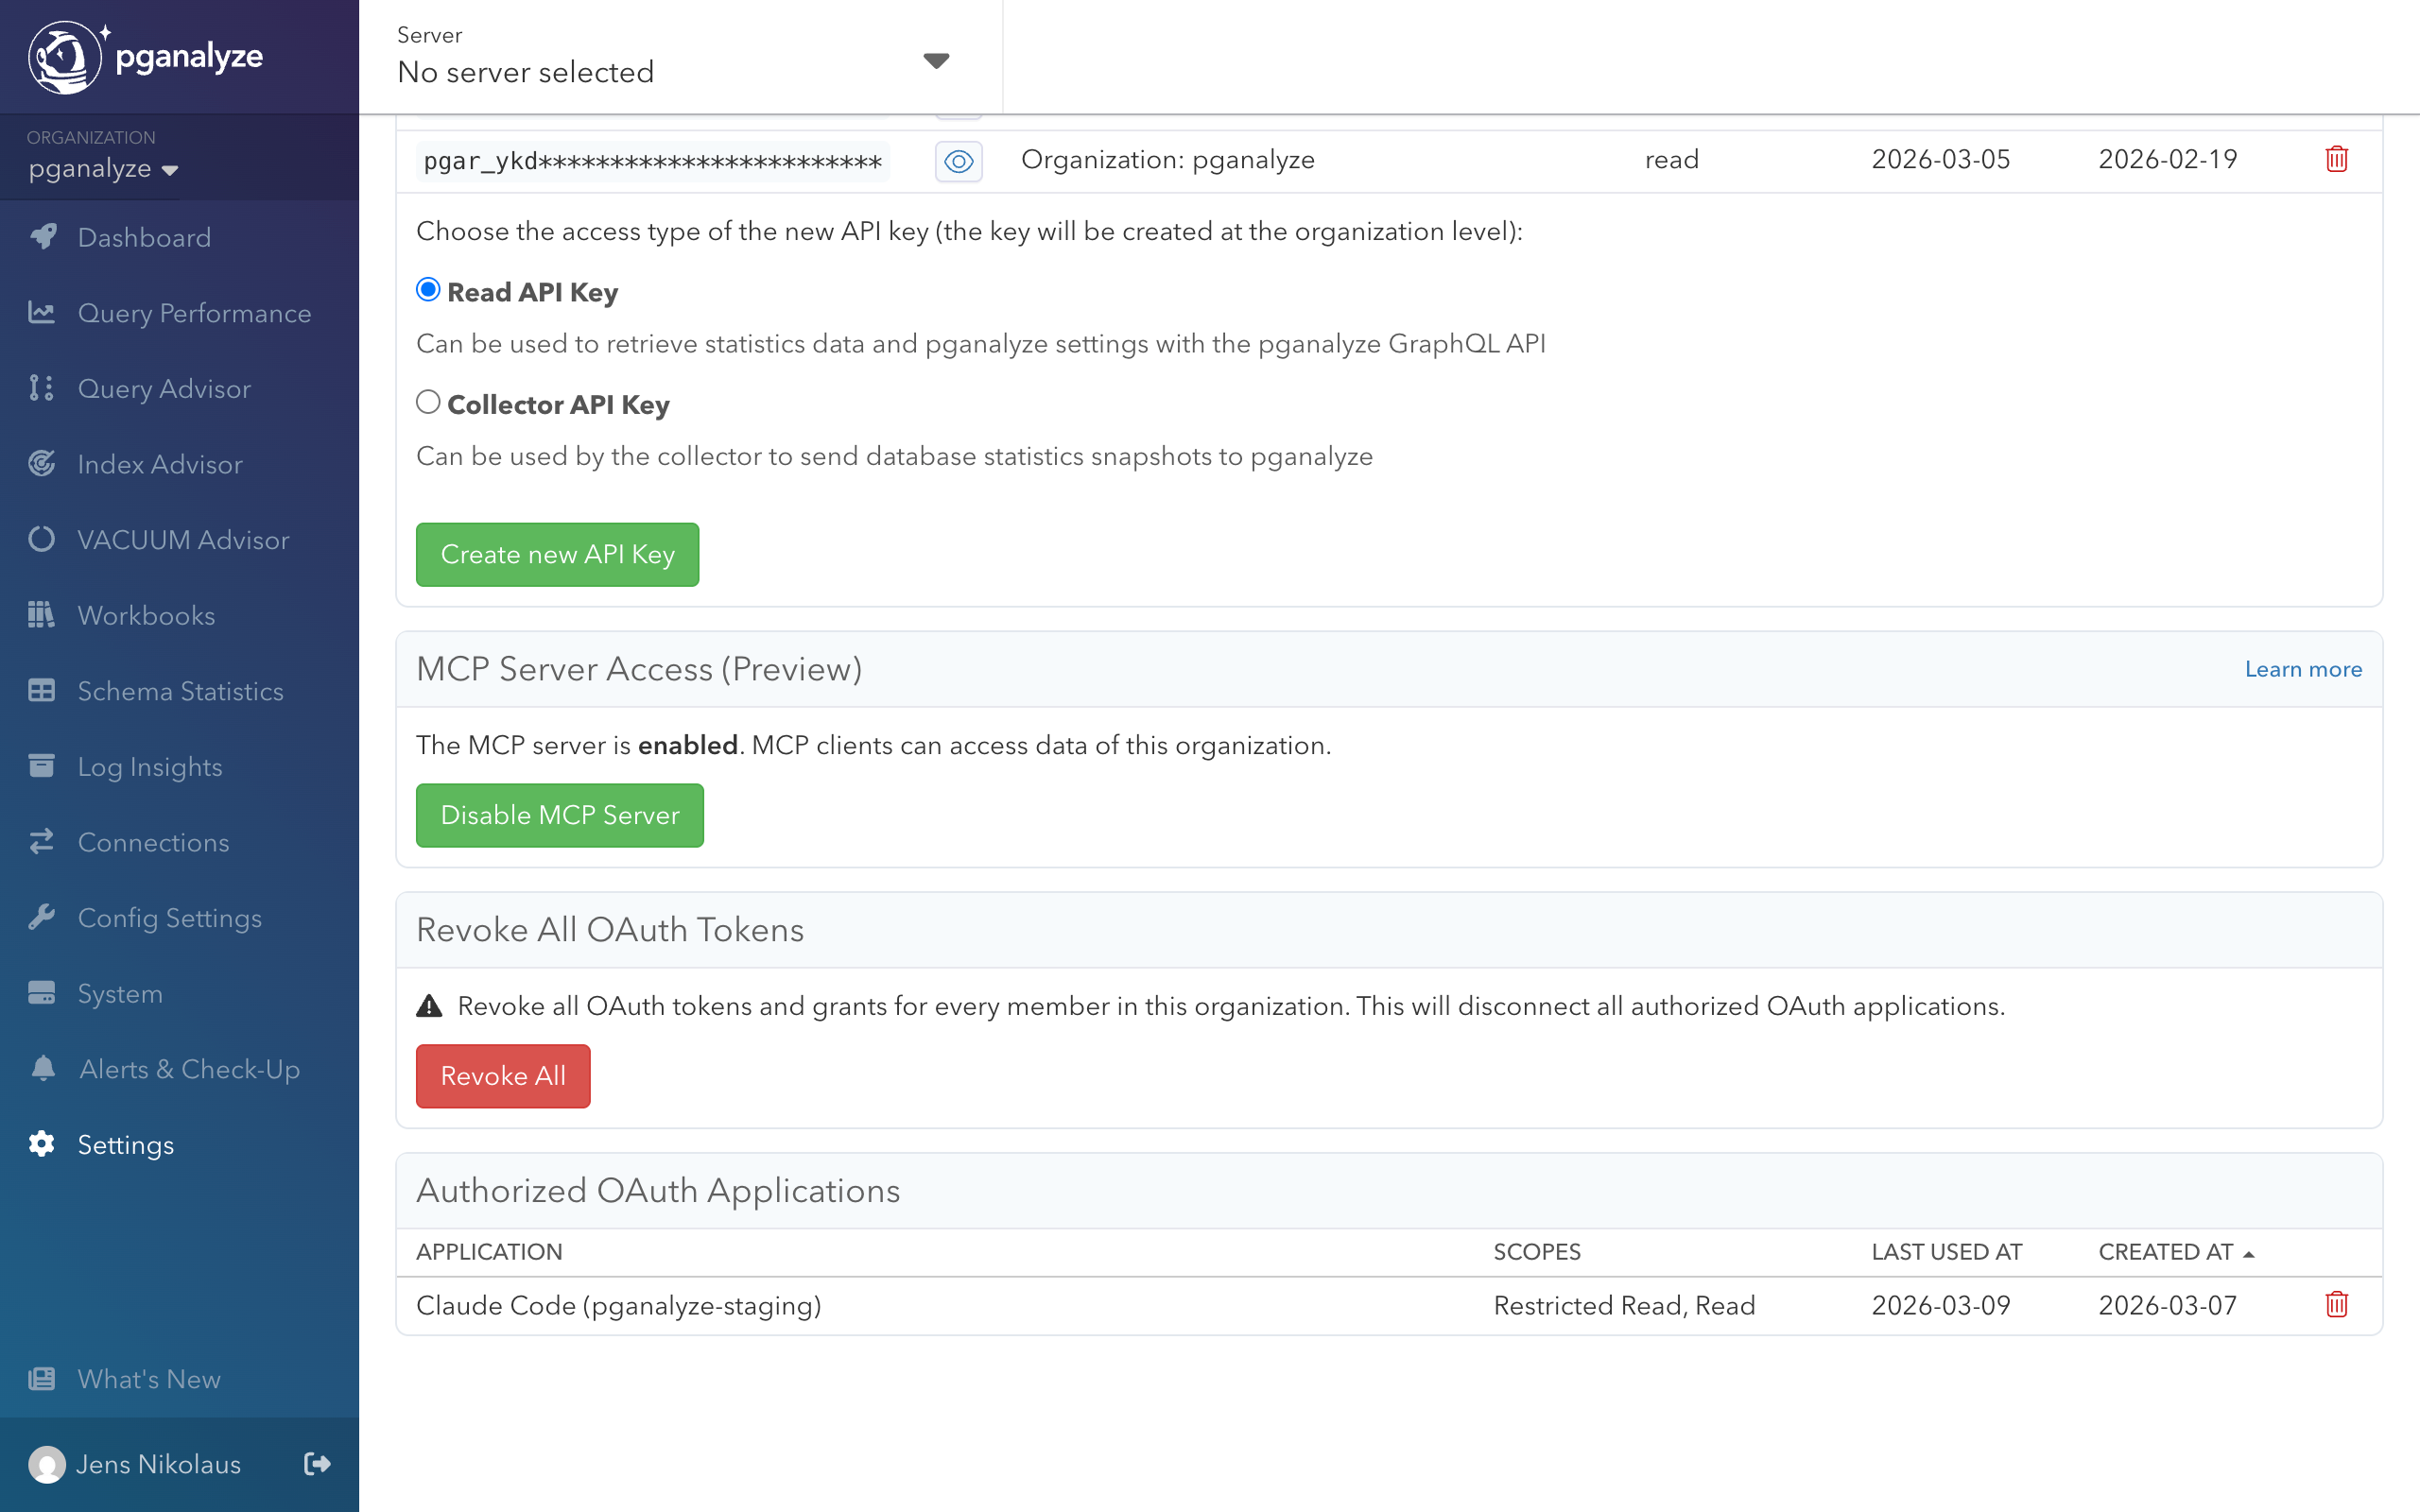
When the MCP server is disabled, MCP clients cannot access any data for the organization.
Setup
Claude Code
Add the pganalyze MCP server using the CLI:
claude mcp add --transport http pganalyze https://app.pganalyze.com/mcpCodex
Add the pganalyze MCP server using the CLI:
codex mcp add pganalyze --url https://app.pganalyze.com/mcpCursor
In Cursor settings, add a new MCP server with the following configuration:
{
  "mcpServers": {
    "pganalyze": {
      "url": "https://app.pganalyze.com/mcp"
    }
  }
}
Other MCP clients
MCP clients that support HTTP transport can connect to the pganalyze MCP server at https://app.pganalyze.com/mcp. Refer to your client’s documentation for how to configure HTTP-based MCP servers.
If you’re using an MCP client hosted on the web (instead of running locally) the OAuth redirect URI may not be permitted and you will get an authentication error during OAuth Dynamic Client Registration (DCR). Reach out to pganalyze support to verify the permitted redirect URIs.
Authentication
The MCP server supports two authentication methods: OAuth (interactive) and API key (non-interactive).
OAuth (recommended)
When you first connect, your MCP client will open an OAuth authorization flow through your pganalyze account. During authorization, you can choose between the following permission levels:
- Basic read access (
restricted_read, required): Read access to some of your account data, excluding sensitive information such as query parameters. EXPLAIN plans are available when the pganalyze collector’s PII filtering is configured to normalize query samples. Individual log lines are available when PII filtering is configured to filter all log secrets. - Full read access (
read, optional): Full read access to your account data, including query text and EXPLAIN plans. - Workbook write access (
write_workbooks, optional, early access): Write access to workbooks in your account: create, edit, and delete workbooks along with their variants and parameter sets, and runEXPLAIN ANALYZEon your databases through the collector. It depends on Full read access, so granting it grants Full read access as well. This permission only appears once pganalyze has enabled the Workbooks tools for your organization.
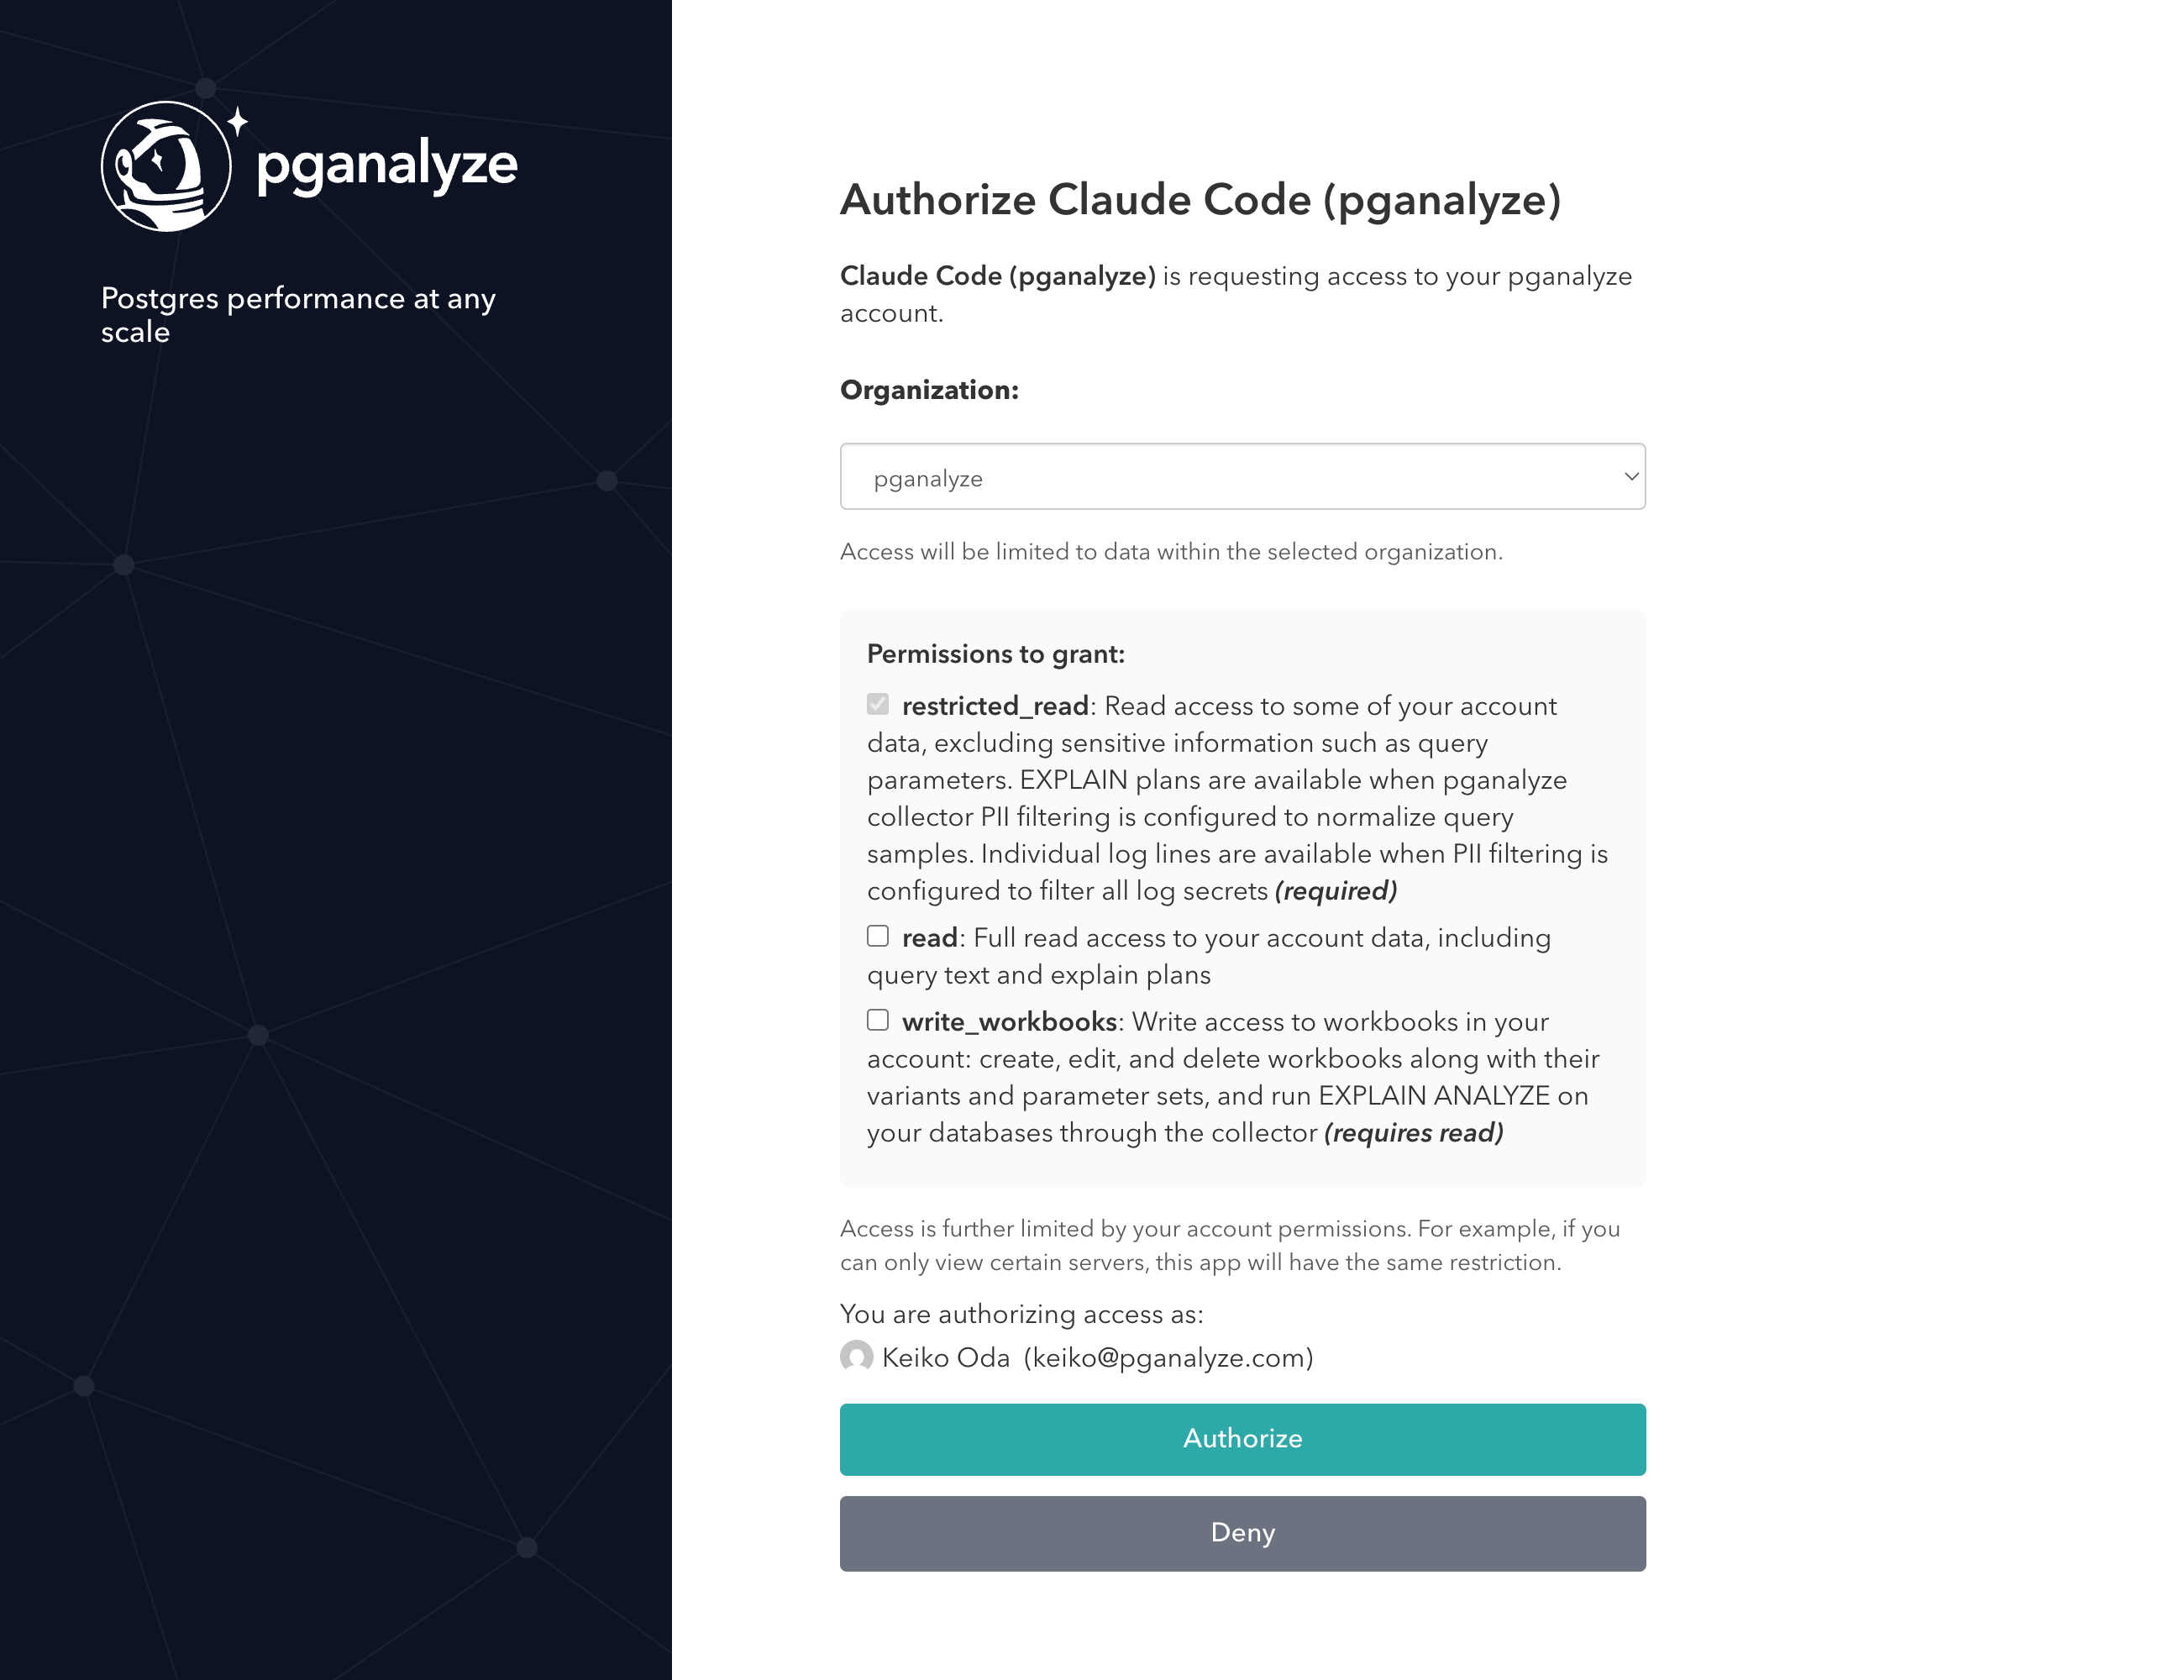
Access is further limited by your account permissions. For example, if you can only view certain servers, the MCP server will have the same restriction.
API key
As an alternative to OAuth, you can authenticate using a pganalyze read API key. This gives full read access to your account data, equivalent to granting the “Full read access” OAuth permission. It does not grant write access: the Workbooks tools are only available through OAuth with workbook write access.
To use API key authentication, first create an API key, then configure your MCP client to pass the key as a Bearer token in the Authorization header. For example, with Claude Code:
claude mcp add --transport http \
  pganalyze https://app.pganalyze.com/mcp \
  -H "Authorization: Bearer YOUR_API_KEY"
The exact configuration for other MCP clients depends on how they support custom headers. Refer to your client’s documentation for details.
Since API key authentication does not require interactive authorization, it is suited for scenarios where OAuth is impractical, for example, automated background agents, CI/CD pipelines, or other programmatic integrations that run without user interaction.
Rate limiting
During the preview, the MCP server is limited to 100 requests per billable server per hour per organization, regardless of authentication method. If you exceed this limit, requests will be rejected until the quota gradually refills over time. This limit may be adjusted as we learn more about common use cases and usage patterns.
Available tools
The MCP server exposes tools, organized by the type of data they access. Since this feature is in preview, the available tools and their parameters may change.
| Tool | Description |
|---|---|
| Servers | |
list_servers | List monitored PostgreSQL servers |
get_server_details | Get details for a specific server |
get_postgres_settings | Get PostgreSQL configuration settings |
| Databases | |
get_databases | List databases with size stats and issue counts |
| Queries | |
get_query_stats | Get top queries by runtime percentage |
get_query_details | Get full normalized query text |
| Tables | |
get_tables | List tables with filtering and pagination |
get_table | Get detailed information about a single table: schema details, columns (with per-column stats), indexes, and constraints |
get_table_stats | Get time-series table statistics |
get_index_selection | Get Index Advisor results for an existing run |
run_index_selection | Run the Index Advisor for a table |
| EXPLAIN Plans | |
get_query_explains | List EXPLAIN plans for a query (last 7 days) |
get_query_explain | Get a specific EXPLAIN plan with full output |
get_query_explain_from_trace | Resolve a trace span to an EXPLAIN plan (requires OpenTelemetry integration) |
| Backends | |
get_backend_counts | Get time-series connection counts by state |
get_backends | Get a point-in-time snapshot of active connections |
get_backend_details | Get details for a specific connection |
| Issues | |
get_issues | Get active check-up issues and alerts |
get_checkup_status | Get check-up status overview for a database |
| Logs | |
get_log_stats | Get time-series counts of collected log lines by classification |
get_log_lines | Get individual log lines, newest first, with optional filters (last 7 days retained) |
| Workbooks (setup required) | |
create_workbook | Create a workbook from a query and run EXPLAIN ANALYZE |
create_workbook_variant | Create a variant (rewrite and/or planner settings) and run EXPLAIN ANALYZE |
create_workbook_parameter_set | Create a parameter set and run EXPLAIN ANALYZE |
update_workbook | Update a workbook’s name and/or description (e.g. an outcome note) |
get_workbook_details | Get a workbook overview |
sync_workbook | Sync/poll fresh EXPLAIN results for all variants |
get_insight_rewrite | Generate a query rewrite from a Query Advisor insight |
delete_workbook_item | Delete a workbook, a variant, or a parameter set |
When get_index_selection or run_index_selection is called against the
primary of a cluster, the response reflects the cluster-aware Index
Advisor view: scan data aggregated across the cluster server group, and each
affected query labeled with its source server and database. This requires
cluster-level access.
Optimizing queries with Workbooks
The tools above read data that pganalyze has already collected: existing metrics, stored query samples, and previously captured EXPLAIN plans. The Workbooks tools go a step further. They let an AI assistant create a workbook for a slow query, run new EXPLAIN ANALYZE executions under controlled parameter sets, and test rewrites or planner settings against a baseline. This is the same workflow available in the pganalyze app, run through your MCP client instead of the web interface.
Because these tools execute queries against your database through the collector rather than only reading stored data, they carry additional requirements and are gated separately from the read-only tools.
Requirements
Using the Workbooks tools requires all of the following:
- OAuth with workbook write access. The Workbooks tools perform writes, so they require OAuth authentication with workbook write access granted (see Authentication). API key authentication is read-only and cannot use them.
- The Create Workbooks permission. Your pganalyze account must have the Create Workbooks permission, the same permission required to create workbooks in the app. Without it, the tools return an authorization error.
- The collector workflow. Running
EXPLAIN ANALYZErelies on the Workbooks collector workflow being set up for the database: thepganalyze.explain_analyzehelper function, and a connected collector on version 0.64.0 or later. - Early access enablement. The Workbooks tools are not enabled by default, even when the rest of the MCP server is. Contact pganalyze support to enable them for your organization. Until then, the tools do not appear when your MCP client lists the available tools.
How the tools fit together
A typical optimization loop uses the tools in sequence:
create_workbookcreates a workbook from the slow query and runsEXPLAIN ANALYZEon it. The query can be a normalized query or use literal values, with parameters written as literals or$1-style placeholders. Parameter values are derived automatically from inline literals or recent query samples where possible; when they cannot be, you supply them withadd_workbook_parameter_set.- Once parameter values are set,
EXPLAIN ANALYZEruns through the collector. A run can take longer than a single request, soget_workbook_detailsretrieves the results once they are ready. - To test an optimization,
get_insight_rewriteturns a Query Advisor insight on the baseline plan into a candidate rewrite, andcreate_workbook_variantadds a rewrite or planner-setting variant and runsEXPLAIN ANALYZEon it, so you can compare its plan against the baseline.
When parameter values cannot be derived automatically, the assistant asks you for them rather than filling them in on its own. It may suggest realistic values grounded in the query, schema, or samples, but you confirm the final values, since those values determine which plan Postgres produces and therefore what the comparison measures.
Example use cases
- Investigate slow queries during development: Ask your AI tool to pull the top queries by runtime for a specific database using
get_query_stats, then inspect EXPLAIN plans for a query that regressed usingget_query_explainsandget_query_explain. - Review active issues: Check the current check-up status for a database using
get_checkup_statusto see if there are unresolved alerts, such as insufficient VACUUM frequency or unused indexes. - Trace a slow request to its query plan: If your application uses OpenTelemetry tracing, resolve a trace span to the corresponding EXPLAIN plan using
get_query_explain_from_traceto understand why a specific request was slow. - Audit cluster-wide index opportunities: For a cluster with several replicas, ask your AI tool to run
run_index_selectionagainst the primary so it can see workload aggregated from every replica, then review which databases on which servers contributed the most scans. - Test a query rewrite before shipping it (requires the Workbooks tools): Have your AI tool create a workbook for a slow query with
create_workbook, supply representative parameter values, then compare a rewrite or planner-setting change against the baseline withcreate_workbook_variant. Because this runs realEXPLAIN ANALYZEexecutions through the collector, you can confirm the actual runtime effect rather than relying on the planner’s cost estimate.
Couldn't find what you were looking for or want to talk about something specific?
Start a conversation with us →