


Integrating pganalyze with Honeycomb
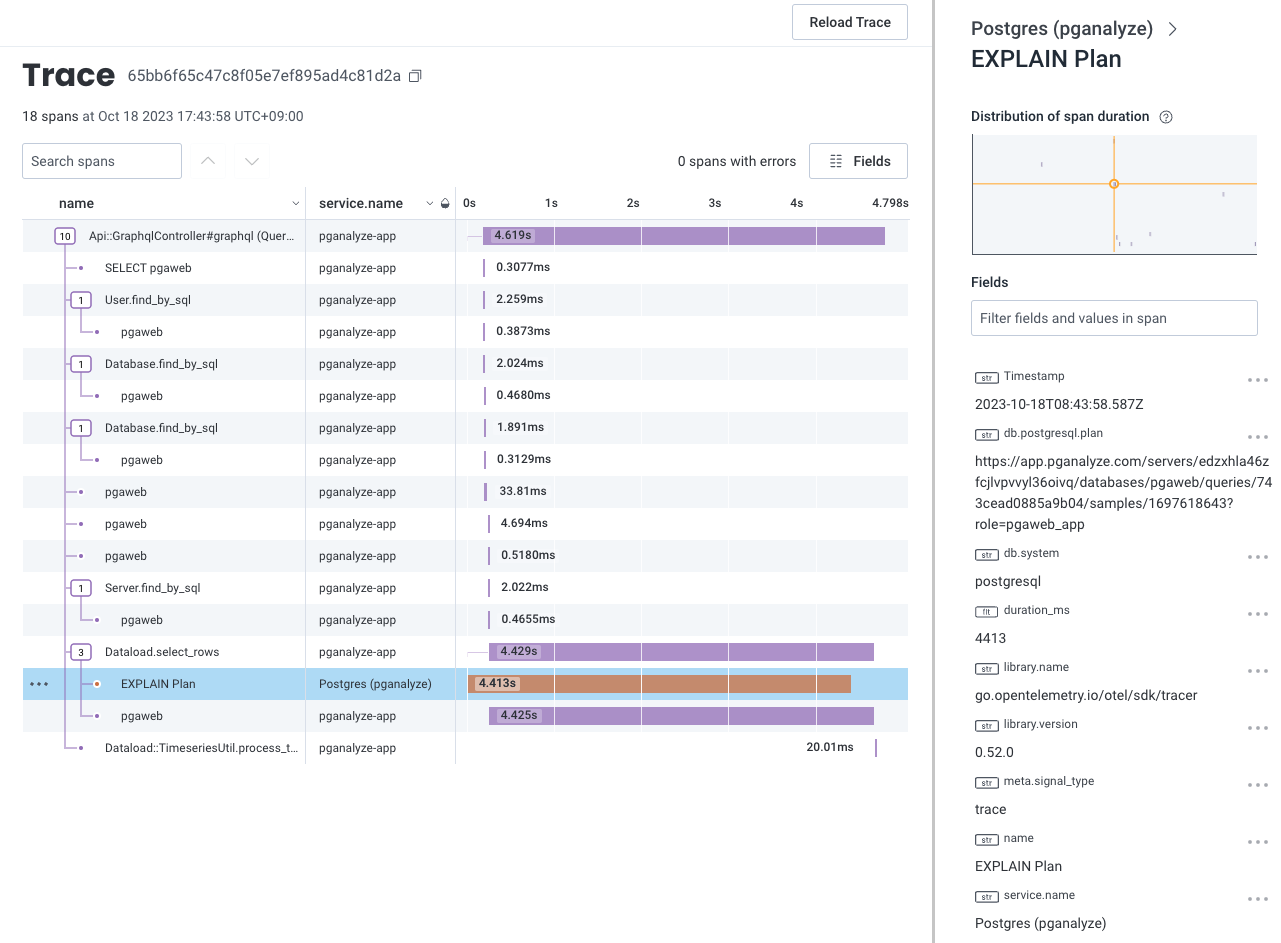
You can set up the pganalyze collector OpenTelemetry exporter with Honeycomb to capture spans for query EXPLAIN plans inside your traces. The span contains the link to the EXPLAIN plan in the pganalyze app, so that you can easily visit the pganalyze page to find out why the query is slow.
As Honeycomb aligns with and recommends the use of OpenTelemetry, the setup is straightforward. To send EXPLAIN plan spans to Honeycomb:
- Start sending tracing data from your application to Honeycomb
- Add traceparent query tag to the query (see Set up traceparent query tag within your application section for details)
- Create a Honeycomb API key
- Set up a Honeycomb API key and an endpoint in the pganalyze collector
If you have already started sending tracing data from your application to Honeycomb and you are fine using the existing API key for the pganalyze collector, you can skip step 3 and use that key. If you prefer to create a new API key rather than use the environment’s existing one, create an ingest key for this purpose.
Once you obtain an API key, update the following collector settings to start sending out tracing spans to Honeycomb:
otel_exporter_otlp_endpoint(OTEL_EXPORTER_OTLP_ENDPOINT):https://api.honeycomb.io
otel_exporter_otlp_headers(OTEL_EXPORTER_OTLP_HEADERS):x-honeycomb-team=<API key from step 3>
Optionally, you can also set otel_service_name (OTEL_SERVICE_NAME) to update
the service name reported to Honeycomb from the pganalyze collector. It defaults
to Postgres (pganalyze).
Make sure to restart the collector after updating the settings.
Couldn't find what you were looking for or want to talk about something specific?
Start a conversation with us →