
The pganalyze EXPLAIN grid view
The pganalyze EXPLAIN grid view is an alternate way to inspect query plans. It’s more compact, and modeled after the native Postgres text EXPLAIN format, but includes some quality of life improvements.
Note that this view is a work in progress, and may not include all the plan information you’re interested in yet. In that case, check the Node Tree EXPLAIN view or the source of individual nodes (and please contact us with feedback).
Plan layout
The query plan is displayed in a way similar to the Postgres text EXPLAIN format, but with some important differences:
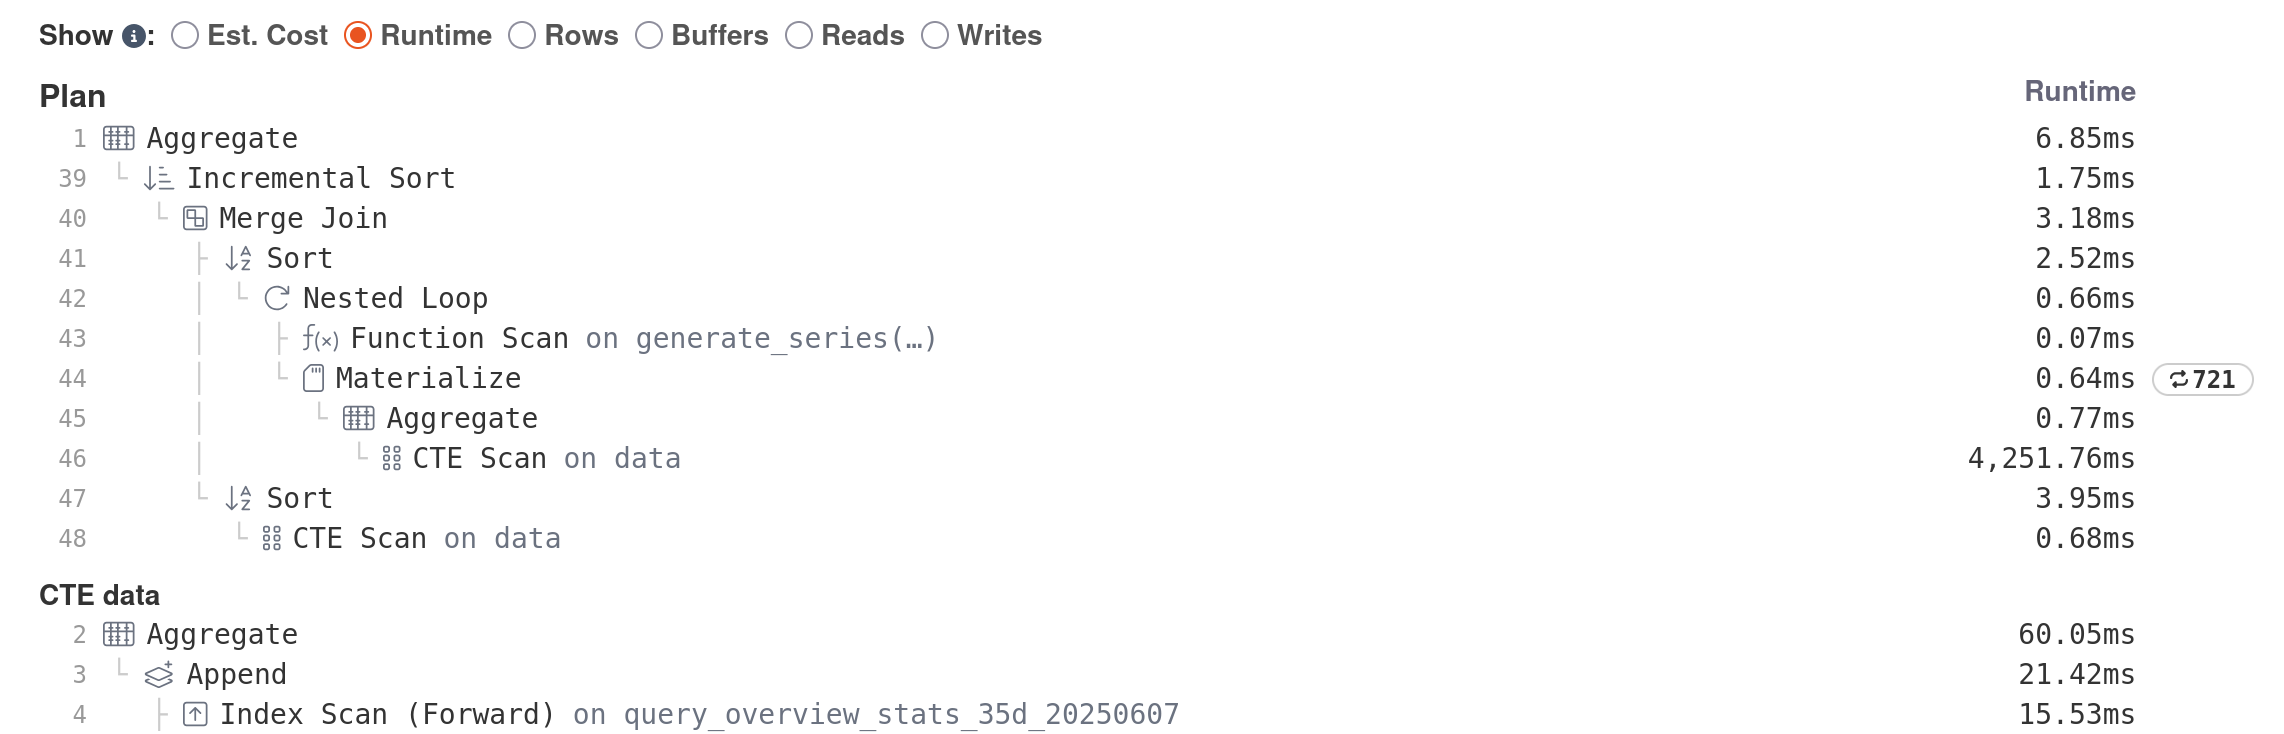
- Common Table Expressions (WITH clause entries) and any other independent subqueries are broken out into their own section.
- The focus is on the shape of the plan and node details are available only after clicking to select a specific node.
- Scan details include the table being scanned, the index used (if any), and the alias used for this table reference in the query (if any).
Metrics
The execution metric to show can be selected at the top of the plan:
- Est. Cost: The cost of the node according to the Postgres planning model, excluding the cost of the node’s children.
- Runtime: How much time was spent executing this node, excluding time spent executing the node’s children.
- Rows: How many rows each node produced, and how many it was expected to produce according to the query plan.
- Buffers: How many buffers were hit in the buffer cache and read from disk (these are combined) or dirtied while executing this query, excluding buffers touched while executing the node’s children.
- Reads: How much data was read from disk (or the OS page cache) and how much time was spent reading it.
- Writes: How much data was written to disk and how much time was spent writing it.
Learn more about these in our plan comparison documentation. Note that not all execution metrics may be available, depending on your Postgres settings.
Loops
Sometimes, a plan node is executed repeatedly, usually due to a nested loop join above it. These nodes are flagged with a repeat icon. Note that a whole subtree may loop. When a node is looped, metrics are reported as a total over all loops.
Parallelism
If parallelism is involved, metrics other than Runtime are summed over all workers. Runtime is represented as the Runtime of the slowest worker (this is generally a more useful metric).
Buffers
Note that Buffers are counted per-access, not uniquely, so they may be overcounted when loops are involved. Buffers counts omit temp blocks, which are typically used for sorts and other similar operations that spill to disk.
Reads and Writes
Both these metrics omit temp blocks, which are typically used for sorts and other similar operations that spill to disk. Temp tables and other temporary objects are still counted (they use local blocks).
Couldn't find what you were looking for or want to talk about something specific?
Start a conversation with us →