Collector times out
If you find the collector timing out or hanging, either periodically or
constantly, or even within the test run, the most likely cause is
pg_stat_statements statistic data being big and taking long time to query the
statistic from it. This especially happens when there are many queries with long
query texts.
You can check out below points using the following query to identify if ps_stat_statements statistic data is big or not.
- How many queries does
pg_stat_statementsstatistic data currently have - The maximum number of queries
pg_stat_statementskeeps track of (default: 5000) - Total size of tracked queries
SELECT
  count(*),
  current_setting('pg_stat_statements.max'),
  pg_size_pretty(sum(length(query)))
FROM pg_stat_statements;
To mitigate the issue, you can run SELECT pg_stat_statements_reset() to reset
the statistics data. This will not affect the statistics data tracked within
pganalyze, but if you are using other tools that rely on pg_stat_statements
data, you should review how they will be affected. If the collector test run
(pganalyze-collector --test --verbose) is already timing out or hanging, it's
good to try this out and see if it resolves the problem.
If the collector still times out or hangs after this, please contact us so that we can help debug further.
Once you confirm that pg_stat_statements_reset() is a valid mitigation, you can enable a recurring reset executed by pganalyze.
Setting up recurring pg_stat_statements_reset()
First, identify the primary monitored database. This is the value of the db_name collector setting, or the first database in the list, if there are several. Then, you need to create the following helper method:
CREATE OR REPLACE FUNCTION pganalyze.reset_stat_statements() RETURNS SETOF void AS
$$
  /* pganalyze-collector */ SELECT * FROM public.pg_stat_statements_reset();
$$ LANGUAGE sql VOLATILE SECURITY DEFINER;
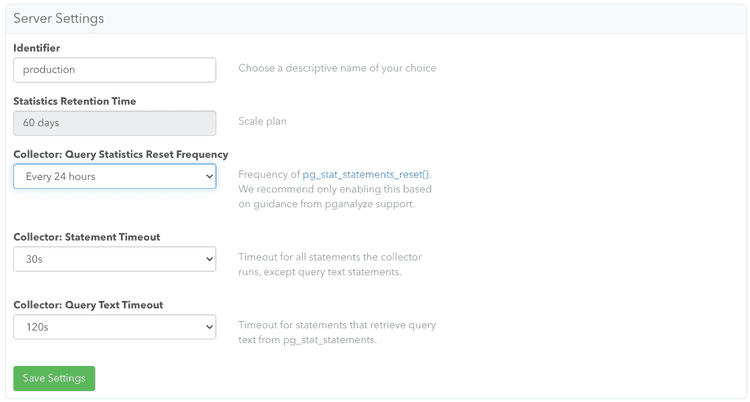
Second, go to the Server Settings panel in Settings page and tune "Collector: Query Statistics Reset Frequency":
Start with a reset frequency of 24 hours to see if that helps the situation. If this helps for a while but the problem eventually happens again, try increasing the frequency. Please feel free to reach out to us to tune it further.
Couldn't find what you were looking for or want to talk about something specific?
Start a conversation with us →
