


From Insight to Conclusion
This guide walks through a complete Query Advisor workflow, from detecting a performance issue to applying the optimization in production. We’ll use a real example of an ORDER BY + LIMIT query that Postgres optimizes poorly due to incorrect index selection.
The performance problem
Query Advisor automatically detected this problematic query pattern in production:
SELECT databases.*
FROM databases
WHERE databases.server_id = $server_id
AND databases.hidden = $hidden
ORDER BY databases.id ASC
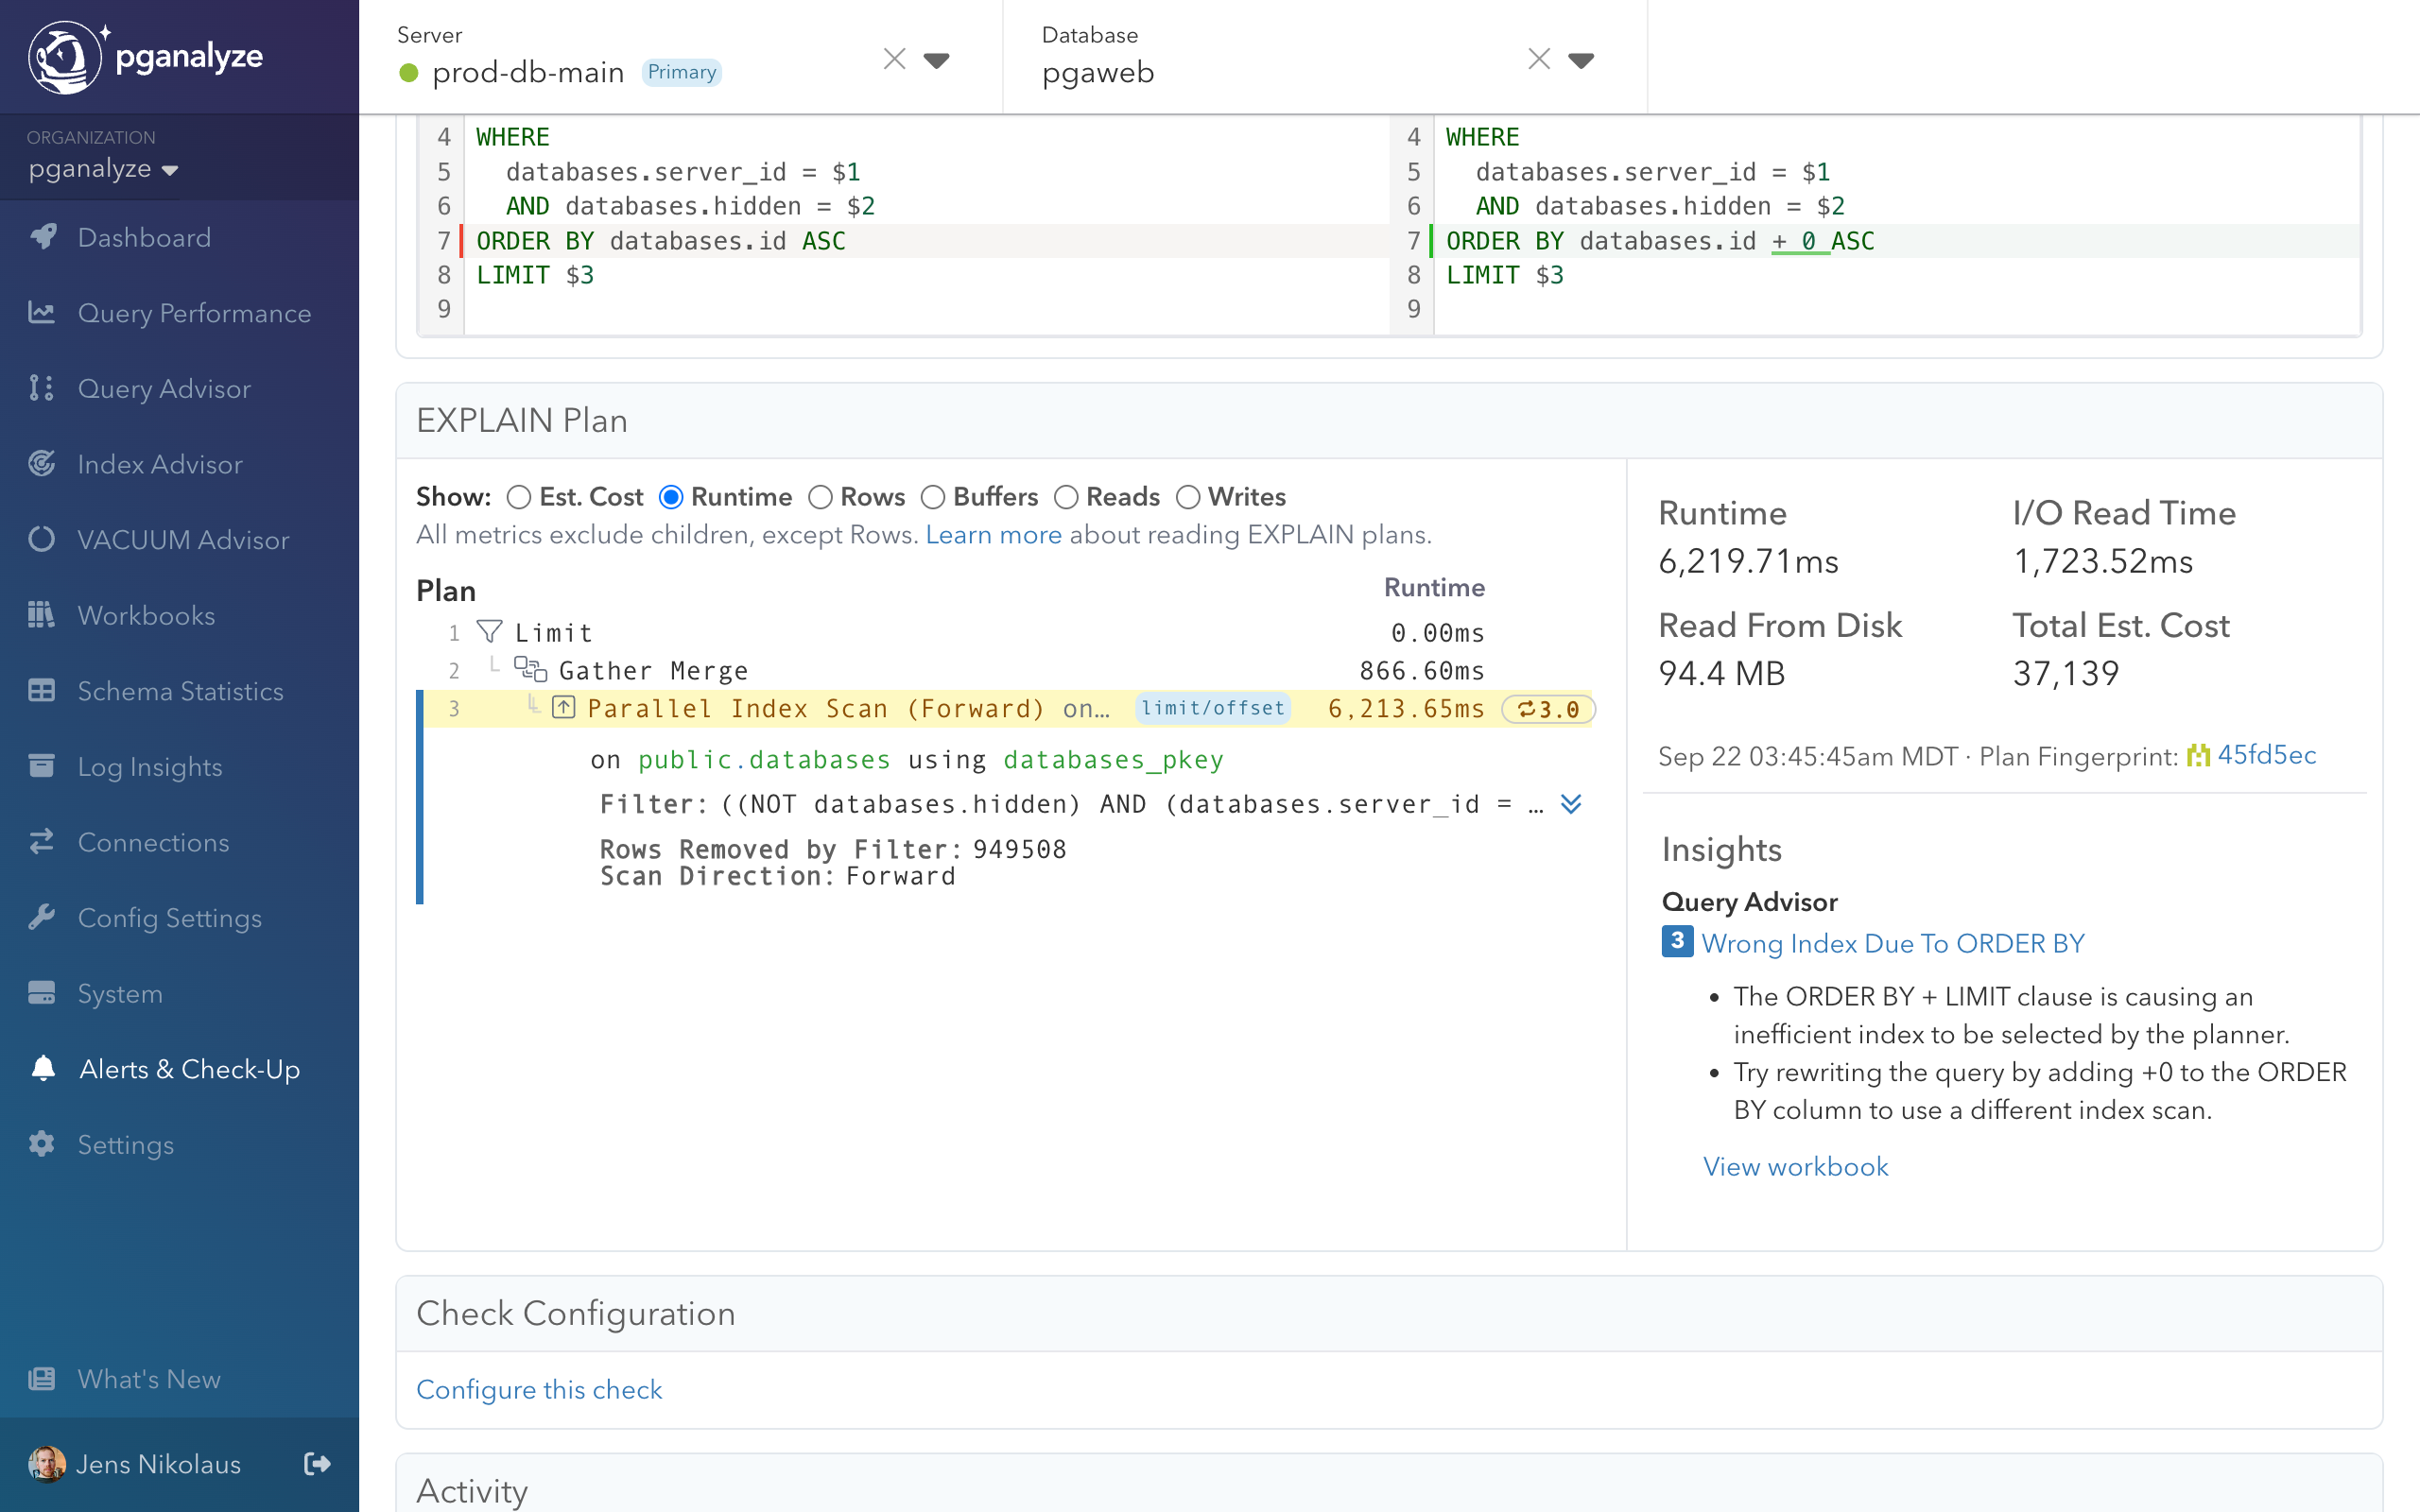
LIMIT ;The query appeared to run fast initially but degraded significantly under certain conditions, taking over 6 seconds to complete. The EXPLAIN plan (shown below) revealed the issue:
- Parallel Index Scan (Forward) on the databases_pkey index for sorting
Filtercondition applied after index scan, with noIndex Condon the index scan itself- 949,508 rows removed by filter showing many rows discarded that were fetched unnecessarily
- 6,219.71ms runtime with 1/4th of it being I/O read time
Postgres chose the wrong optimization strategy - it prioritized the ORDER BY over the WHERE clause filtering.
Step 1: Query Advisor detection
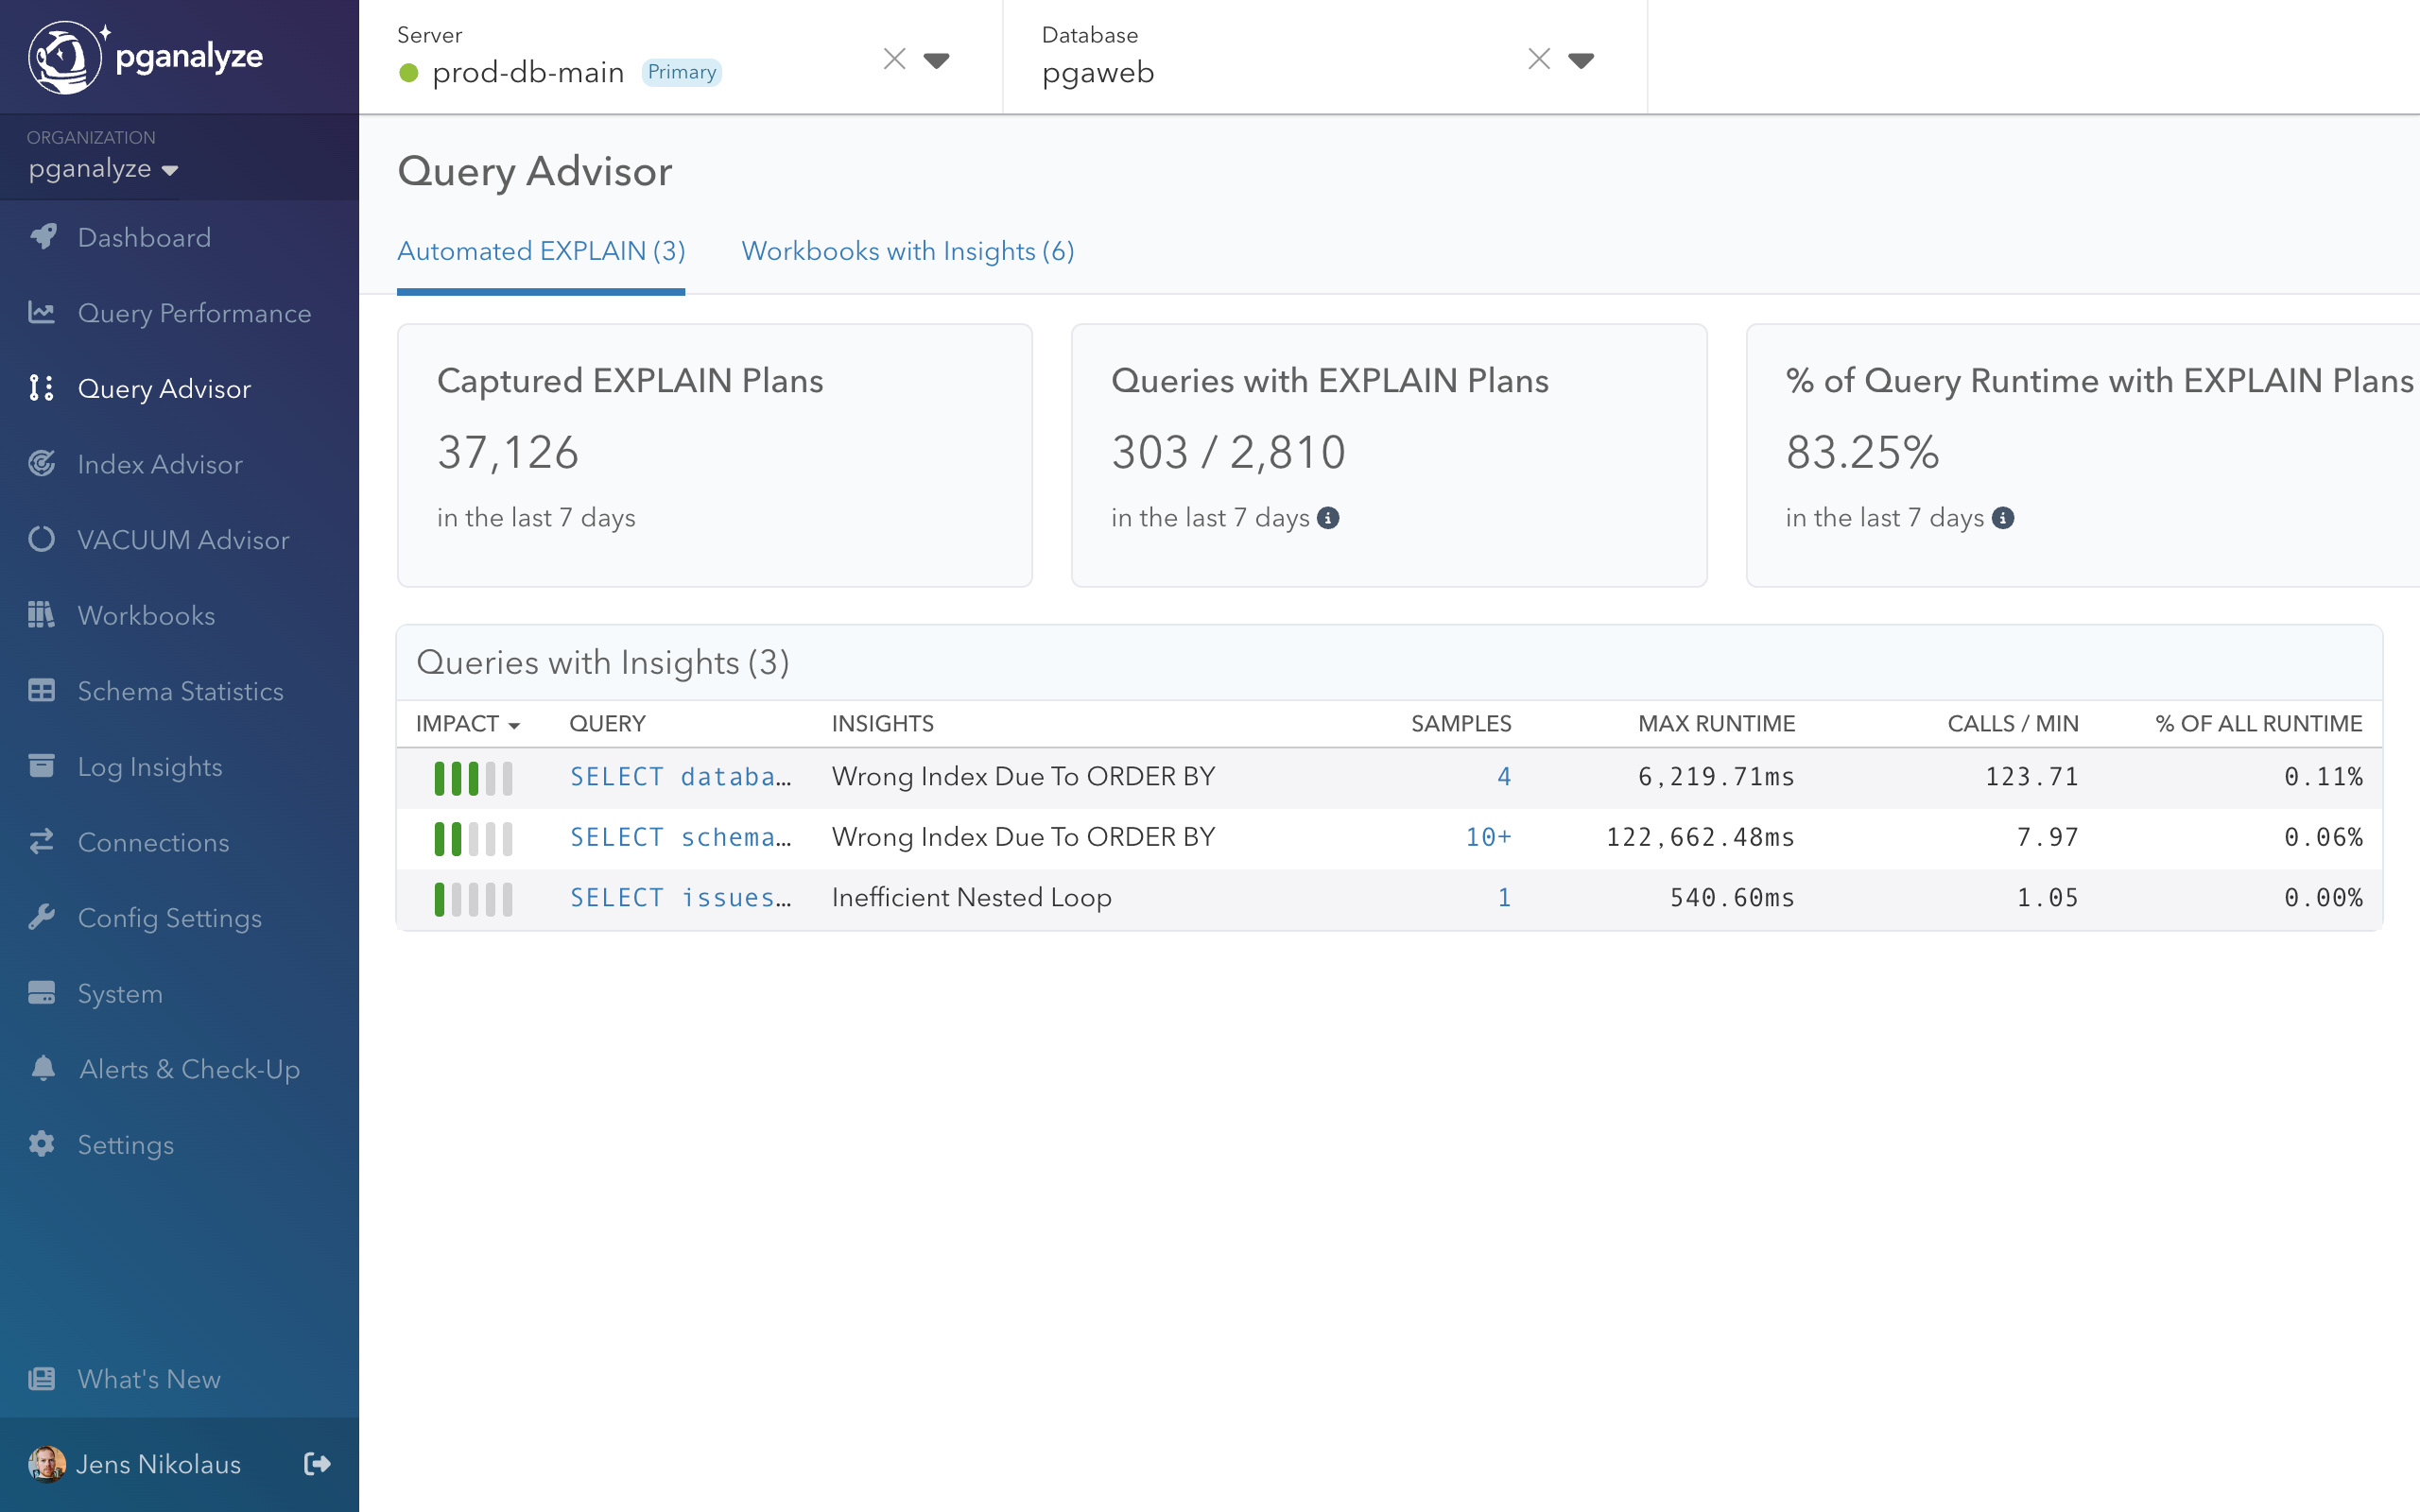
Query Advisor automatically analyzed the EXPLAIN plan and identified the ORDER BY + LIMIT index problem pattern:
Detection criteria
- Index scan with no Index Condition (only Filter)
- High “Rows Removed by Filter” count
- Index benefits sort order but not filtering
- Alternative indexes available for WHERE conditions
The insight appeared on the Query Advisor overview page with sample runtime data and affected query details.
Step 2: Create workbook for testing
From the Query Advisor insight, we clicked “Create Workbook” to begin systematic testing.
Workbooks are automatically set up from the source query, and parameters get names assigned for easy rewriting. To test query performance, we need to choose parameter values.
Choosing parameters
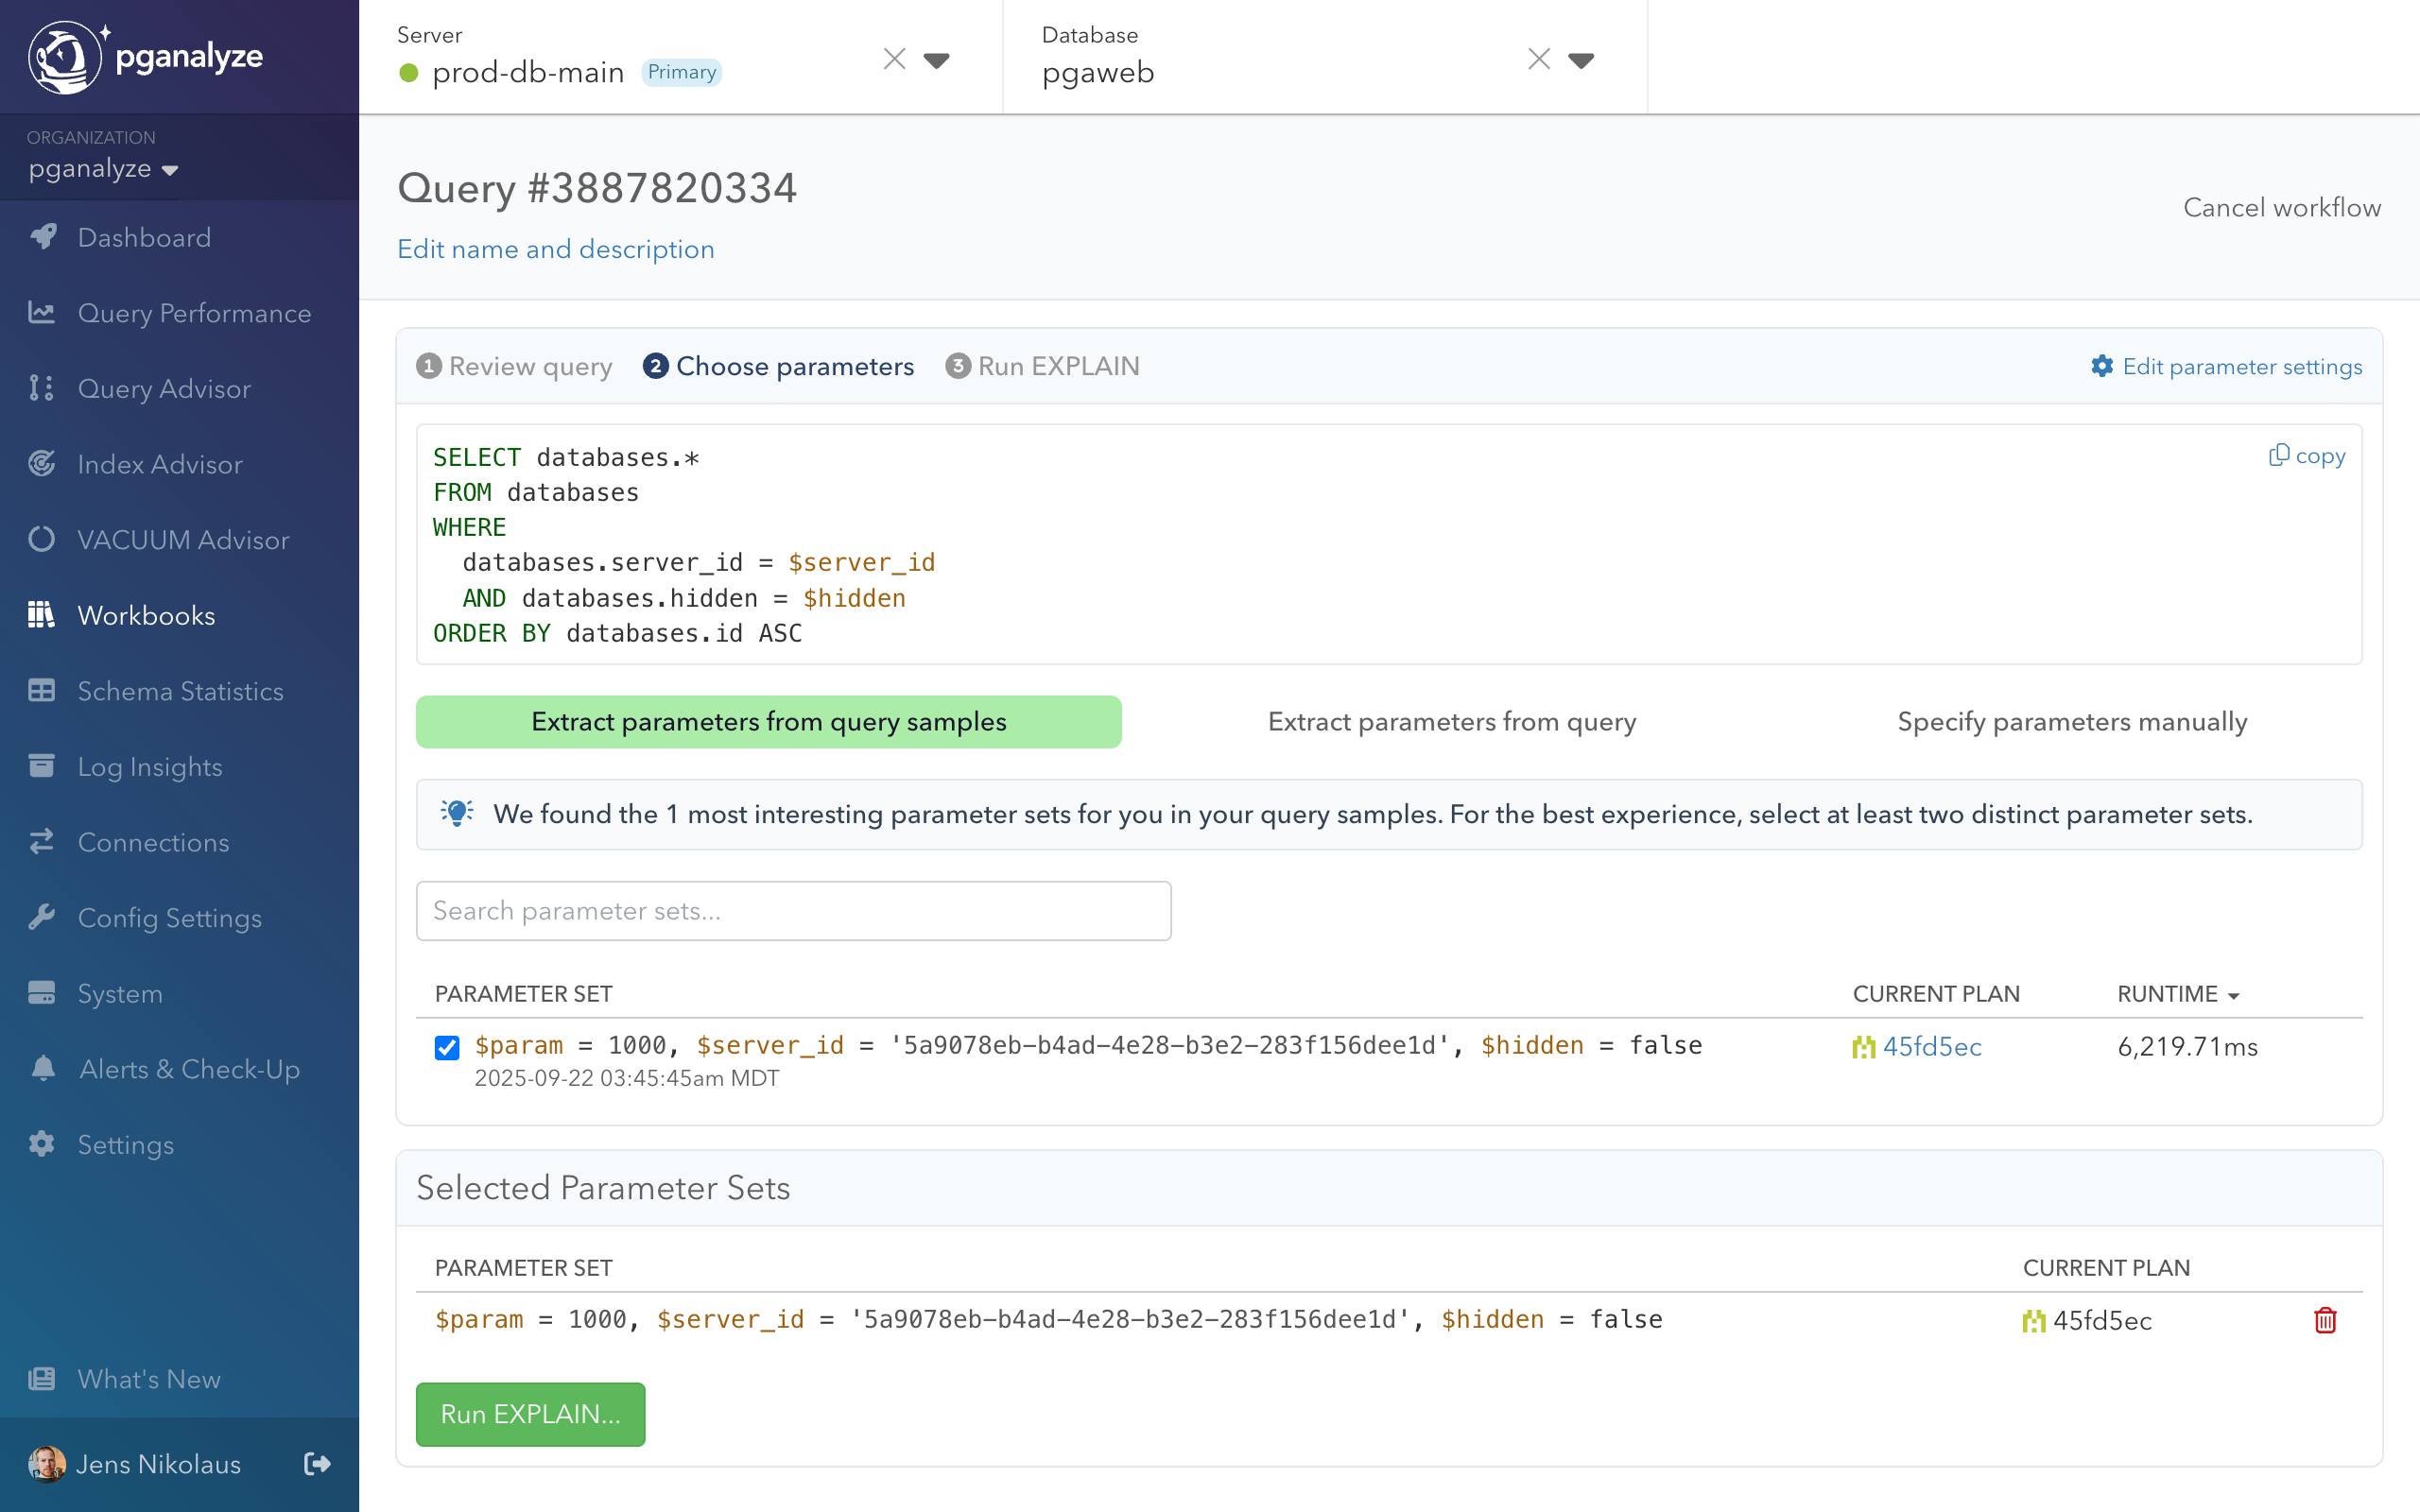
We chose a representative test case to validate the optimization based on the actual query parameters. The shown
Parameter Set 1 has param (LIMIT), server_id and hidden values that correspond with the query plan we saw earlier.
For some queries multiple parameter values will be shown (we recommend choosing 2-3 if possible), or additional parameters can be added manually. To keep it simple we will continue with 1 parameter set in this example.
Testing with real parameter values ensures the optimization reflects actual production conditions.
Step 3: Record baseline performance
Before applying any changes to the query, we record baseline performance using the collector workflow. The baseline supports a like-for-like comparison of rewrites using warm cache runs. Without the baseline, we may see a performance improvement simply because the data used by the query is now in cache.
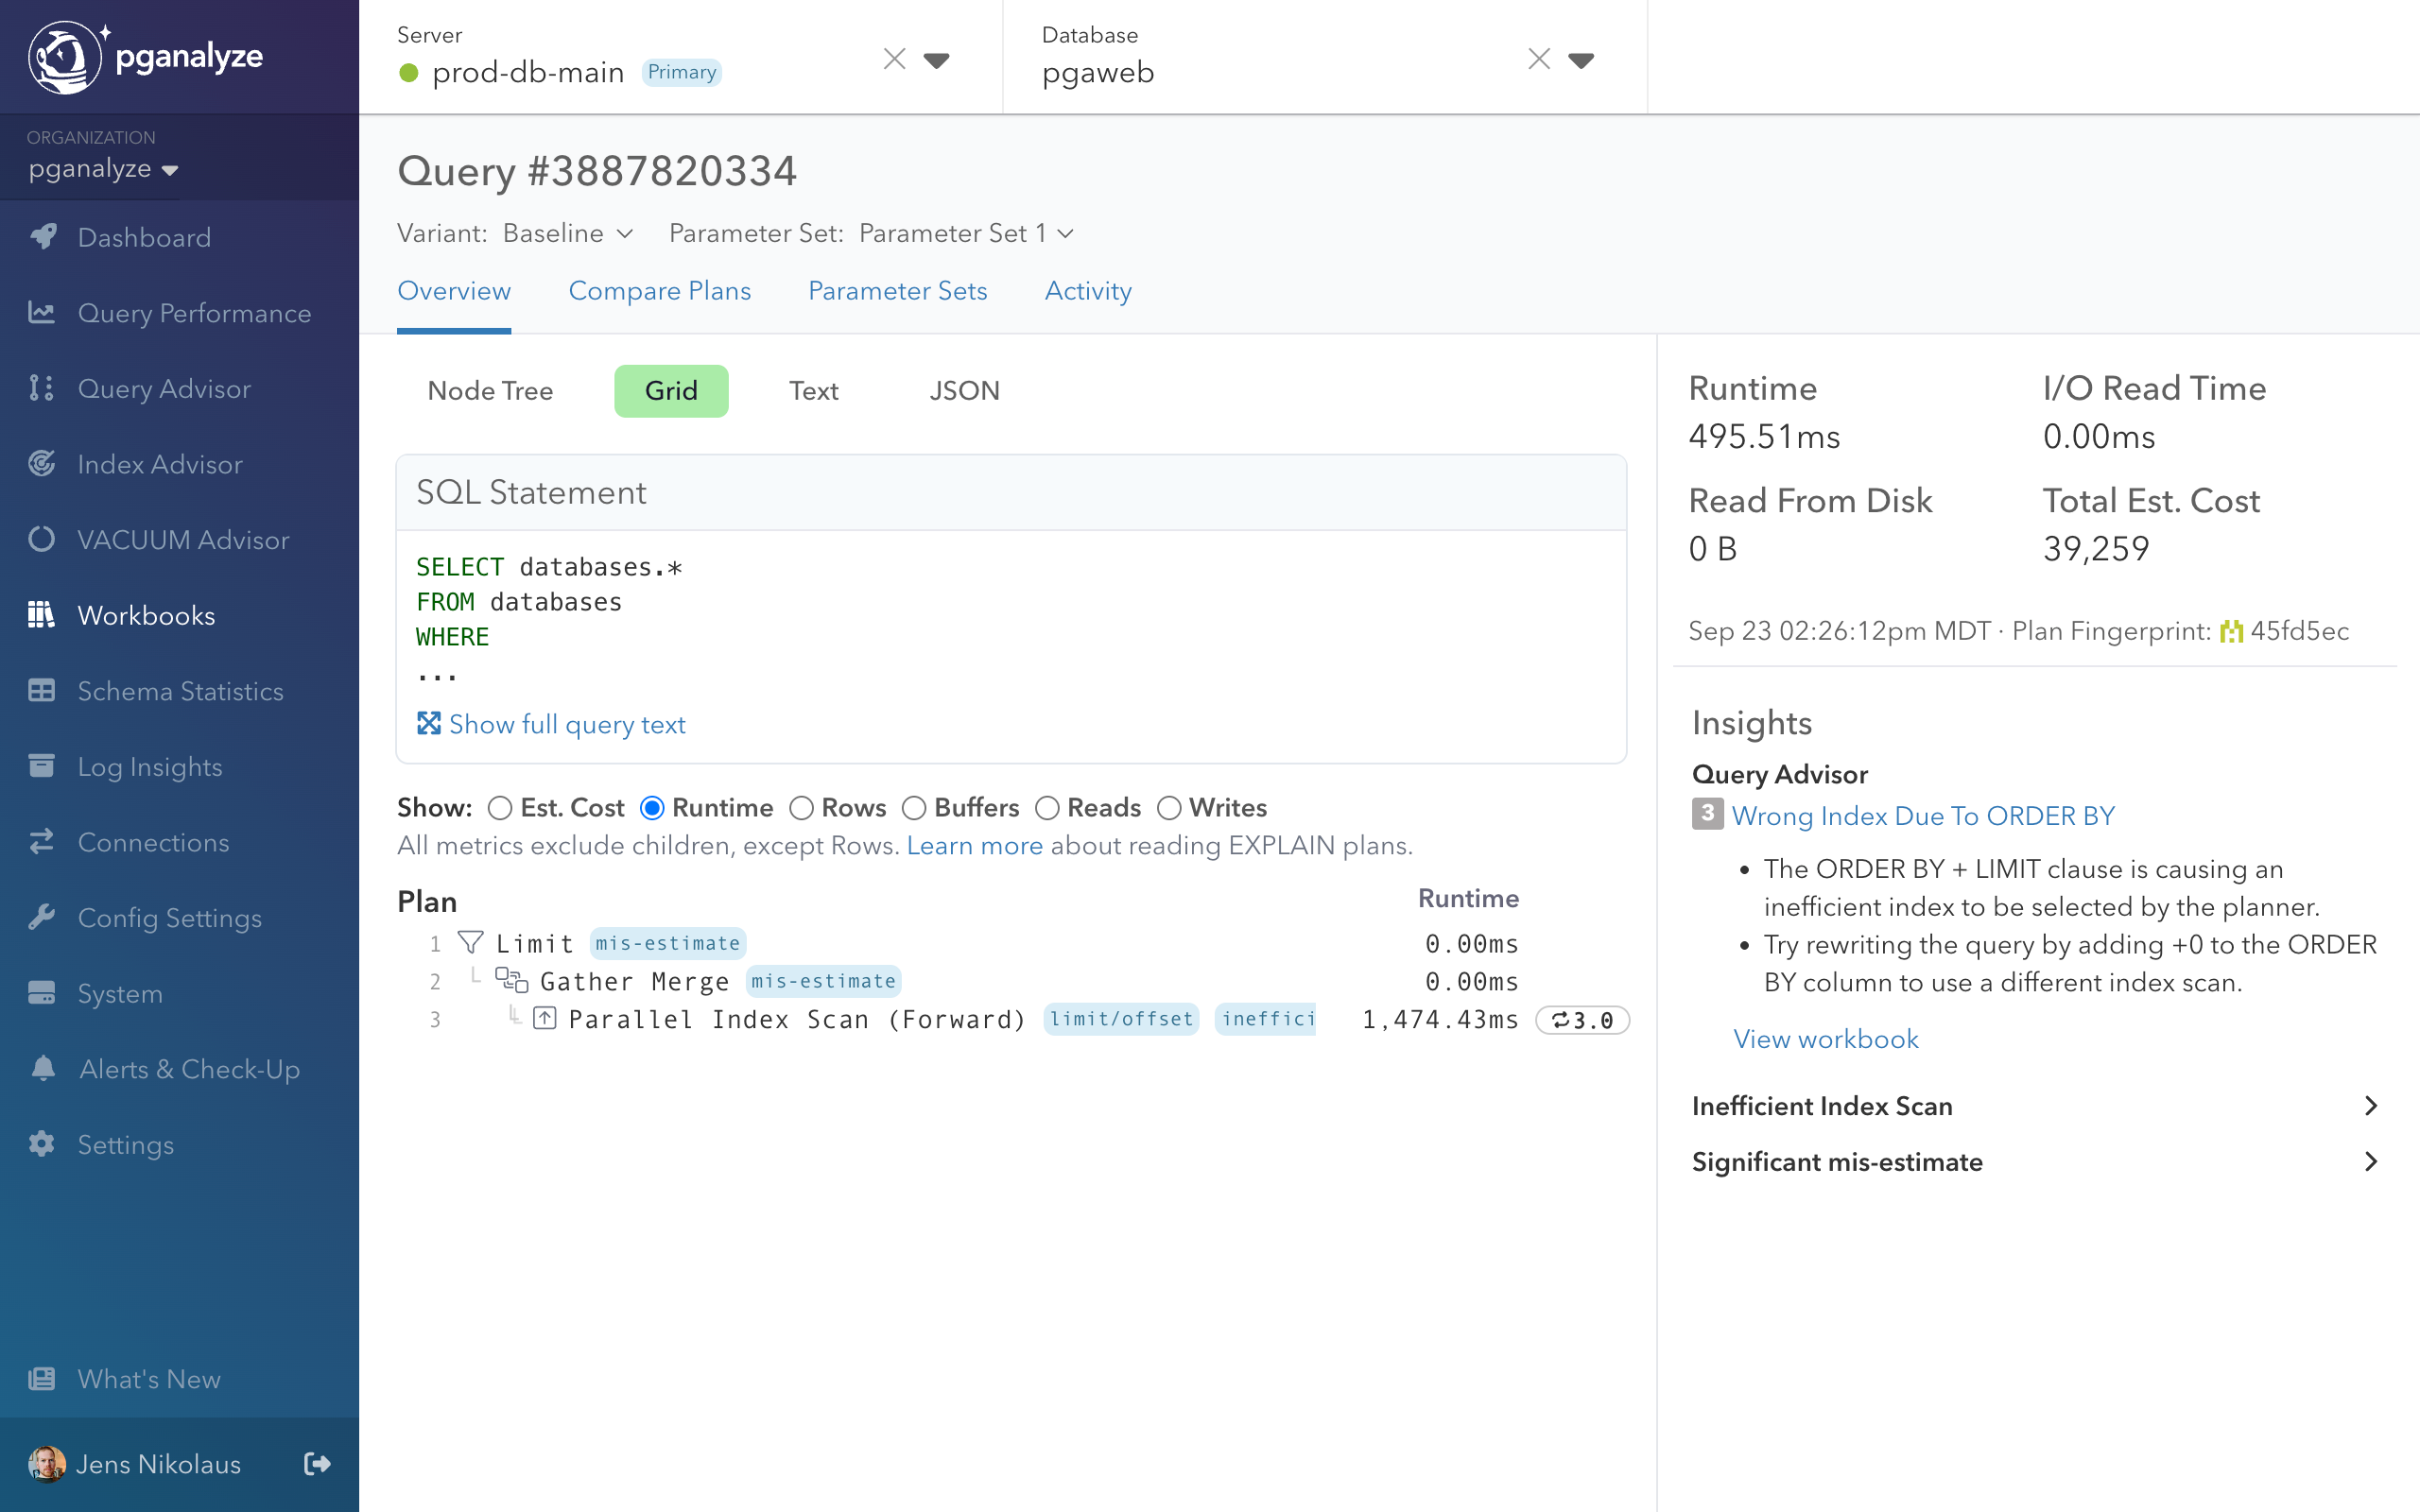
In this example, the query performance changed from 6,219.71ms (original plan sample) to 495.51ms in the baseline. Any rewrites will aim to improve this baseline performance. We can also see based on the I/O Read Time being 0.00ms that this is indeed a warm cache result.
Step 4: Apply Query Advisor insight
We can see that Query Advisor confirms the baseline still has the same query plan problem using the wrong index. We now create a variant to rewrite the query into a more efficient form.
In the workbook variant editor, Query Advisor provided an “Apply” button for the detected insight:
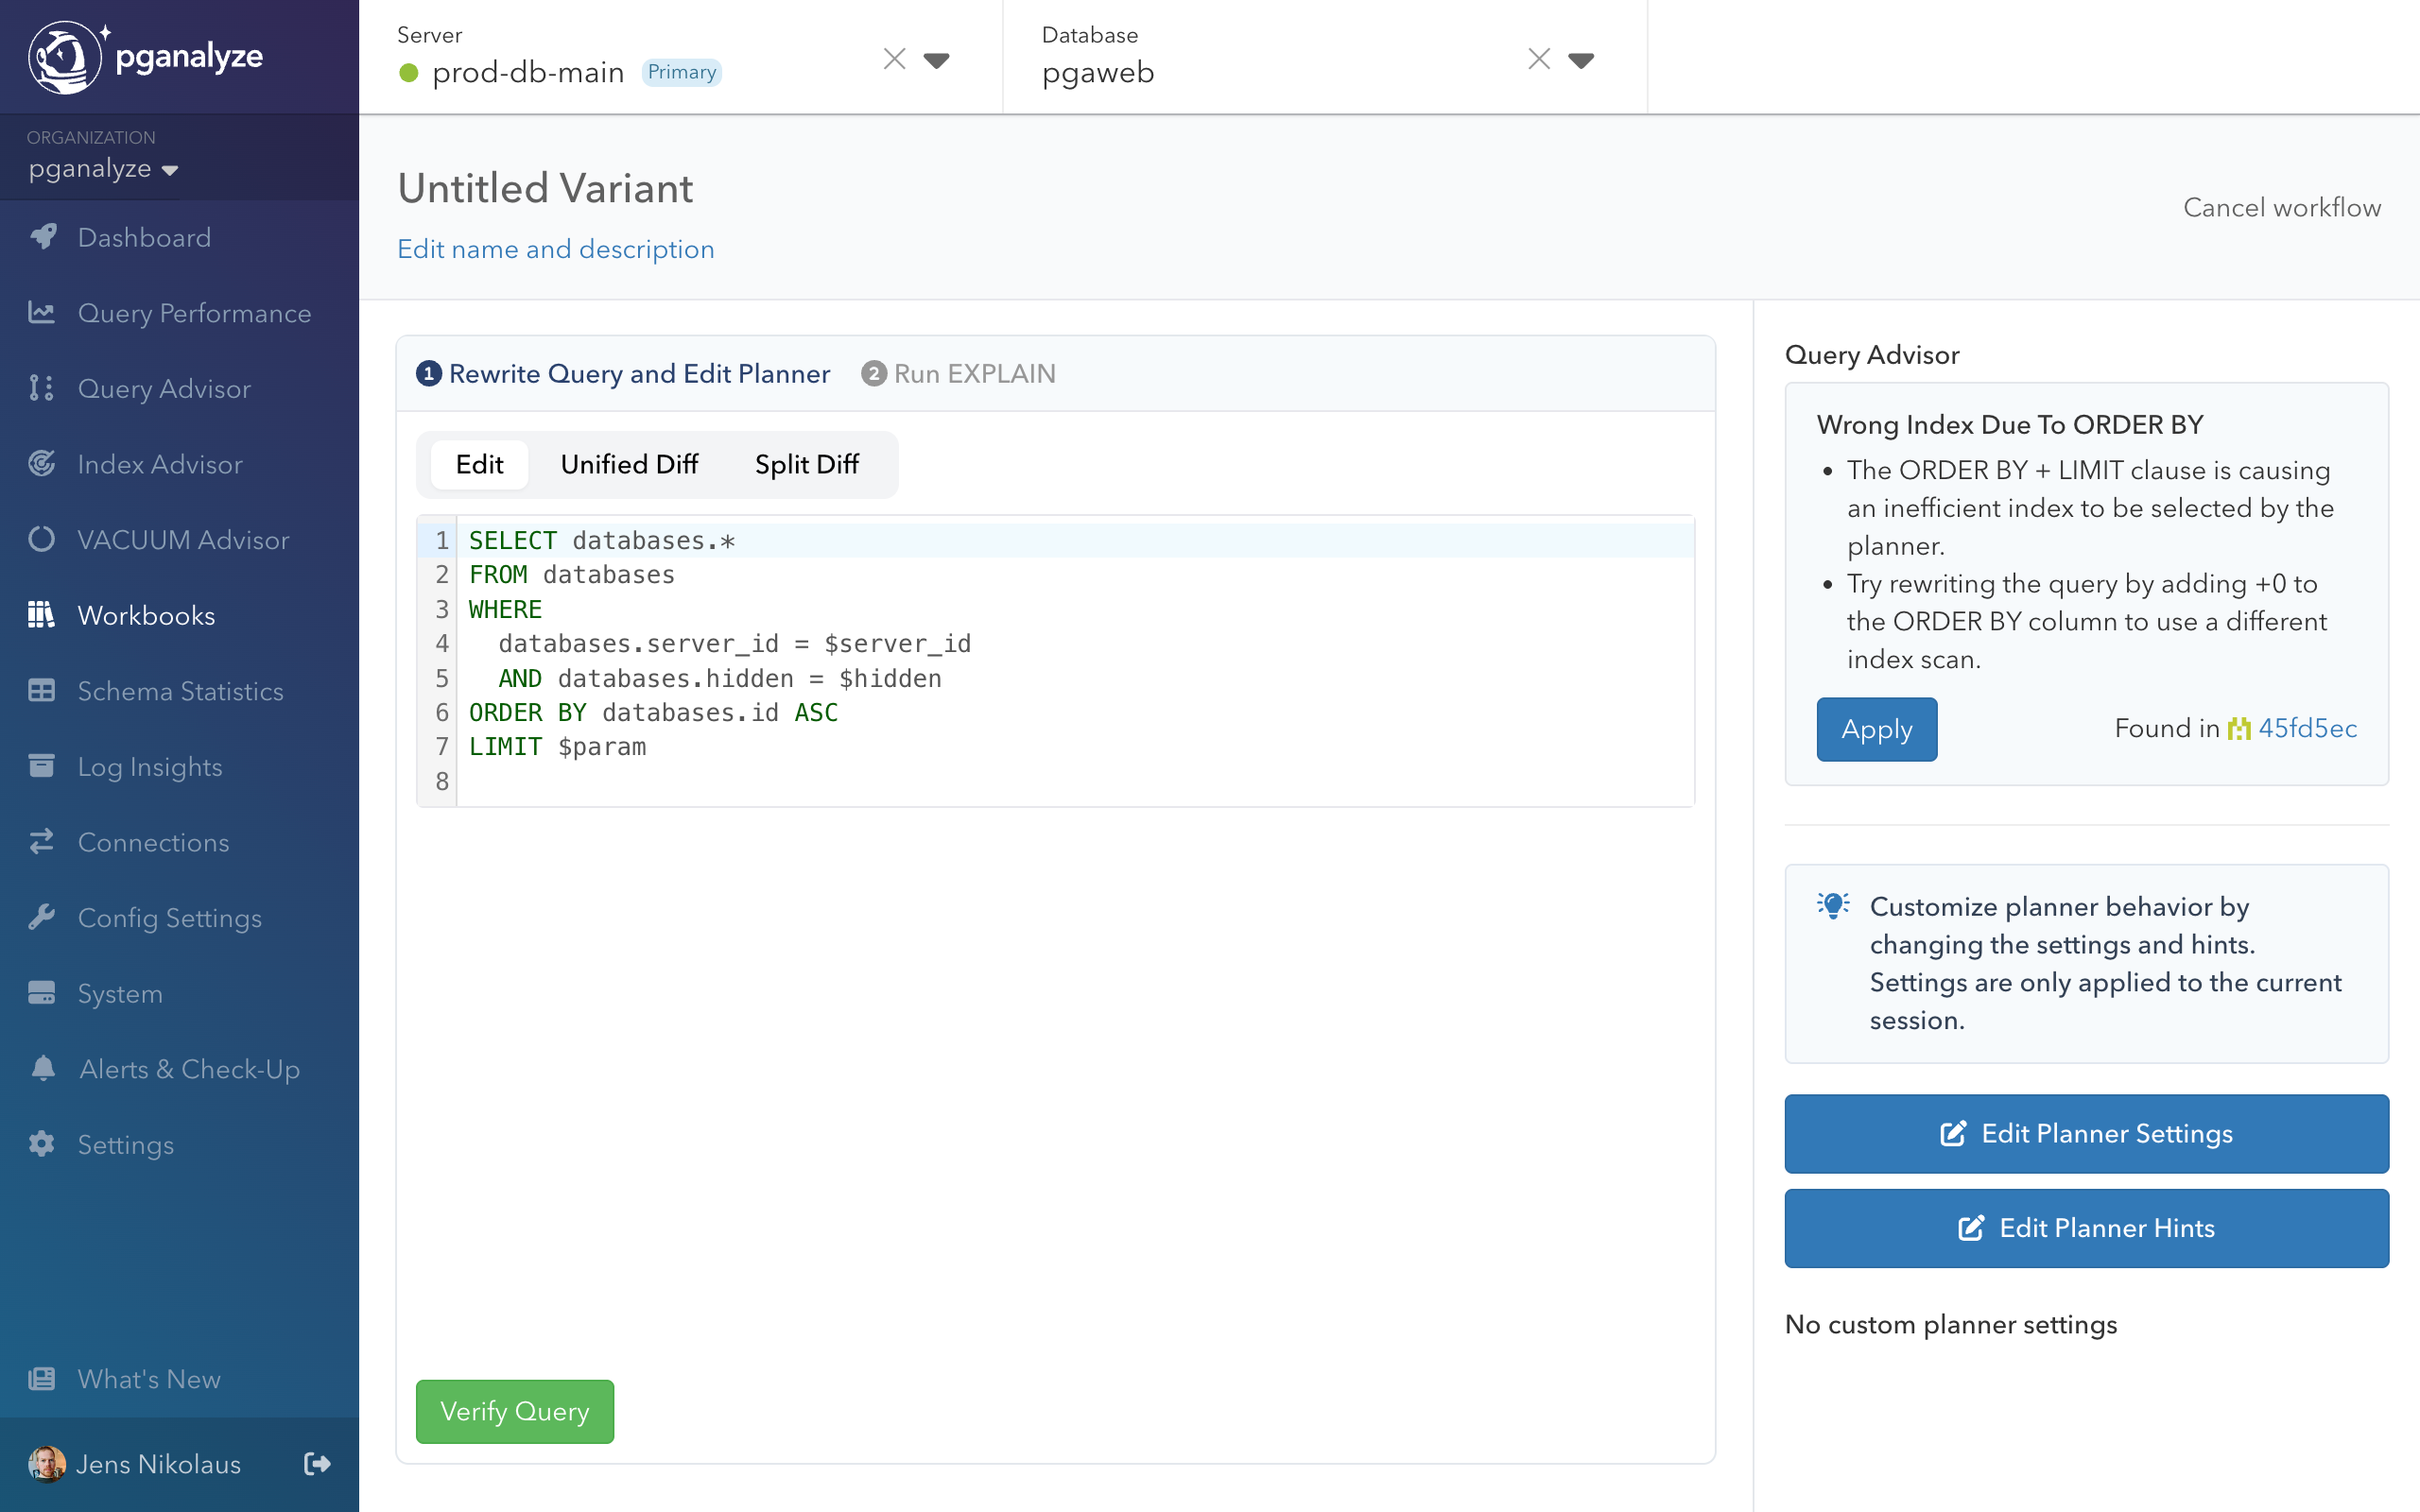
Automatic rewrite
Query Advisor automatically modified the query to force better index selection:
SELECT databases.*
FROM databases
WHERE databases.server_id =
AND databases.hidden =
ORDER BY databases.id + $zero ASC -- Added +0 to prevent index sort usage
LIMIT ;The $zero here is identical with 0. This is common workaround for this kind of Postgres query planner problem,
as it forces the planner to not use an index on the id column in the ORDER BY. Instead, the planner will prefer
indexes supporting the WHERE condition.
Step 5: Benchmark the optimization
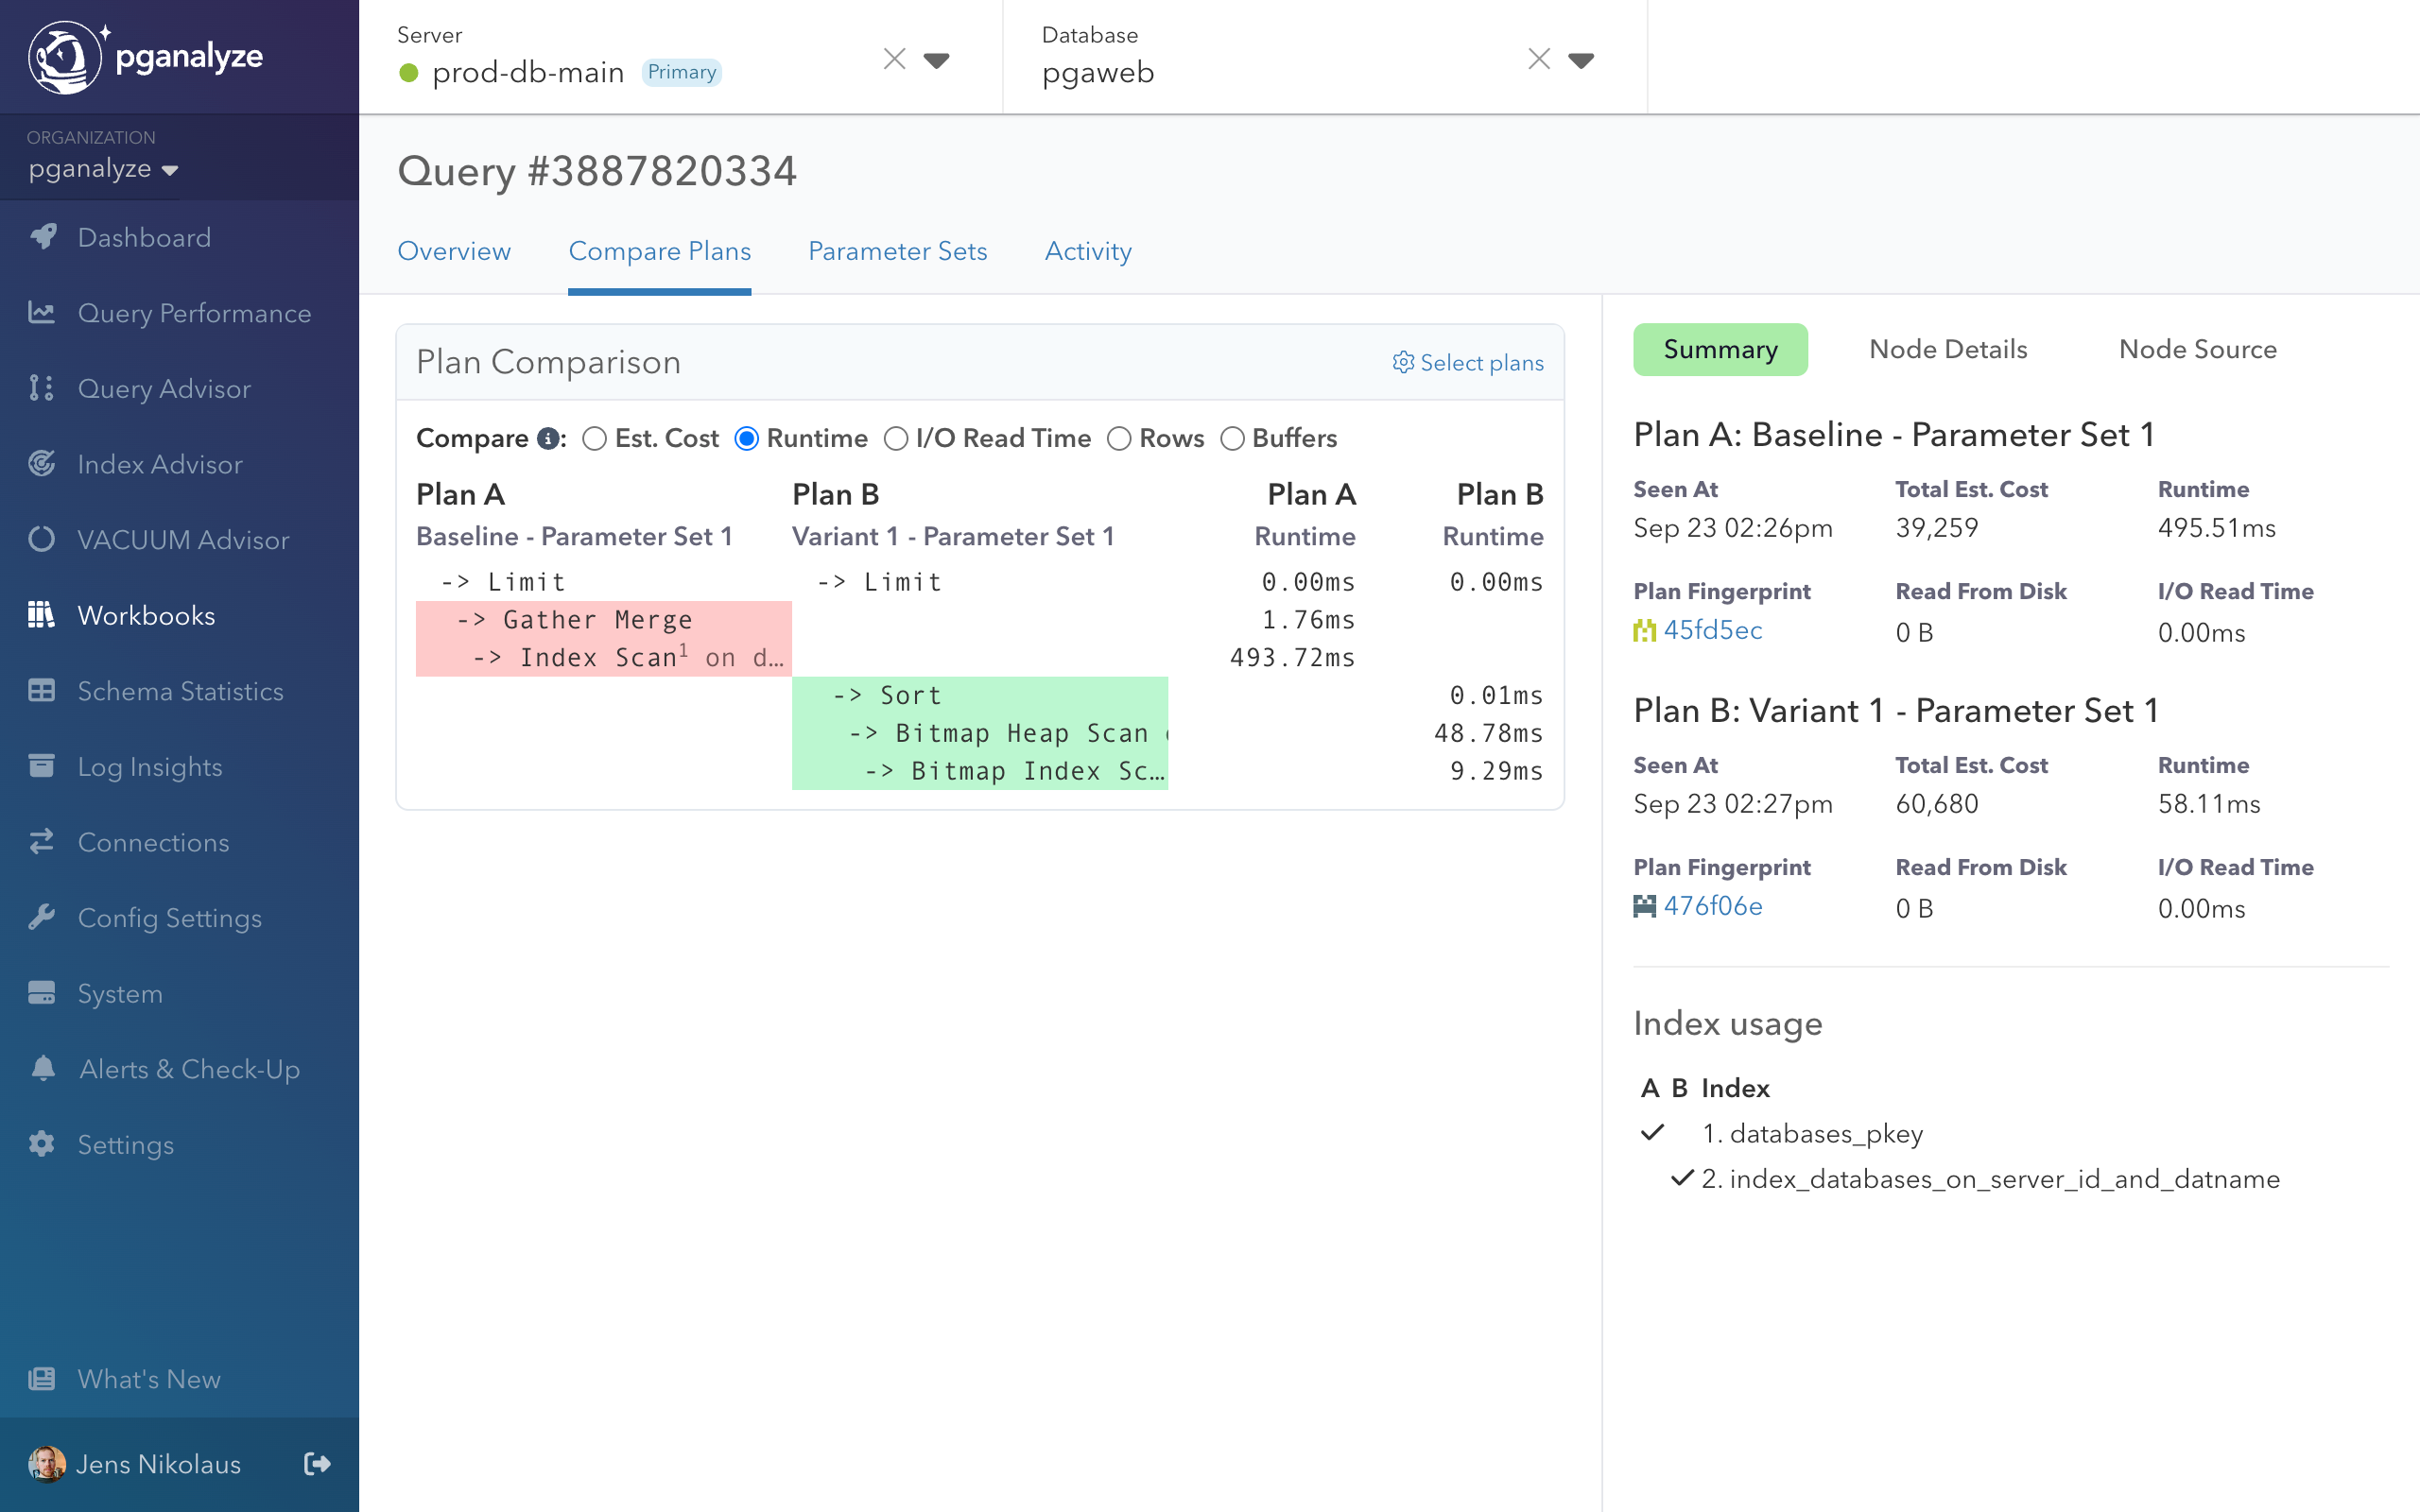
We executed the modified query using the collector workflow. We can see that the Baseline runtime went from 495.51ms to 58.11ms (8.5x improvement).
What might be surprising is that the Total Est. Cost actually increased from 39,259 to 60,680. Cost represents the “currency” the planner uses during planning, and also explains why the planner originally chose the inefficient plan - it assessed (incorrectly) that its cost was lower.
When we review the details with the Compare Plans feature in Workbooks, we can also see that the used index changed, based on the Index usage section on the bottom right, and corresponding index numbers in the plan.
Because Postgres can no longer use the index sort order to fulfill the ORDER BY we also see an
additional Sort node in Plan B (the rewritten query).
Step 6: Conclusion
The dramatic 8.5x improvement confirmed Query Advisor’s analysis was correct.
Postgres’s cost-based planner estimated it could find the limited rows quickly by scanning the primary key index in sort order. This failed because significant filtering happened after sorting, requiring examination of many irrelevant rows.
By preventing this optimization with the rewrite, Postgres instead used an index supporting the WHERE clause (server_id column)
for efficient filtering, and did not use the sort order of the index to fulfill the ORDER BY.
The Postgres planner estimated higher cost for the optimized version (60,680 vs 39,259 cost units), but actual runtime was 8.5x faster. This demonstrates why testing real performance is critical for validating planner estimates.
Step 7: Apply to production
With the collected evidence showing a clear performance improvement, the final step is implementing the optimization in the application through code changes, ORM adjustments, or database functions to complete the optimization workflow.
For certain situations this may be the same as the rewritten version, in other cases you may choose to implement another improvement based on the knowledge that a better plan is possible.
In this specific example, we may choose to either add the +0 in the application query, or we could alternatively create
a different index that both fulfills the WHERE and the ORDER BY conditions.
Understanding when insights may not reproduce
Query Advisor occasionally detects optimization opportunities that don’t reproduce during testing in workbooks:
- Table data changes: The data used in the query may have changed since the initial detection
- Statistics updates: An automatic or manual
ANALYZEupdated Postgres statistics, and resolved estimation issues - Parameter changes: The parameters that encountered the problematic query plan are different than the ones in the workbook.
You will also often see query runtime be lower in workbooks than in the Automated EXPLAIN data. This could be due to concurrent workloads (contention on system resources or locks), or cold vs. warm cache differences.
When insights don’t reproduce its recommended to:
- Check recent EXPLAIN plans: Verify the issue still occurs with current data
- Review ANALYZE runs on referenced tables: Check if table statistics were updated
- Test different parameters: Try multiple parameter sets from query samples
- Monitor over time: Some issues are intermittent based on data patterns
This is normal behavior, not a bug: Query Advisor detects real issues but database conditions can change.
Next steps
- Learn about all supported insights - Understand the full range of optimization patterns
- Set up alerts - Get notified when new opportunities are detected
- Explore Workbooks features - Master the testing and benchmarking platform
- Configure auto_explain - Ensure optimal data collection for Query Advisor
Couldn't find what you were looking for or want to talk about something specific?
Start a conversation with us →