
Step 4: Test and Verify
At this point, your pganalyze setup should be ready to collect EXPLAIN plans. Since you may not have any slow queries in your system right now, we can generate a synthetic slow query that we can use to confirm everything is working.
The collector includes a flag to do this for you automatically, based on your
auto_explain.log_min_duration:
sudo pganalyze-collector --test-explainThis will produce no output but will run an artificially slow query using the
Postgres pg_sleep function.
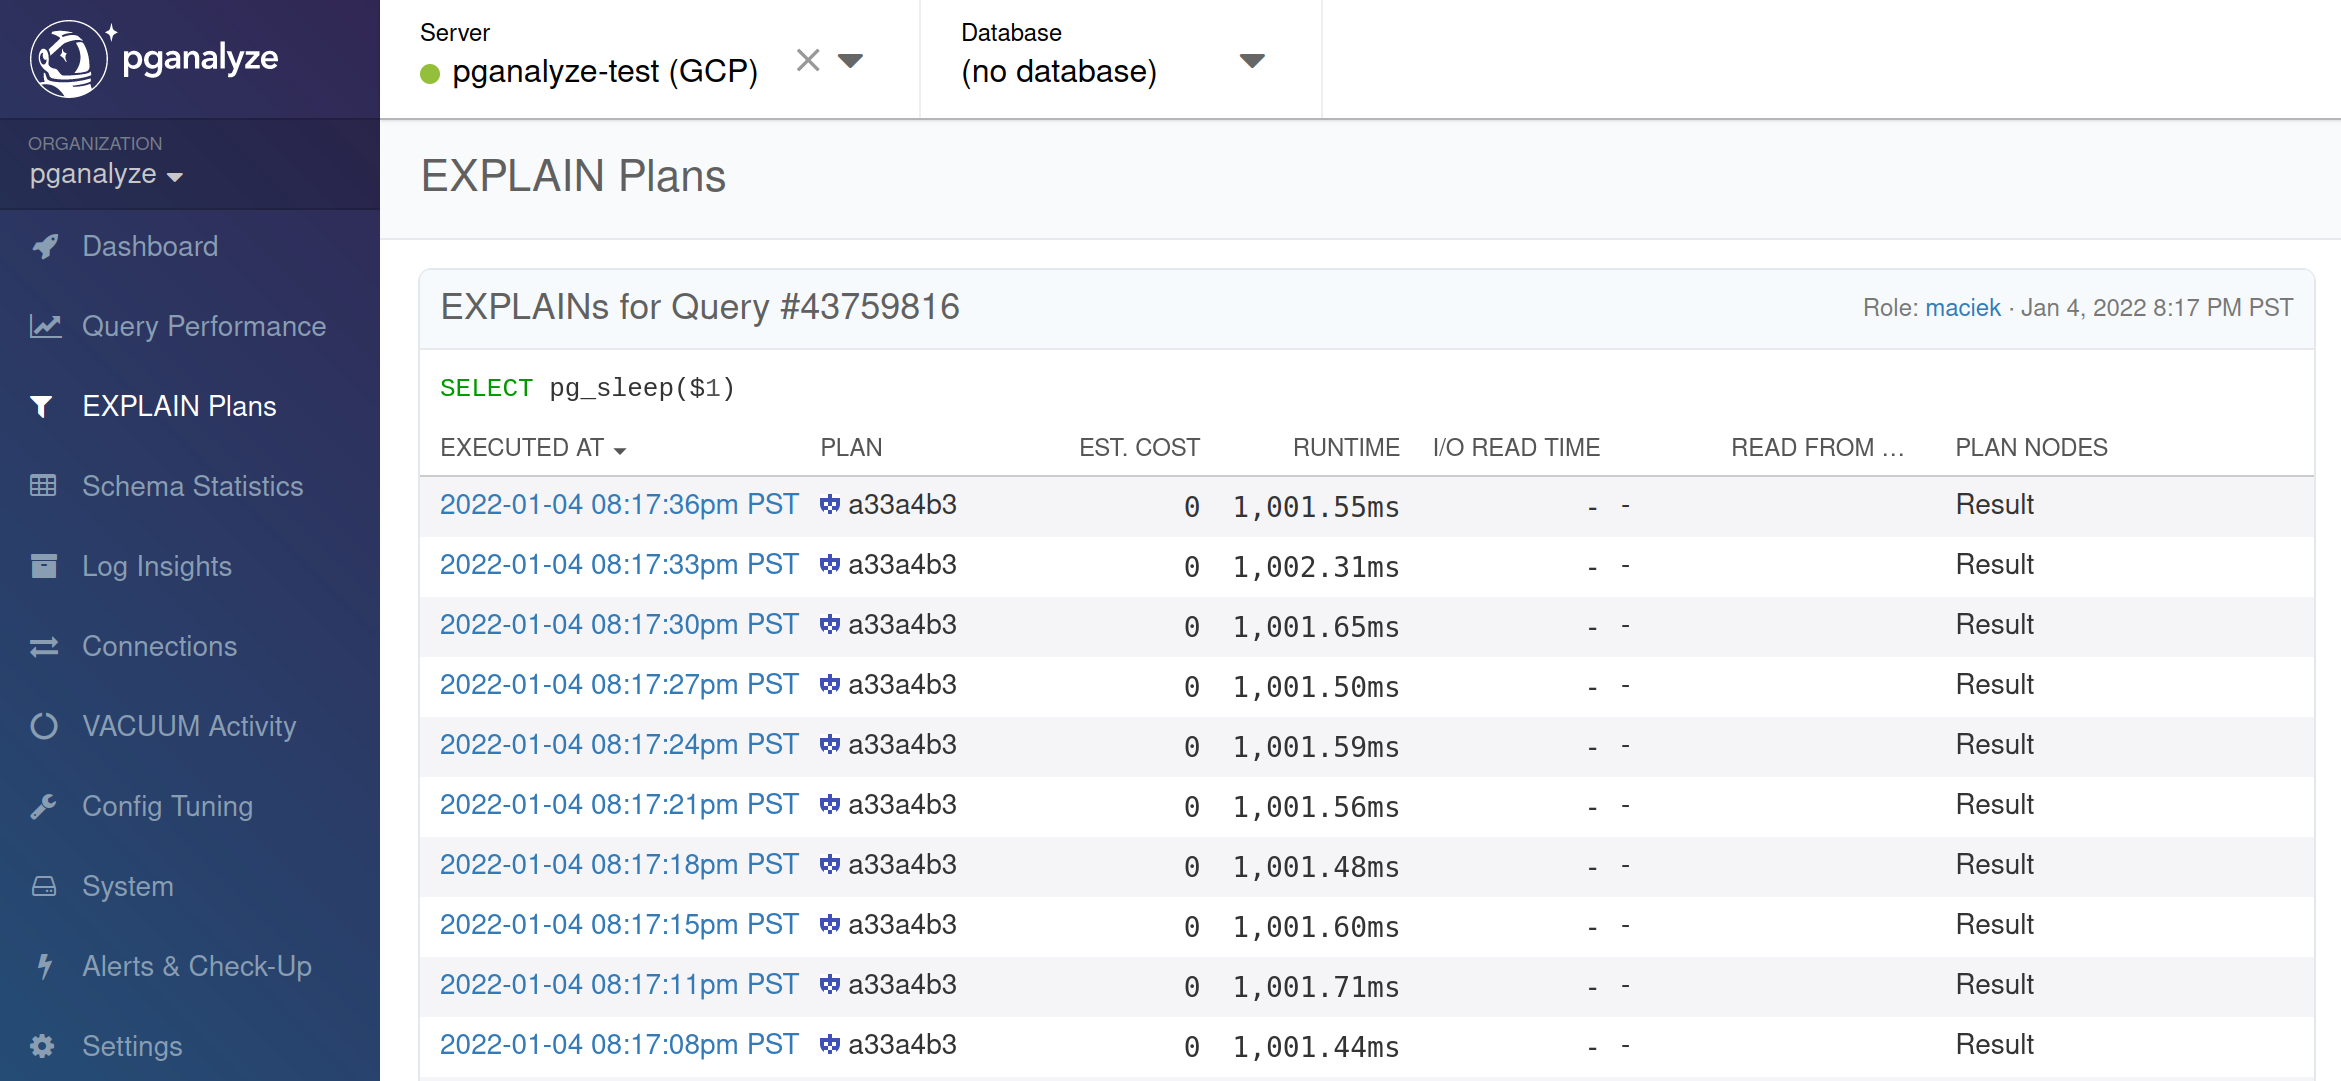
Assuming the collector is running in the background, after a few minutes you should then see EXPLAIN plans show up in the pganalyze EXPLAIN plan list:
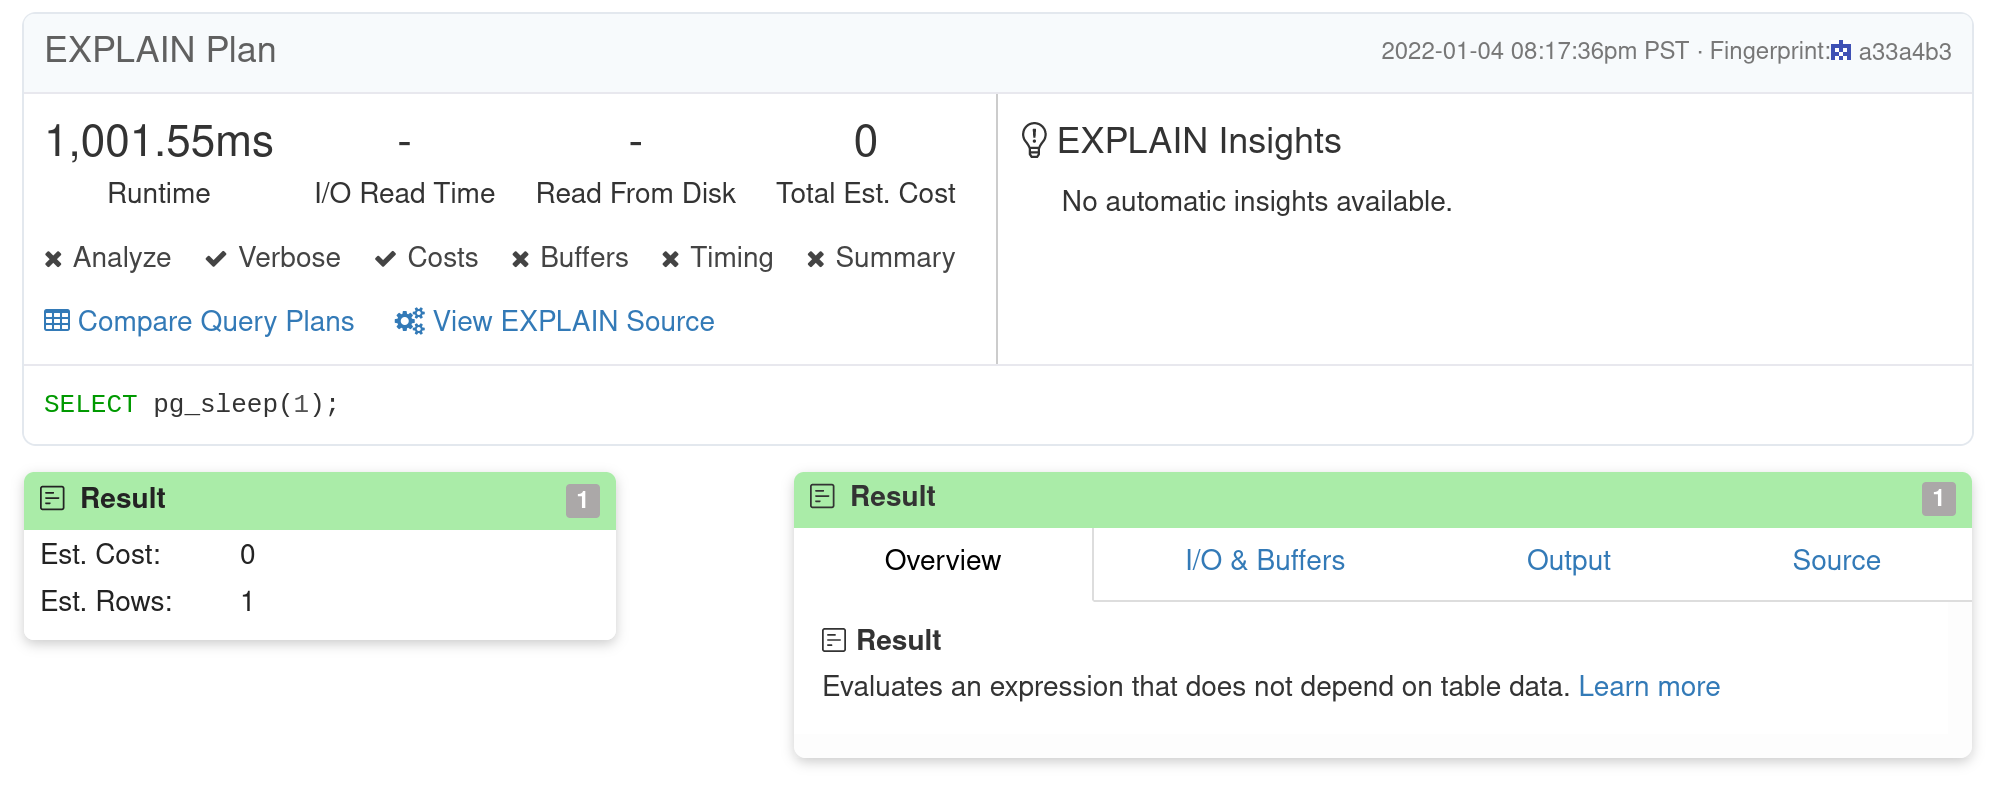
When you select one of the query executions in this list, you will see details of the corresponding plan:
From now on, you will now get EXPLAIN plans automatically in the pganalyze UI, for all your slow queries.
Couldn't find what you were looking for or want to talk about something specific?
Start a conversation with us →