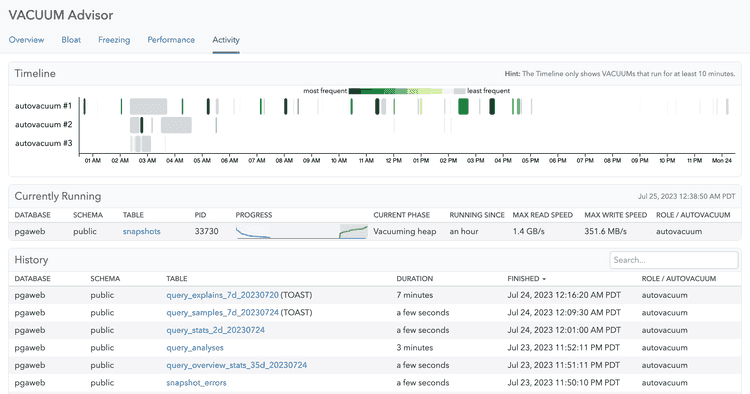
Activity in VACUUM Advisor
If you want to understand which VACUUM processes are currently running, for example to explain higher I/O usage, you can see this information in the Activity tab. Here you can see currently running vacuums and autovacuums, a history of all VACUUM runs, how long they ran for, and when the process finished.
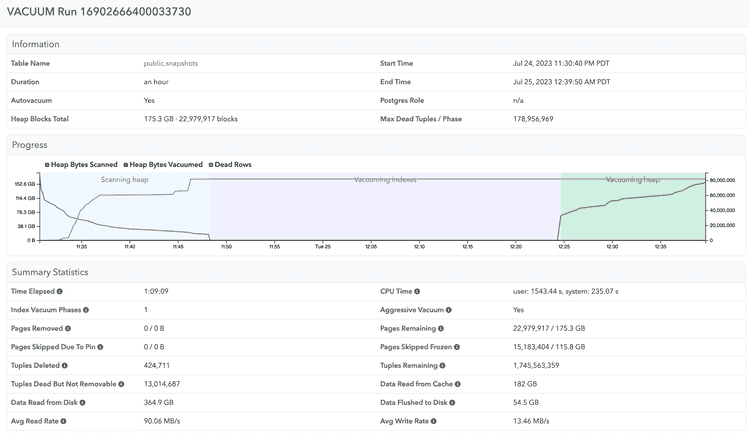
You can click on individual tables to see a visualization of an individual VACUUM run, as well as summary
statistics that are collected when log_autovacuum_min_duration is turned on:
Couldn't find what you were looking for or want to talk about something specific?
Start a conversation with us →

