
Per table VACUUM/ANALYZE Activity in Schema Statistics
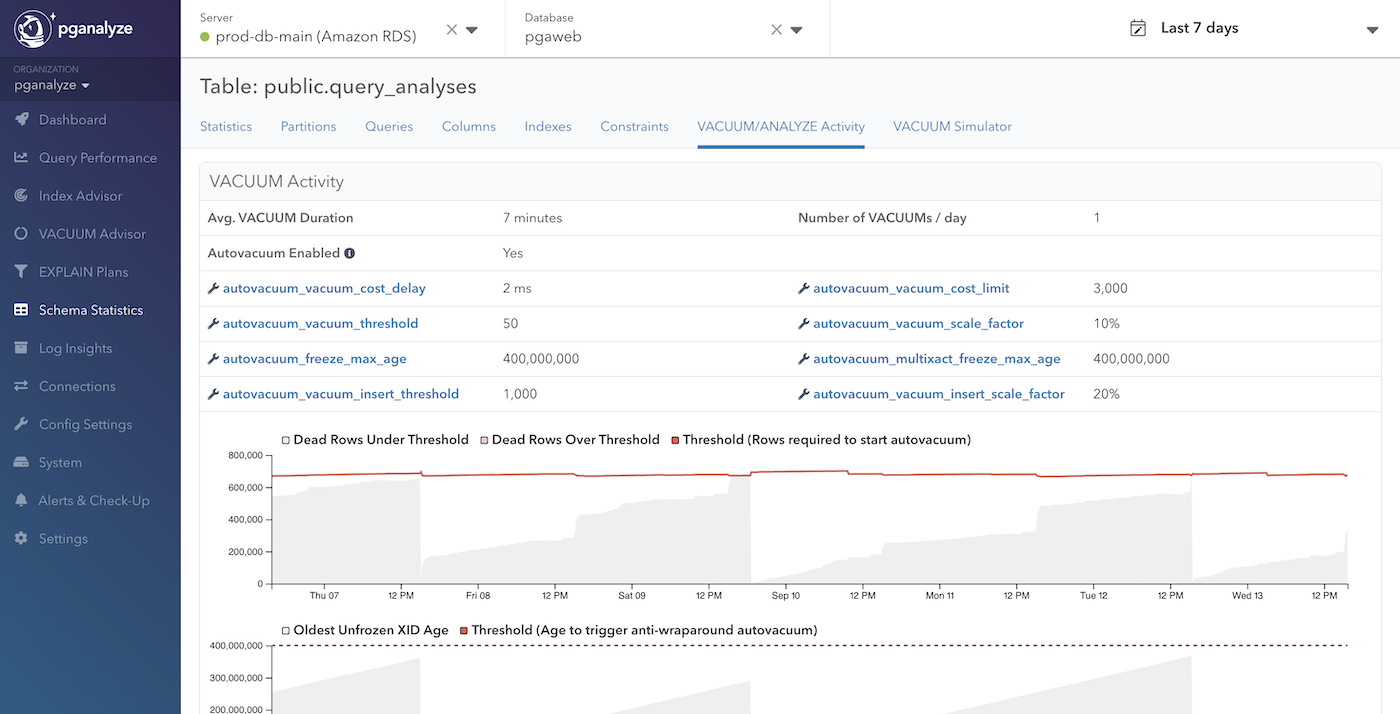
VACUUM Advisor gives you a holistic view of VACUUM Activity on your database server. If you want to look into the details of VACUUM and ANALYZE activity of each table, you can find it in the VACUUM/ANALYZE Activity tab in the Schema Statistics page.
VACUUM Activity
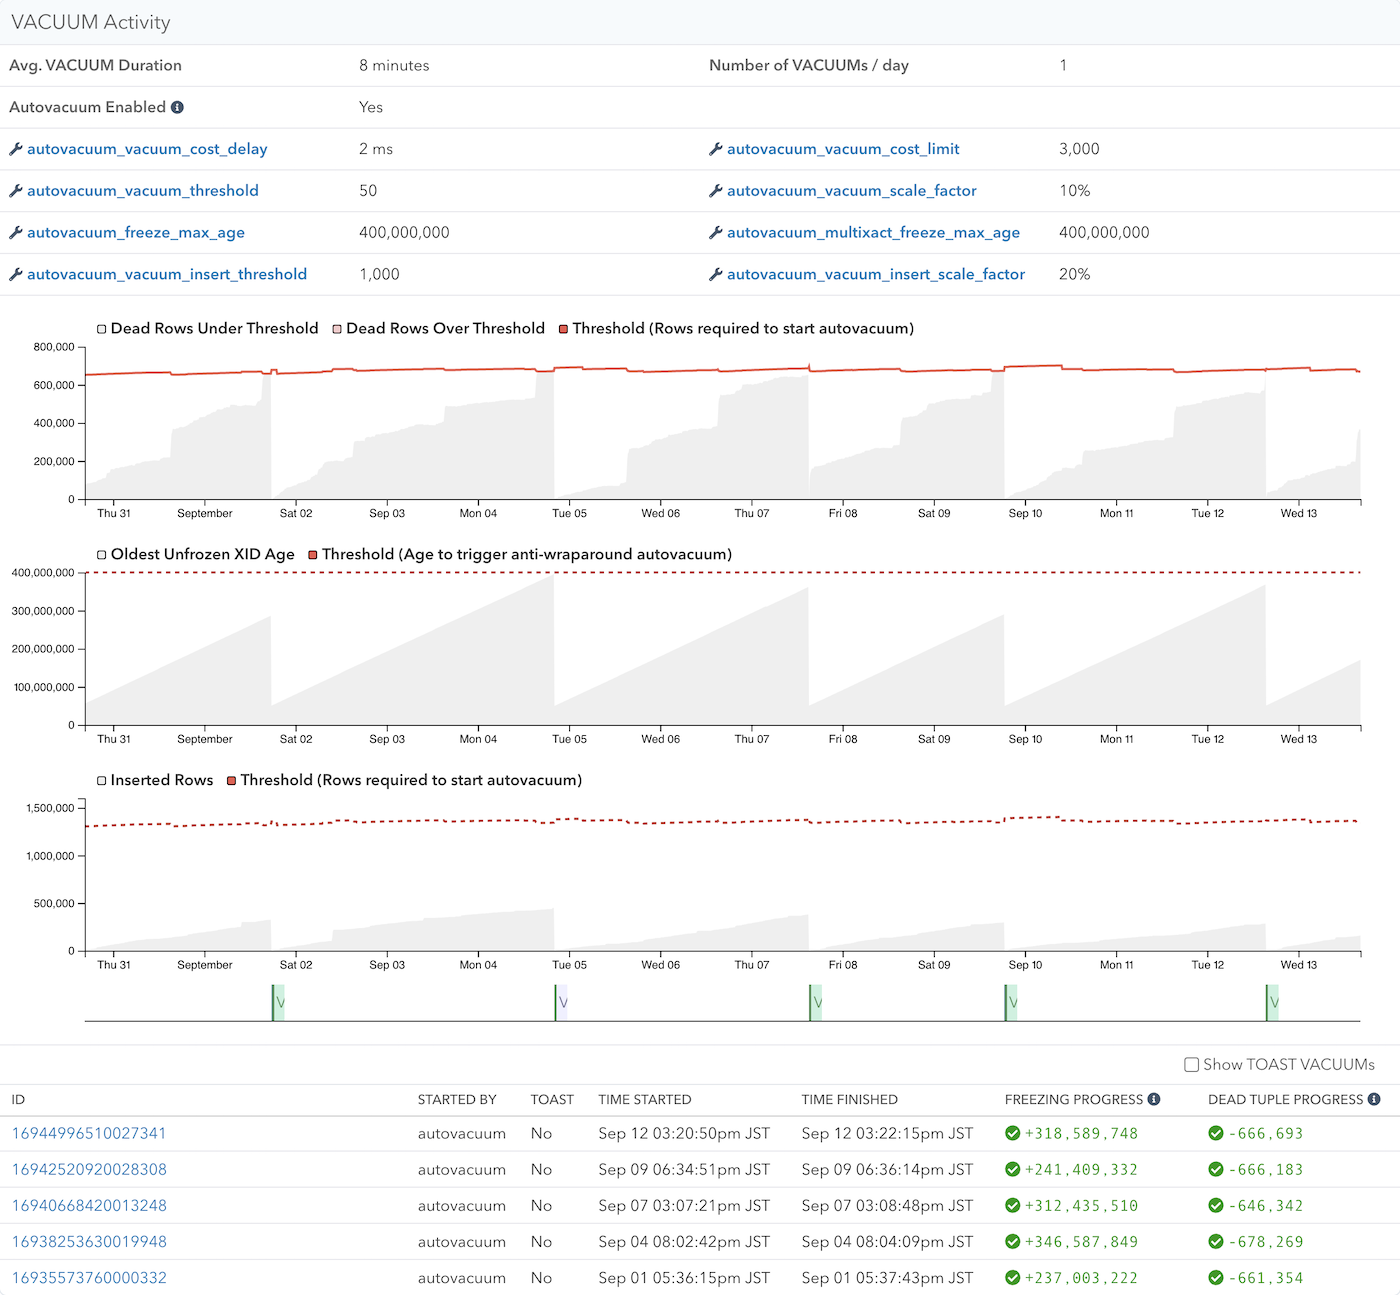
In the VACUUM Activity panel, you can learn information such as an average VACUUM duration of the table, as well as the number of VACUUMs per day. You can also check out the current VACUUM-related configuration of the particular table. There are also three additional graphs displayed above the VACUUM runs graph:
- Graph of dead rows (tuples) and the threshold to start autovacuums
- Graph of the oldest unfrozen transaction ID age and the threshold to start anti-wraparound autovacuums
- Graph of inserted rows and the threshold to start autovacuums (available from Postgres 13)
When you see an autovacuum run in the VACUUM runs graph, you can usually find a corresponding cause in above 3 graphs. When autovacuum is invoked, you can observe that at least one of the graphs exceeds or comes close to exceeding its corresponding threshold, and then the value drops after the invocation.
Below the graphs, there is a list showing all VACUUM runs during the specified
time period. The VACUUM runs graph and this list might report fewer VACUUM runs
than actually occurred when log_autovacuum_min_duration is turned off, is
turned on but set to a high value, or if Log Insights is not enabled.
In this list, you can check out the progress of freezing old transaction IDs or cleaning up dead tuples (dead rows). Both processes should occur with each VACUUM run; however, it is possible that no progress occurs under the following situations:
- No freezing progress: the current oldest unfrozen transaction ID age is under
vacuum_freeze_min_age - No dead tuple progress: more dead tuples were created while VACUUM was running
Estimated Table Bloat
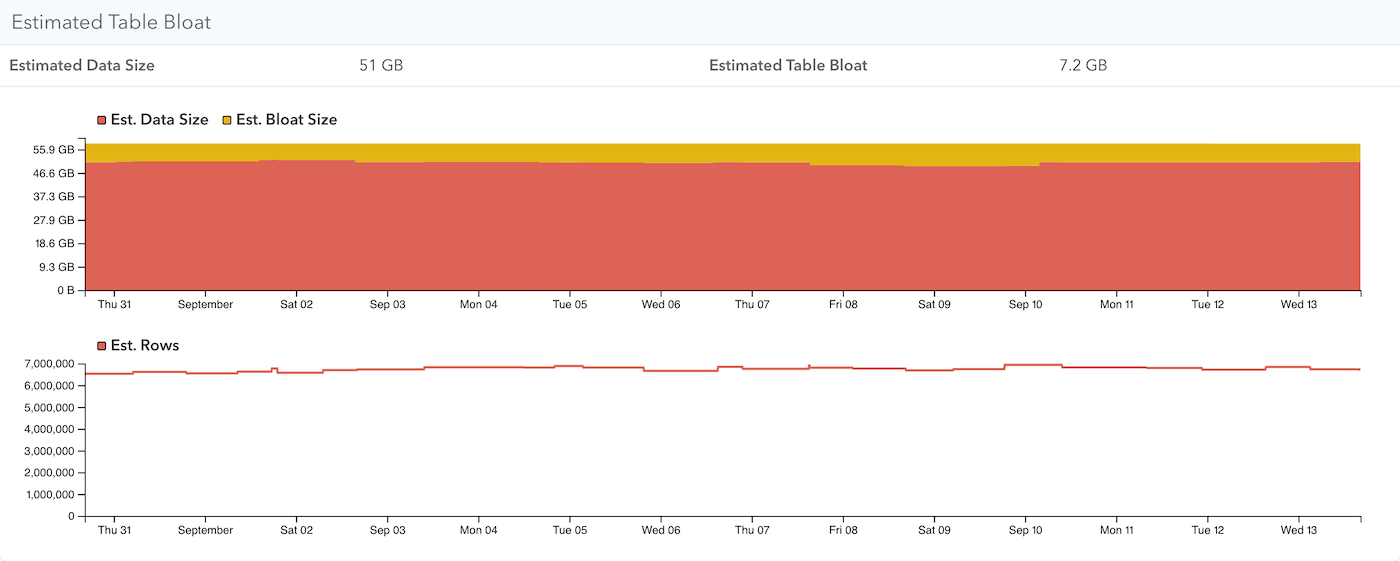
In the Estimated Table Bloat panel, you can check out the current estimated data and bloat size, as well as their values over time. Note that this doesn’t include the index bloat currently. You can check out the overall bloat information of your database in VACUUM Advisor.
ANALYZE Activity
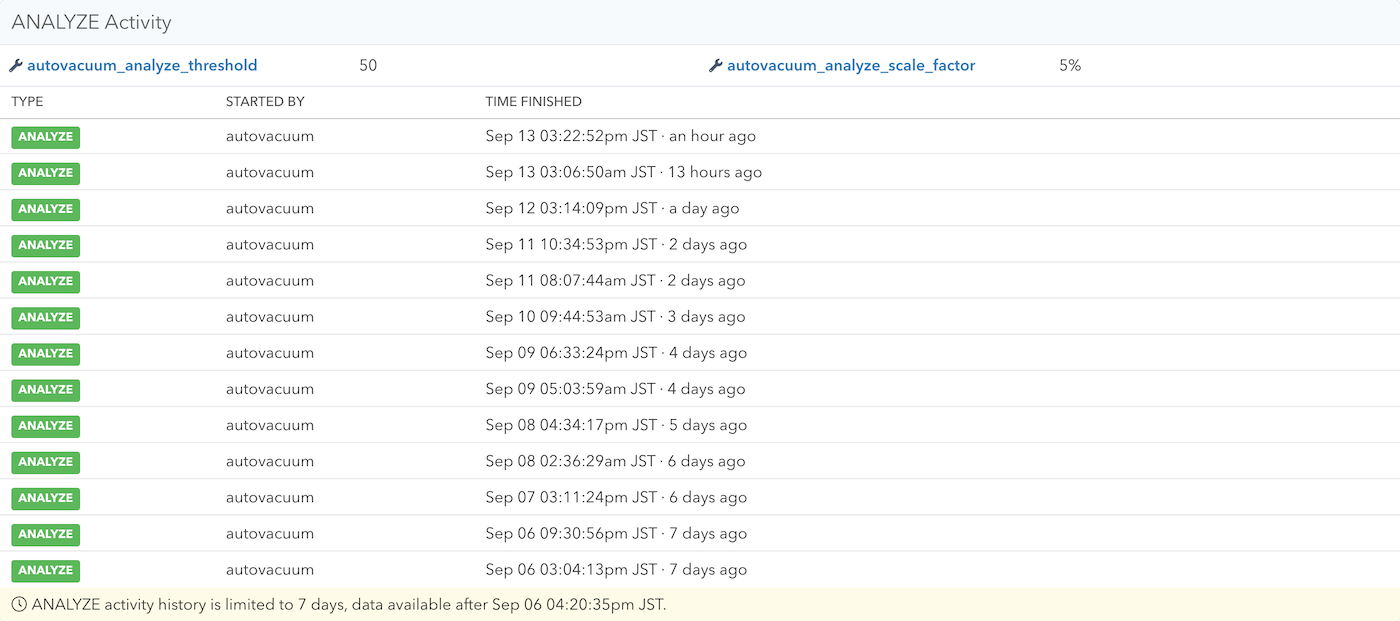
In the ANALYZE Activity panel, you can see a list of ANALYZE runs during the specified time period. This list might report fewer ANALYZE runs than actually occurred, as we only collect this information every once a minute. The history of ANALYZE activity is currently limited to 7 days.
Couldn't find what you were looking for or want to talk about something specific?
Start a conversation with us →