
Step 5: Configure the Collector
The collector configuration file lives in /etc/pganalyze-collector.conf, and looks like this:
[pganalyze]
api_key = your_pga_organization_api_key
[server1]
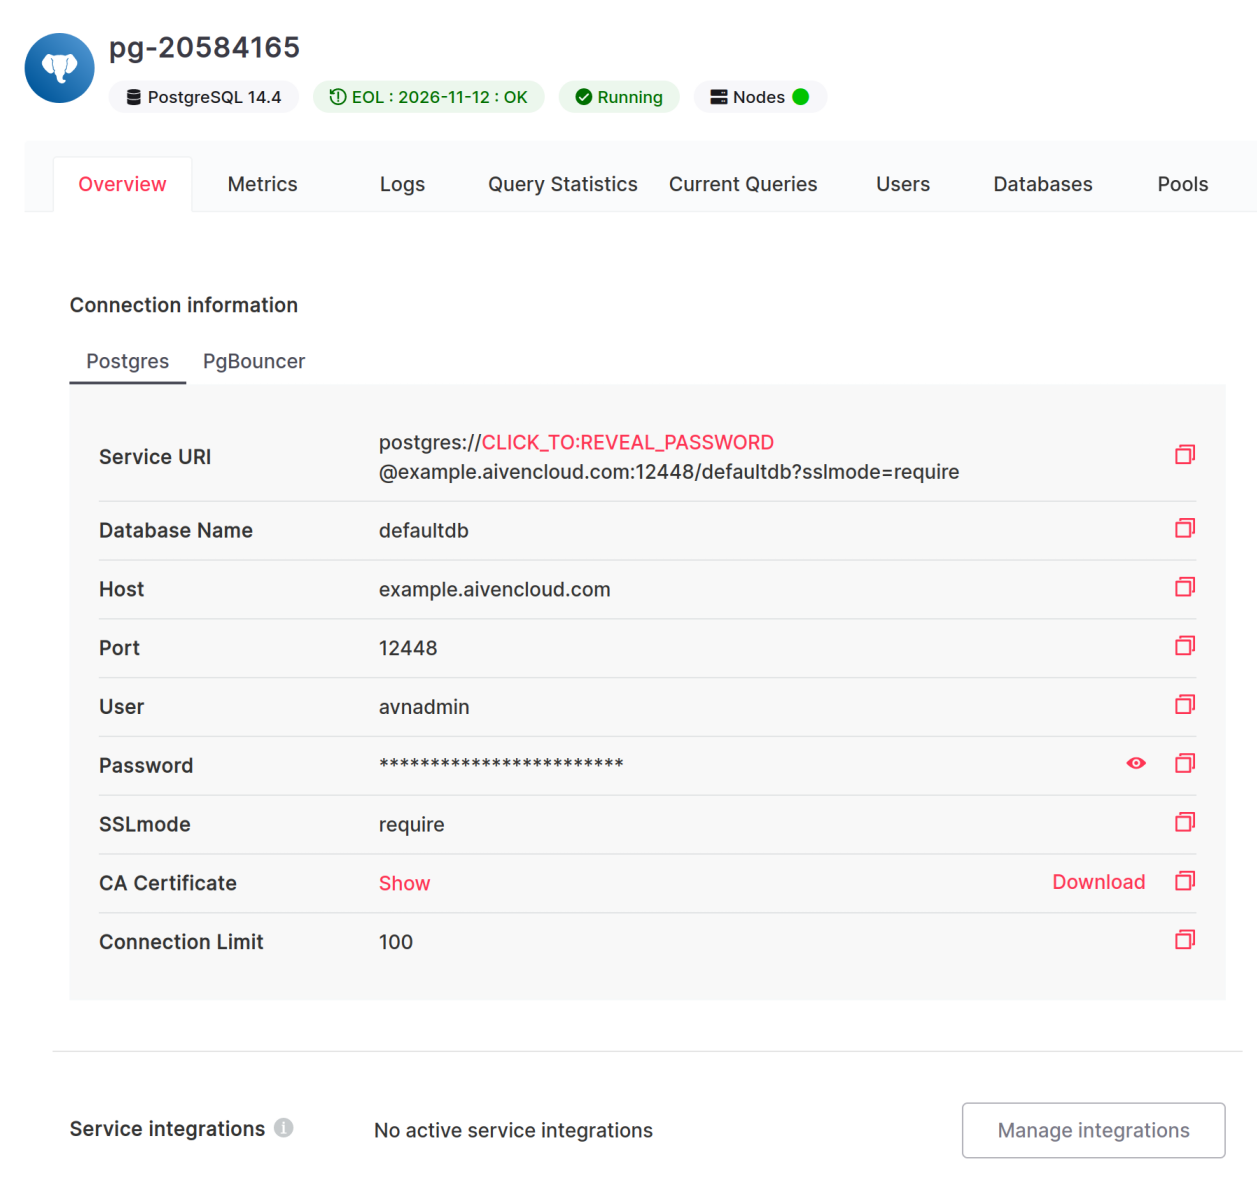
db_host = your_database_host
db_port = your_database_port
db_name = your_database_name
db_username = your_monitoring_user
db_password = your_monitoring_user_passwordFill in the values from the info in your Aiven console:
-
The
api_keycan be found in the pganalyze Settings page for your organization, under the API Access tab - The
db_hostis the hostname of your PostgreSQL instance (example.aivencloud.comabove) - The
db_portis the port your PostgreSQL server is running on (12448above) - The
db_nameis the database you want to monitor (defaultdbabove—make sure this is the same database where you created thepg_stat_statementsextension in Step 2) - The
db_usernameanddb_passwordshould be the credentials of the monitoring user we created in Step 1
Testing the new configuration
Run the following to make sure the configuration works:
sudo pganalyze-collector --testOnce you’ve confirmed the install is successful and you’re receiving query data in pganalyze, we recommend setting up Log Insights as a follow-up step, to automatically track log events in your database.
Couldn't find what you were looking for or want to talk about something specific?
Start a conversation with us →