
Query text unavailable and reducing memory usage
If the collector is using too much memory or <query text unavailable> is showing up in pganalyze,
you may want to set up an automatic reset of pg_stat_statements.
<query text unavailable>
Earlier versions of Postgres aren’t able to group certain queries together (e.g. those using IN
lists of variable lengths), leading to many duplicate entries that often have very low call counts.
When pg_stat_statements.max is reached, Postgres will deallocate (remove) entries based on their
usage, which is based on the call count. In periods of high database activity this can happen so
quickly that the collector isn’t able to capture the query text, causing <query text unavailable>
to show up in pganalyze.
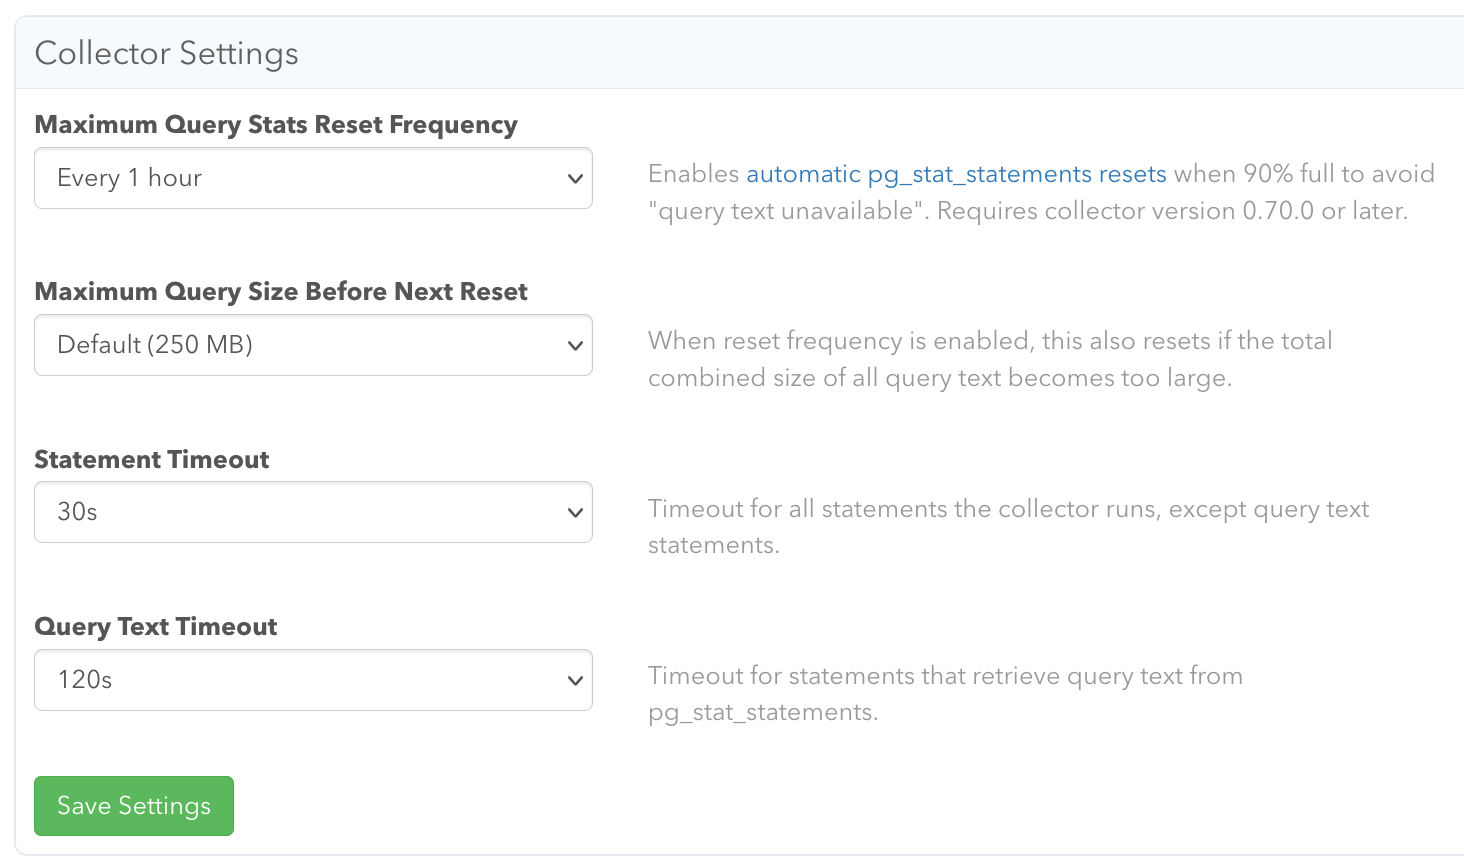
This can be addressed by enabling the “Maximum Query Stats Reset Frequency” setting in pganalyze.
We recommend a setting of “Every 1 hour” unless you’re specifically concerned about lock contention
(LWLock:pg_stat_statements) on a very busy database. This enables automatic pg_stat_statments
resets once the statement space is 90% full (so a deallocation would occur soon), but resets will
not occur more often than the frequency setting you choose.
High memory usage
Every 10 minutes, the collector loads the query text from pg_stat_statements into memory in order to normalize and fingerprint it. This is a very expensive step and can result in the collector crashing from running out of memory. To address that, when resets are enabled with the “Maximum Query Stats Reset Frequency” setting, the collector will also perform a reset if the aggregate size of the query text returned from pg_stat_statements grows beyond 250 MB. You can optionally increase that limit using the “Maximum Query Size Before Next Reset” setting, which can be advisable when you have very large query texts.
Setup
Collector version 0.70.0 or later is required.
We recommend defining this function to avoid permissions errors:
CREATE OR REPLACE FUNCTION pganalyze.reset_stat_statements() RETURNS SETOF void AS
$$
  /* pganalyze-collector */ SELECT * FROM public.pg_stat_statements_reset();
$$ LANGUAGE sql VOLATILE SECURITY DEFINER;
After enabling the “Maximum Query Stats Reset Frequency” setting on the server settings page and optionally tuning “Maximum Query Size Before Next Reset”, the collector will automatically perform resets when needed. You should see evidence of that in the collector logs.
Sources of pg_stat_statements churn
These issues cause queries to not be grouped properly in pg_stat_statements. Enabling the collector’s automatic statement reset ensures that pganalyze tracks the queries despite these issues, but you may want to address their root causes so other Postgres monitoring tools can more reliably depend on pg_stat_statements.
- Queries with a variable number of bind params like
id IN ($1, $2, ...)which can be addressed by upgrading to Postgres 18 or by rewriting the query to useid = ANY($1::bigint[]) - Utility statements including a random comment (like a request ID), which can be addressed by
upgrading to Postgres 16 or by setting
pg_stat_statements.track_utility = off - Dynamically-generated queries with varying column lists or where clauses, which can be addressed by
increasing
pg_stat_statements.maxat the cost of higher Postgres memory usage
Couldn't find what you were looking for or want to talk about something specific?
Start a conversation with us →