
Step 2: Configure Collector
We can now configure the log directory for the collector, by adding the db_log_location setting,
similar to this:
db_log_location = [log location discovered in Step 1]Then, use the --test-logs option of the collector to verify that log collection and parsing works:
sudo pganalyze-collector --test-logs --reloadIn the successful case, the log output will look like this:
2021/02/17 11:50:27 I Running collector test with pganalyze-collector 0.36.0
2021/02/17 11:50:27 I [server1] Testing log collection (local)...
2021/02/17 11:50:33 I [server1]   Local log test successful
2021/02/17 11:50:33 I Re-running log test with reduced privileges of "pganalyze" user (uid = 107, gid = 113)
2021/02/17 11:50:34 I [server1] Testing log collection (local)...
2021/02/17 11:50:46 I [server1]   Local log test successful
2021/02/17 11:50:47 I Successfully reloaded pganalyze collector (PID 123)
The collector should now be processing logs and they should show up in pganalyze shortly.
If you get an error about your Postgres log_line_prefix, check our
troubleshooting documentation.
If logs take longer than a few minutes, try restarting the collector:
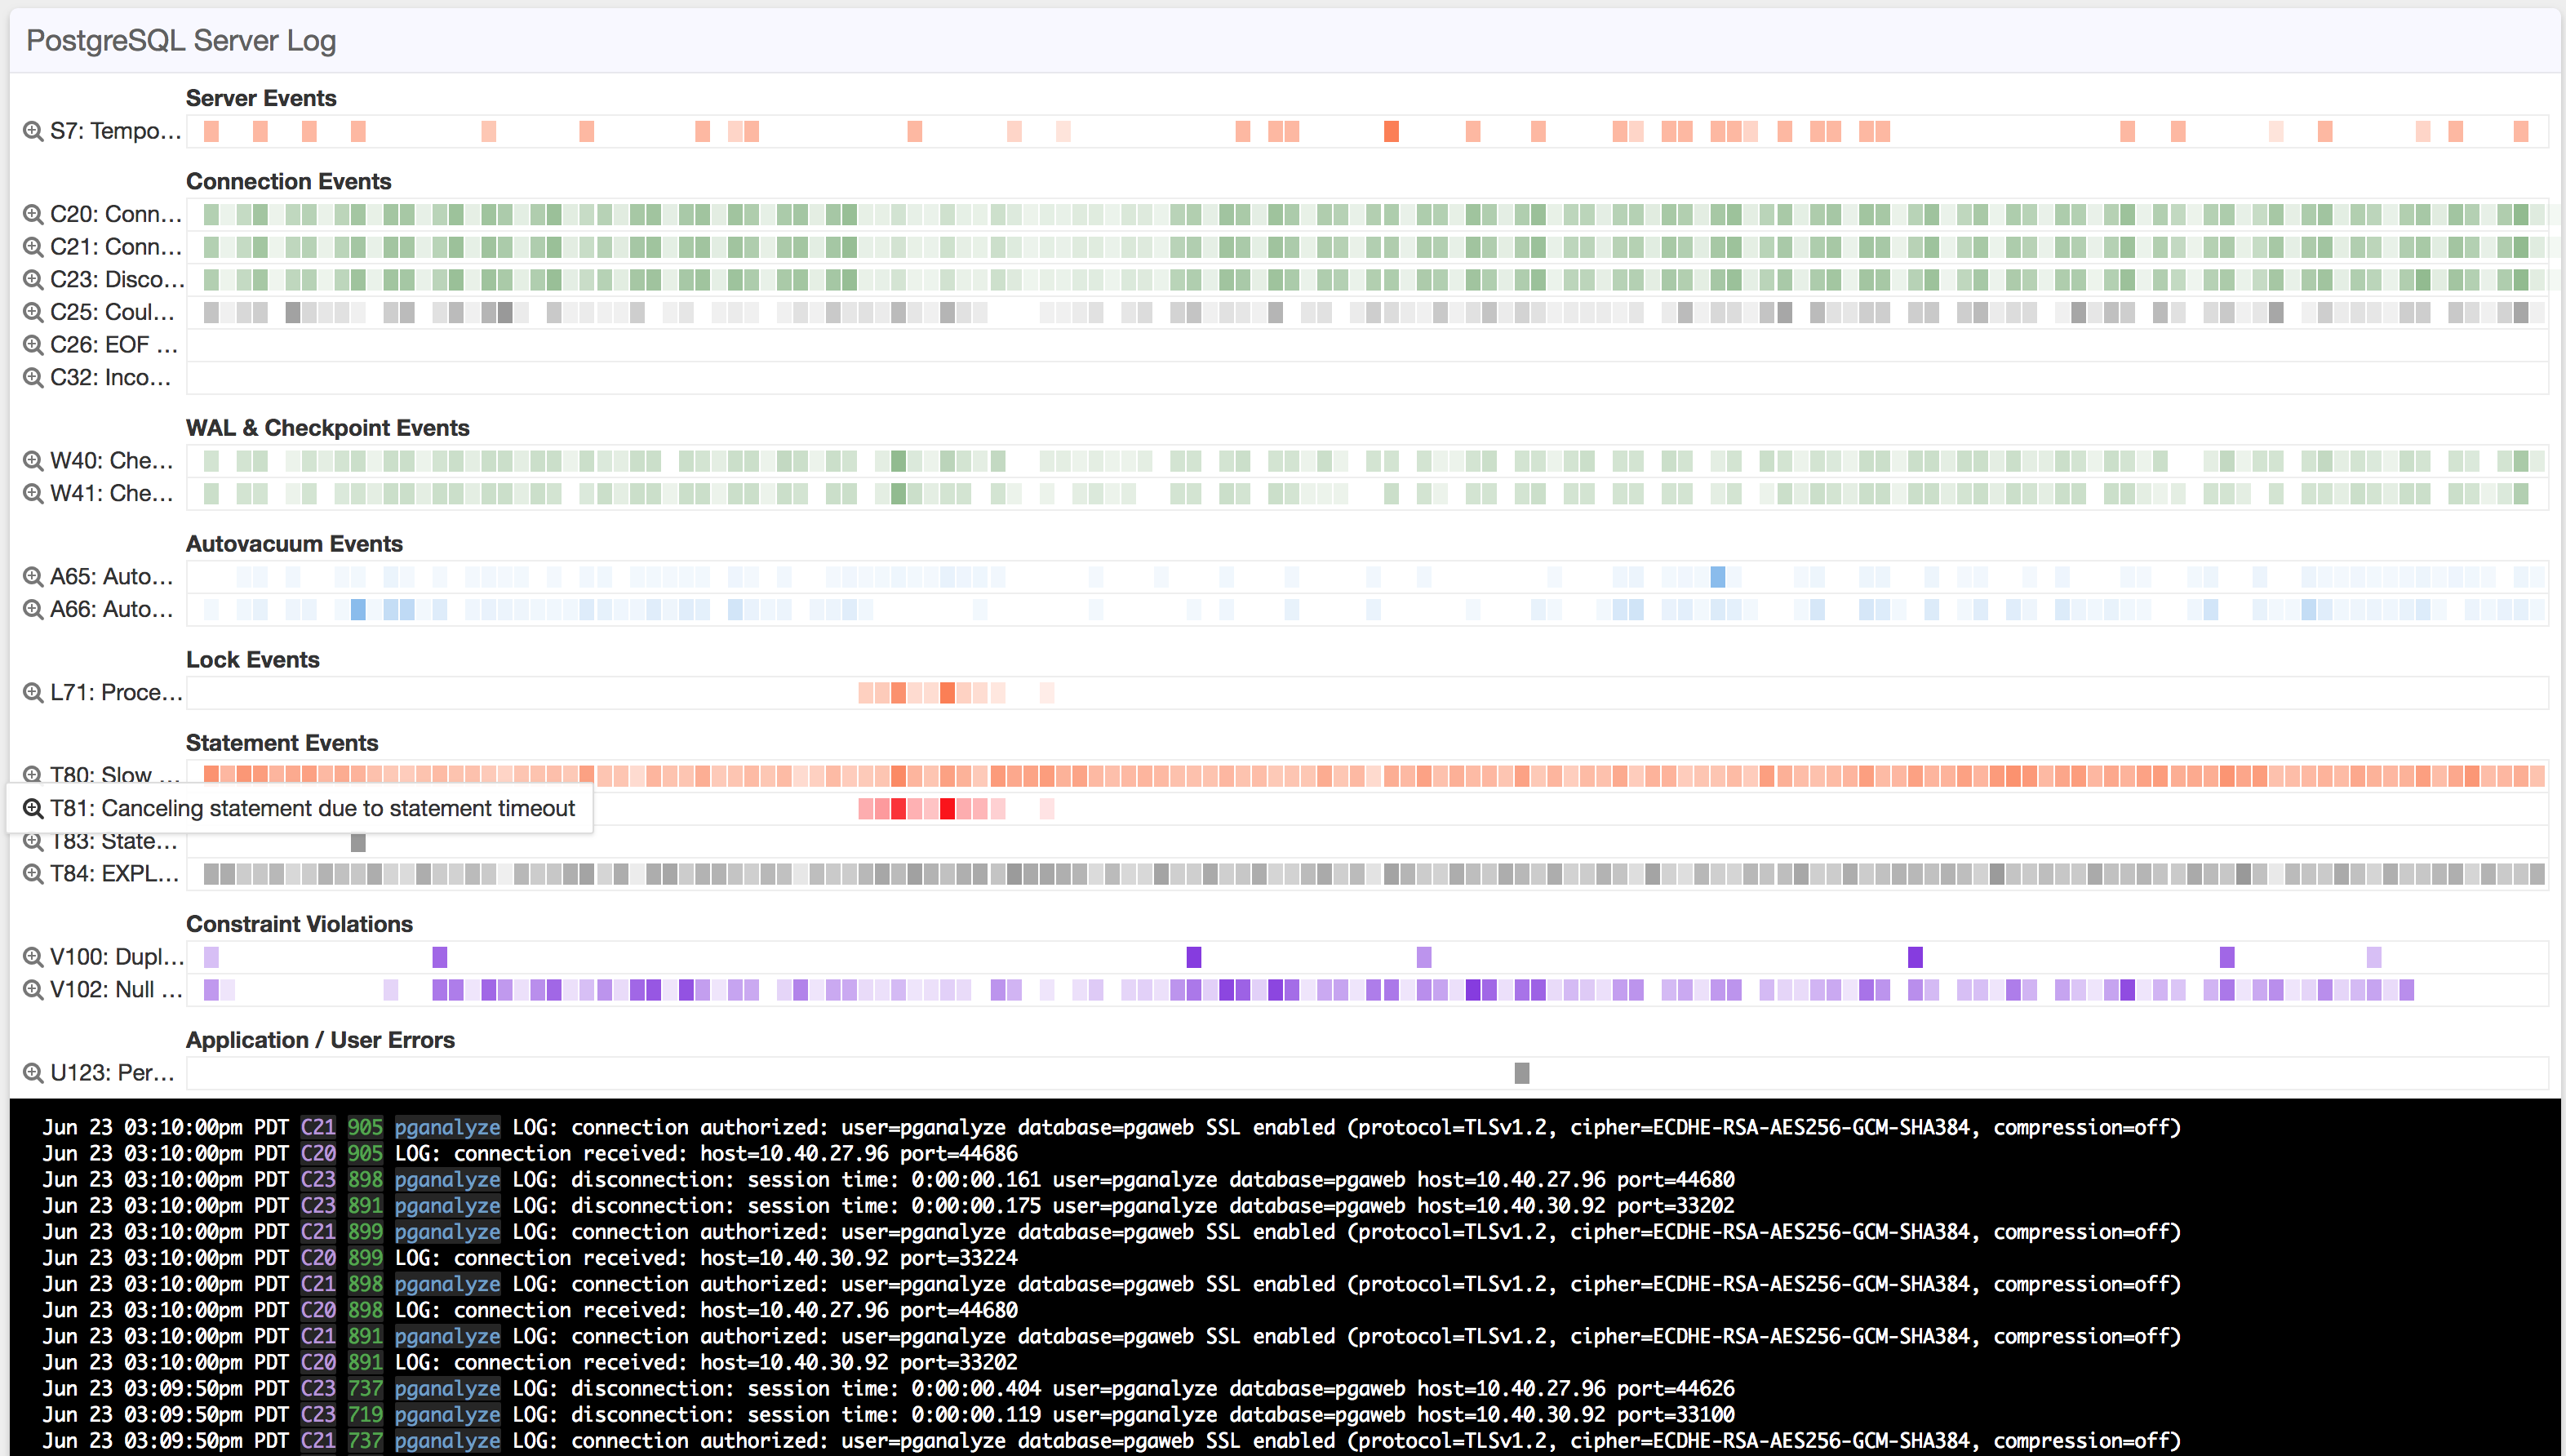
sudo systemctl restart pganalyze-collectorOnce ready, you will see log events on the Log Insights page in pganalyze.
We recommend setting up Automated EXPLAIN as a follow-up step, to automatically EXPLAIN slow queries in Postgres.
Couldn't find what you were looking for or want to talk about something specific?
Start a conversation with us →